2.2.2.4
Performance Management Framework
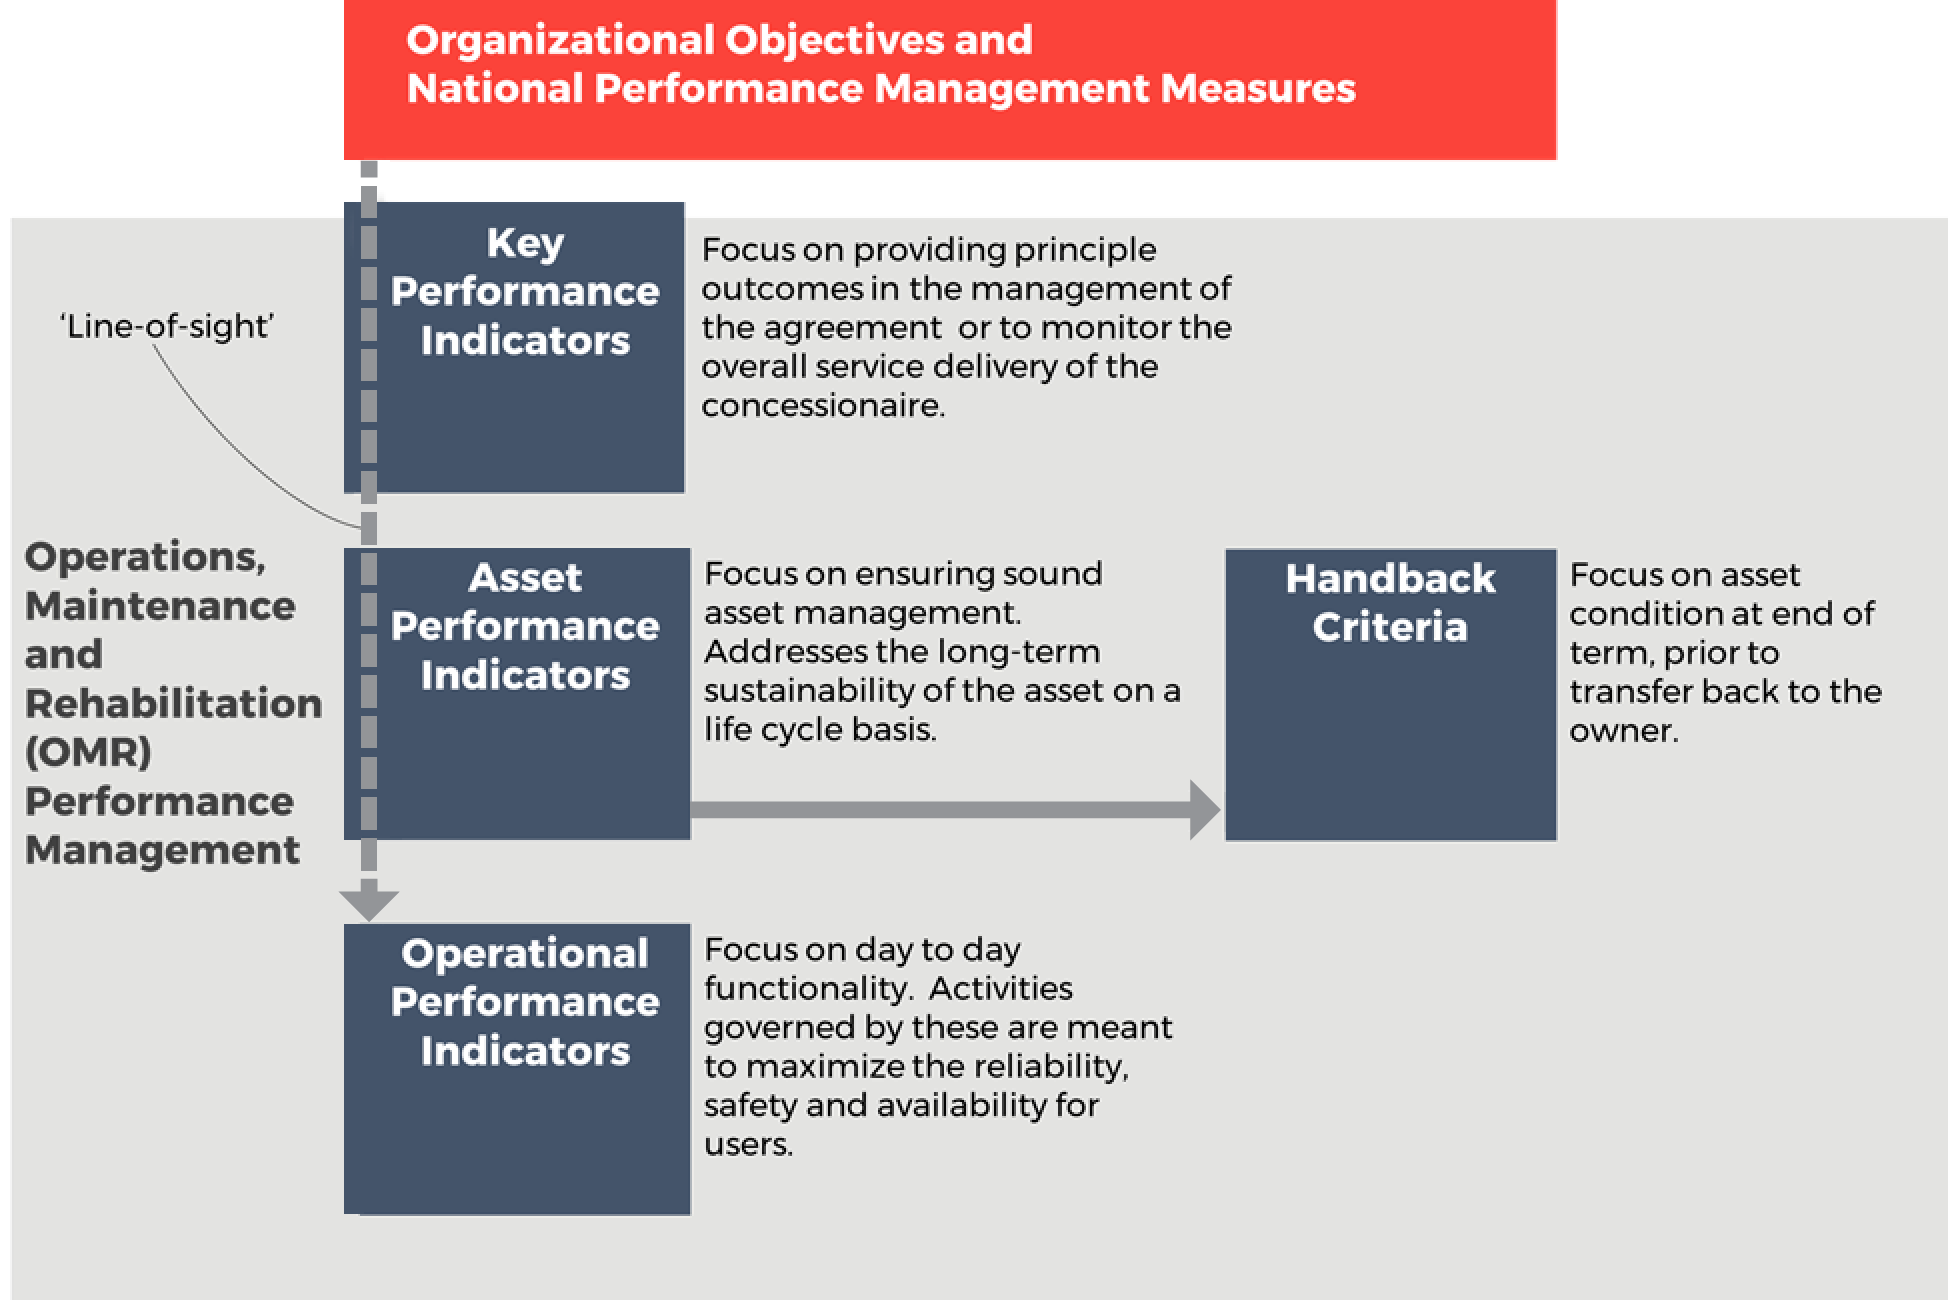
To support the alignment of agency policies, objectives and day-to-day practices, agencies may establish a tiered performance management framework, such as the example illustrated below for a model Design-Build-Finance-Maintain-Operate (DBFMO) project (Figure 2.5). The highest of the three levels, Key Performance Measures, defines the high-level outcomes for service delivery in terms of a few key strategic areas. The second level, Asset Preservation Performance Measures, defines the minimum acceptable condition levels for each of the individual assets to preserve their value. The third level, Operational Performance Measures, corresponds to the many specific requirements for operating and maintaining the highway in a safe manner on a day-to-day basis.
Further discussion on Performance Management Frameworks, defining Performance Measures and Performance Targets is included in Chapter 6.
Figure 2.5 Typical Performance Management Framework used in a DBFMO Project
For the transit community, TCRP Research Report 198 presents a framework for developing relationships between service quality and asset conditions, using a variety of transit system performance and customer satisfaction attributes. The research conducted in developing the report found many correlations between asset condition and performance, as noted below (Spy Pond Partners, et.al, 2018).
- Asset condition is related to the quality attributes of Frequency, Reliability, and Travel Speeds. As assets decline in condition, failures become more likely, reducing frequency, reliability, and average speeds.
- Asset condition is related to Appearance/Aesthetics in that customer perceptions of this factor are likely to be worse when assets are in poor condition and/or are technically obsolescent.
- Asset condition is related to other service quality attributes, including Comfort, Ease of Access, Environmental Impact, Information, Safety, and Security. For these attributes, increasing asset failures may affect quality, although the effects may be difficult to model. For instance, reduced service frequency resulting from increased failures can lead to greater crowding and less comfort. A particularly challenging area is safety. Given that operating severely deteriorated assets could compromise safety, in theory and in general practice, transit agencies establish thresholds for safe operations and remove an asset from service, rather than operating unsafely. Thus, potential safety issues tend to become operational issues, rather than actual safety issues. Regardless, customer perceptions are likely to be worse when assets are in poor condition for these factors, as in the case of Appearance/Aesthetics.
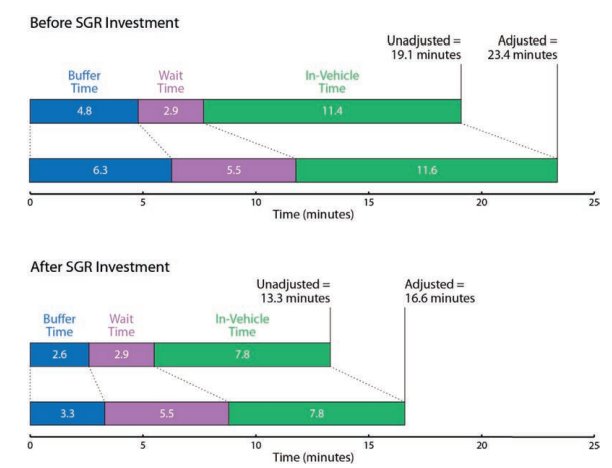
In one example, the impact of State of Good Repair (SGR) investment on the calculation of Effective Journey Time (EJT) is demonstrated. The example illustrates the differences in the calculated unadjusted and adjusted journey time, both before and after SGR investment, for a hypothetical rail line. Although the calculation is not based on actual data, it is intended to show that, after a SGR investment, both the adjusted and unadjusted journey times decrease. Before investment, the actual journey time for all components is 19.1 minutes, increasing to 23.4 minutes when adjustment factors are included. Following an investment in improved vehicles and track, these journey times decrease to 13.3 and 16.6 minutes. Looking closer at the components of time that change in this example, the decrease in buffer time after SGR investment indicates that travel times are more reliable and passengers do not have to build in as much buffer when planning their trips. Overall, in this example, SGR investments reduce EJT an average of 6.8 minutes per trip. This savings can be multiplied by an average value of time and number of trips per year to yield a prediction of the annual user benefit resulting from the investment. The results can be used in a variety of ways to analyze asset conditions and service quality.
Figure 2.5-B Comparing Adjusted and Unadjusted SGR Investment