Section 6.4
Monitoring Asset Work and Costs
As discussed previously in Chapter 2, in order to reliably assess current and future work needs over an asset’s life cycle, it is important to ensure completed maintenance and capital work activities are tracked and incorporated into the asset management programs. This section establishes the importance of tracking work history information, presents approaches to track the information and illustrates how work history information can be used to update and improve performance predictions.
6.4.1
Importance of Tracking Work Activities and Treatment Costs
This section describes the factors that should be considered for keeping
a management system current.
Why It Is Important to Track Work Activities and Treatment Costs
Asset management systems, such as pavement and bridge management tools, rely on the availability of complete, up-to-date inventory information to serve as the basis for all system recommendations. At a minimum, the most recent work activity and completion date are necessary for establishing an asset’s age or the length of time since work was last performed. These factors are key to setting a maintenance service interval or predicting the need for future work. Treatment cost information is used to estimate the cost of recommended work activities, so realistic numbers are important for planning and budgeting.
Work Activities
The level of detail required to track work histories is largely dependent on the sophistication and maturity of the asset management program. It is important to have access to information indicating when the asset was installed or constructed, or when the most recent major work activities were performed. Additional information about maintenance activities performed to preserve or improve the asset is beneficial if it can be provided efficiently and incorporated into decisions about managing an asset over its life cycle.
An agency should incorporate completed work activities into a management system at least annually, at the end of each construction season. At a minimum, the asset management database should be updated to reflect any changes to the asset properties, such as a change from a concrete to an asphalt pavement, and the date when the change was made.
Treatment Costs
Including the cost of maintenance and rehabilitation activities in a computerized maintenance system provides a historical record of how treatment costs have changed over time. The information from the management system, as well as bid documents, can be used to establish unit costs for each type of work activity possibly recommended by the system. Unit prices for each work activity included in the system are needed.
For many transportation projects, improving the condition of the asset is only one part of the total cost of a project. There are many other costs to incorporate into the unit price when estimating the cost of a treatment recommendation, including the cost of pavement markings, guardrails and signs on a pavement project. If these costs are ignored, the cost of a project will be underestimated, and an agency may program more work than can be constructed over a given timeframe. Some agencies inflate treatment costs by a factor of 30 to 40 percent to ensure the costs associated with project design and the improvement of ancillary assets are considered in the unit cost for a given treatment. Using this approach, $0.30 to $0.40 is added to every dollar associated with the cost of the work itself. The inflated cost (e.g., $1.40) is stored in the management system as the unit cost for estimating treatment costs.
Different unit costs may also be established to reflect different costs in urban and rural areas, or in different geographic regions of a state. These differences improve the accuracy of asset budgeting activities by reflecting the realities agencies face due to work activities in highly congested areas, differences in the availability of contractors and the scarcity of materials in certain areas.
In addition to being used to estimate budget needs, treatment cost information serves many other purposes. For instance, the cost of a proposed project and its expected life can be used to determine a Return on Investment to help ensure that the most cost-effective projects are being selected. The information can also be used to compare the effectiveness of one treatment over another, or one life cycle strategy over another. Cost information has also been used to demonstrate the benefits to using proactive maintenance across a transportation network rather than reactive maintenance.
Montana, Tennessee, and Utah DOTs
Several state DOTs are employing the use of technology to track maintenance work activities as noted below.
When new assets are installed as part of a construction project for the Montana DOT, Construction personnel are required to provide Maintenance with the information needed for updating the asset inventory. Maintenance verifies the information provided by Construction before inputting it into the system.
The Tennessee DOT uses an automated data collection van to establish its asset inventory for approximately 20 assets. The inventory is entered into a maintenance management system at a summary level for each county and a “ghosting” technique is used to identify differences in the inventory from one year to the next year.
The Utah DOT extracts is asset inventory every two to three years from the LiDAR collected as part of the agency’s annual pavement condition surveys; however, the DOT is moving towards a continuous inventory updating process that would be the responsibility of Maintenance supervisors.
6.4.2
Establishing Business Processes to Support Work History and Cost Tracking
To ensure that work history and treatment cost information is kept current, business processes should be established to maintain the data over time. This section stresses the importance of building business processes to update the data regularly.
Assign Responsibility
One of the first steps in establishing business processes to support the maintenance of work history and cost information is assigning responsibility to the appropriate person for managing the information. The individual assigned responsibility for updating work history and cost data in the management system is not always the individual responsible for providing the data. For example, some agencies assign responsibility for updating completed work history and treatment cost information to the maintenance or construction division, since they are typically involved in closing out a project. Regardless of who is assigned responsibility for the task, a clear line of accountability should be established as part of the business process.
Establish Processes to Update Work Activities
As discussed in Chapter 7, technology is improving agencies’ ability to track completed work activities, so the information is available for use in an asset management system. The access to handheld data entry devices with map interfaces linked to a centralized database helps ensure all users of the information have immediate access to current and consistent information. Business processes reliant on field personnel to remember to provide information to another data user are generally not sustainable.
To help establish a reliable approach for keeping asset data current, an agency may consider developing a data and process flow map illustrating the flow and use of data across the agency. This type of document helps an agency better understand where the data comes from, where it is stored, who uses the information and what levels of access various users need. A data and process flow map may become part of an agency’s data governance documentation in order to protect the integrity of asset data.
Build Buy-In To Support the Business Processes
Key to the success of any business process is establishing buy-in among the individuals responsible for each required step. This involves familiarizing the individuals with their responsibilities, providing tools and guidance for completing the activities efficiently and effectively and demonstrating how the information is used to support agency decisions.
Florida DOT
To ensure that the asset inventory remains current, the Florida DOT assigns district personnel responsibility for maintaining asset inventories and establishes guidance that no data in the inventory can be more than five years old. For new construction projects, it is required that the inventory be updated within 90 days of completion. The Florida DOT district offices develop a Quality Control (QC) plan and perform a QC check on the data at least once a year. The Florida DOT Central Office develops a Quality Assurance Review (QAR) plan and performs a QAR on the district’s QC process and spot checks the data in the field. As a result of these requirements, the Florida DOT has a high degree of confidence in the numbers used for budgeting activities.
6.4.3
Using Work History Information to Improve Models
The availability of current work history and performance data allows agencies to develop and improve models used in a management system to predict future conditions and determine treatment effectiveness. This section describes and illustrates the use of this data to improve existing models.
Developing and Improving Asset Deterioration Models
An important function of an asset management system is the ability to predict asset deterioration rates so changes in condition over time can be modeled for use in planning and programming activities. In the absence of data, models can be developed based on expert judgment, but as historical performance trends are established based on actual data, the expert models should be replaced by or calibrated against the real data.
The AASHTO Transportation Asset Management Guide: A Focus on Implementation (2011) introduced the following thought process to help an agency evaluate their deterioration models and determine whether improved data is needed to enhance future forecasts:
- If there is disagreement with the timing for recommending a treatment, what is the difference? Does a difference of one to two years make a substantial difference to the program? This type of difference is typically the result of the program optimization models.
- If there is disagreement with the treatment, are the differences substantial, such as deck repairs versus bridge replacement? These differences are often the result of treatment rules but may indicate that deterioration rates are not correct. The deterioration model parameters may need to change (e.g., change traffic considerations or geographic location) or there may have been some work performed that the model is not aware of.
- If the differences are irreconcilable, the agency may decide to investigate the model setup and analysis further or may conduct research to see how other agencies have resolved similar issues.
Determining Treatment Effectiveness
The availability of work history and performance data also makes it possible to determine the effectiveness of different types of treatments over time. By adding cost information to an effectiveness analysis, an agency can determine the long-term cost-effectiveness of different treatment strategies.
North Carolina DOT
The North Carolina DOT conducted an analysis to determine the effectiveness of an open-graded friction course and a surface constructed with a FC-2 (friction course) gradation. Data from the pavement management database was used, including inventory data, construction information and pavement condition ratings. The performance data were plotted against the survey year for each pavement section where one of the two types of surface friction courses was applied. The results showed the performance of the open-graded friction course dropped at year 10, while the FC-2 graded surface dropped in performance at year 8. The study also found that all FC-2 sections had received another treatment by year 11. The results from the analysis were used to increase the use of open-graded friction courses across the state.
South Dakota DOT
In 2011, the South Dakota DOT initiated a project to revise the pavement deterioration models developed in 1997 using 17 years of historical pavement condition data. The tool for developing the models included features allowing all the condition-versus-age data points for each pavement meeting the family description (based on surface type and pavement structure) to be plotted on a graph, facilitating a comparison of the historical model and the recommended model based on the updated pavement condition information. In this example, the blue line (labeled as the user-defined model) represents the model being used in the pavement management system for predicting faulting on a thick, short-jointed doweled concrete pavement and the gold line (labeled as the regression equation). The regression analysis on the historical data, represented by the red data points, indicates faulting is occurring at a much more accelerated rate than was previously predicted. As a result, recommendations for addressing faulting were likely lagging the actual need observed in the field.
Illustration Showing How Historical Data can be Used to Modify a Deterioration Model
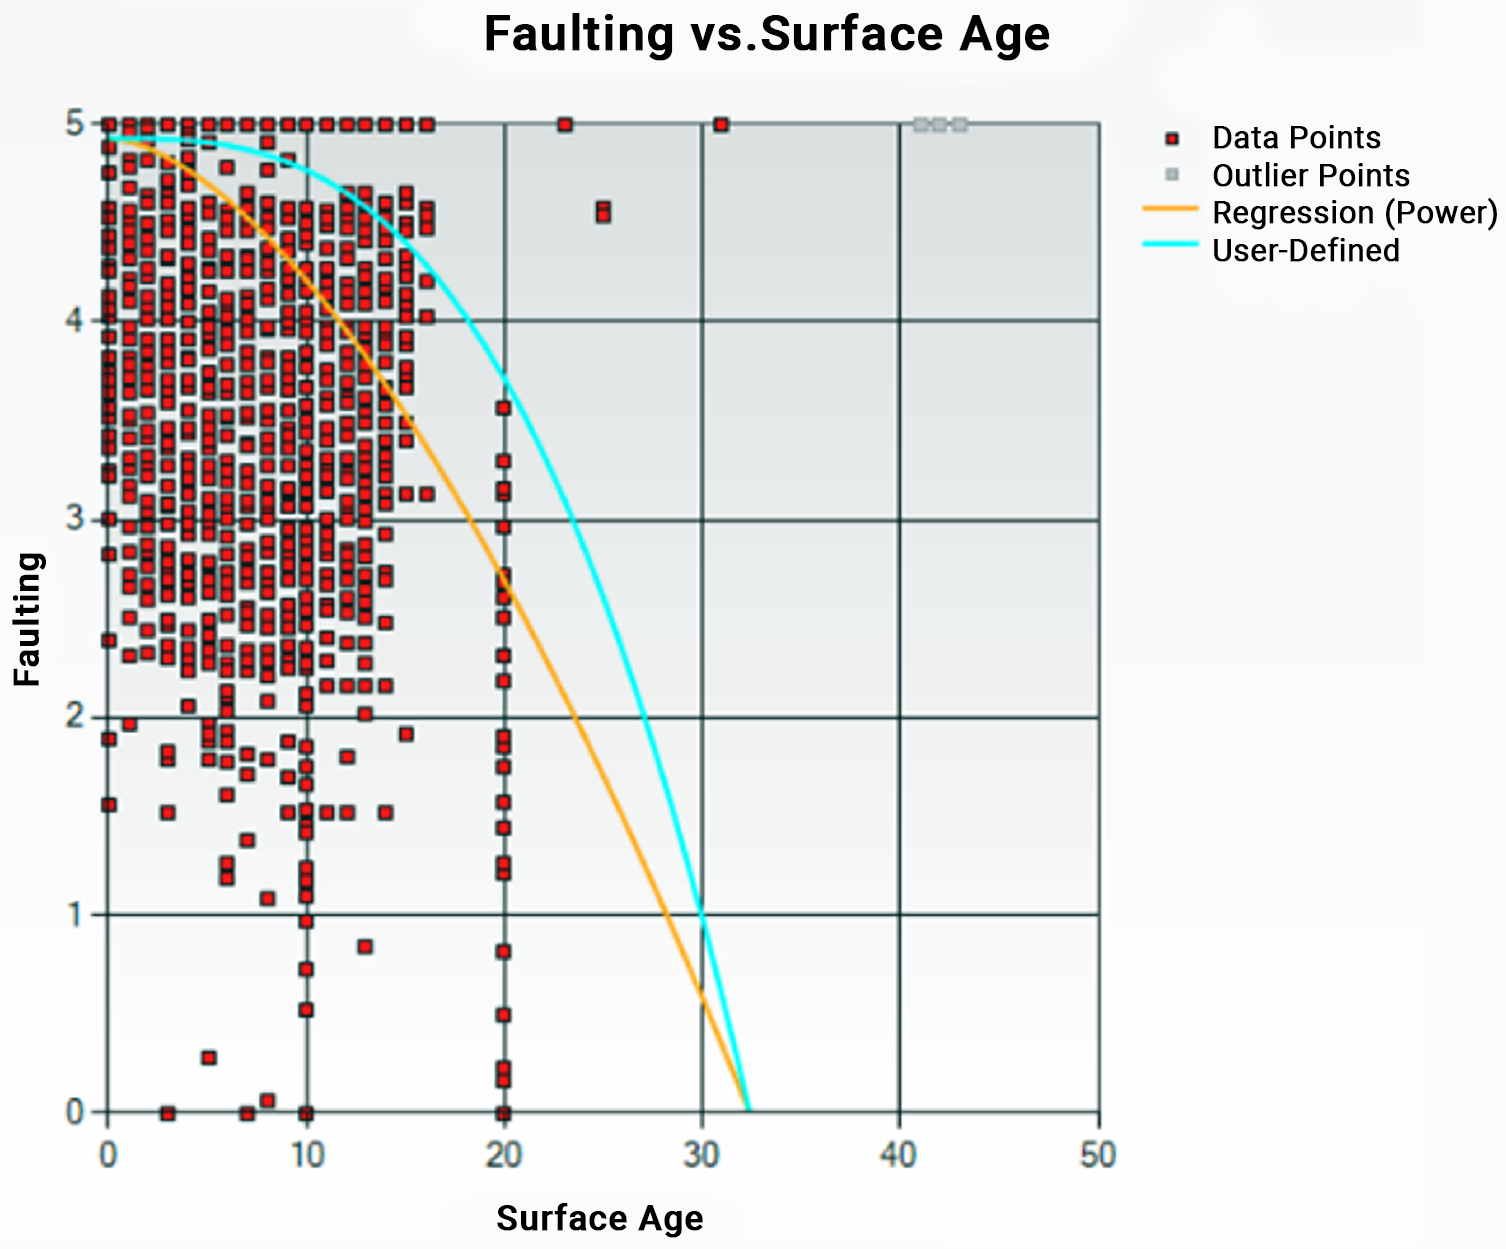
Source: South Dakota DOT. 2012. Technical Memo/Software Documentation
New Zealand Transport Agency
The Auckland Harbour Bridge corrosion protective coating system has been undergoing regular maintenance since the bridge opening in 1959. Historic practice was to spot abrasive blast corroded surfaces followed by spot painting and applying a full overcoat. While this process was effective in maintaining the protective coating, it also resulted in significant amount of contaminates being discharged into the Waitematā Harbour despite of the precautions being taken.
In an effort to reduce the discharge, various options have been considered taking into account the protective coating performance and longevity, with the aim to achieve the lowest practicable environmental discharge and whole of life costs.
One option involved collecting the abrasive blasting removal of the coating via the use of full scale containment to capture contaminants. However, it was found that this option would require strengthening of the bridge to safely carry the containment under wind loading at a cost of NZ$65M over a 10-year period.
As such, by undertaking a comprehensive review of the coating maintenance, a 40 years Coatings Maintenance Plan was developed. The identified lowest whole of life solution involved:
- On the land spans, use of full containment (where it could be supported from the ground), allowing for the full removal of the coating system via abrasive blasting, and its full reinstatement. These spans are to be left as long as possible before reinstating the protective coating, while ensuring minimal, if any section loss, to the steel superstructure.
- Spot repair and overcoating of other spans to maintain the existing coating for as long as practicably possible. A more proactive intervention approach is also adopted while using abseil techniques to minimise access costs.
- An outcomes based approach for consenting purposes that involved the establishment of low level discharge limits for contaminants deemed to be environmentally safe. This enables small areas of abrasive blasting without full containment for spans other than above land.
Thus, allowing for the continued corrosion protection of the bridge 125,000m2 external surface areas in a marine environment, while providing a cost effective and environmentally responsible solution.
Source: https://www.icevirtuallibrary.com/doi/abs/10.1680/jbren.18.00051
Toronto Transit Commission
The Toronto Transit Commission initiated a review to determine optimal bus life for their fleet as well as assess the potential for hybrid propulsion technology. Through specialized modelling methods, a data-driven approach was used to assess the total cost of ownership (TCO) for their fleet vehicles. This review analyzed historical asset work order records along with other capital and operating expenses to help identify the optimal asset life cycle. The four key areas analyzed were:
- Procurement/Installation: Asset Design Specifications & Procurement Cost
- Operations & Maintenance: Labor, Parts, Fuel (if applicable), Consumable Items and Outsourced Work
- Overhaul/Rehabilitation: Major Asset Refurbishment/Component Replacement Cost (ex. Transit Bus Transmission Rebuild or Facility Rehabilitation)
- Disposition: Salvage Value (End-of-Life)
The model provided insights on when the optimal time to dispose of a fleet vehicle to minimize overall fleet cost, the comparative TCO of different vehicle types, and the relative effect and up-time benefit gained for different operations and maintenance activities or rehab treatments, by engine or other component types used in the fleet. They advanced their understanding of treatment effectiveness and allowed them to make more informed decisions about fleet renewal.
Washington State DOT
The Washington State DOT conducted a pavement life cycle analysis using performance and cost data that demonstrated the cost-effectiveness of its pavement preservation projects. Based on the results that are documented in their Transportation Asset Management Plan (https://www.wsdot.wa.gov/sites/default/files/filefield_paths/WSDOT_TAMP_2019_Web.pdf), the DOT instituted a “one touch policy” requiring all capital projects to have had at least one pavement maintenance treatment by Maintenance or contracted work forces before it can be programmed for a pavement preservation project. This has enabled the DOT to defer capital improvements on pavements by two to three years, or in instances of multiple touches, by four to six years at a very low cost. In 2018, the agency received an additional $6 million to test a similar program on bridges. In addition to being a cost-effective use of available funds, the programs have helped build buy-in among maintenance personnel by demonstrating the importance of the data they collect.
Montana, Tennessee, and Utah DOTs
Several state DOTs are employing the use of technology to track maintenance work activities as noted below.
When new assets are installed as part of a construction project for the Montana DOT, Construction personnel are required to provide Maintenance with the information needed for updating the asset inventory. Maintenance verifies the information provided by Construction before inputting it into the system.
The Tennessee DOT uses an automated data collection van to establish its asset inventory for approximately 20 assets. The inventory is entered into a maintenance management system at a summary level for each county and a “ghosting” technique is used to identify differences in the inventory from one year to the next year.
The Utah DOT extracts is asset inventory every two to three years from the LiDAR collected as part of the agency’s annual pavement condition surveys; however, the DOT is moving towards a continuous inventory updating process that would be the responsibility of Maintenance supervisors.
Florida DOT
To ensure that the asset inventory remains current, the Florida DOT assigns district personnel responsibility for maintaining asset inventories and establishes guidance that no data in the inventory can be more than five years old. For new construction projects, it is required that the inventory be updated within 90 days of completion. The Florida DOT district offices develop a Quality Control (QC) plan and perform a QC check on the data at least once a year. The Florida DOT Central Office develops a Quality Assurance Review (QAR) plan and performs a QAR on the district’s QC process and spot checks the data in the field. As a result of these requirements, the Florida DOT has a high degree of confidence in the numbers used for budgeting activities.
North Carolina DOT
The North Carolina DOT conducted an analysis to determine the effectiveness of an open-graded friction course and a surface constructed with a FC-2 (friction course) gradation. Data from the pavement management database was used, including inventory data, construction information and pavement condition ratings. The performance data were plotted against the survey year for each pavement section where one of the two types of surface friction courses was applied. The results showed the performance of the open-graded friction course dropped at year 10, while the FC-2 graded surface dropped in performance at year 8. The study also found that all FC-2 sections had received another treatment by year 11. The results from the analysis were used to increase the use of open-graded friction courses across the state.
South Dakota DOT
In 2011, the South Dakota DOT initiated a project to revise the pavement deterioration models developed in 1997 using 17 years of historical pavement condition data. The tool for developing the models included features allowing all the condition-versus-age data points for each pavement meeting the family description (based on surface type and pavement structure) to be plotted on a graph, facilitating a comparison of the historical model and the recommended model based on the updated pavement condition information. In this example, the blue line (labeled as the user-defined model) represents the model being used in the pavement management system for predicting faulting on a thick, short-jointed doweled concrete pavement and the gold line (labeled as the regression equation). The regression analysis on the historical data, represented by the red data points, indicates faulting is occurring at a much more accelerated rate than was previously predicted. As a result, recommendations for addressing faulting were likely lagging the actual need observed in the field.
Illustration Showing How Historical Data can be Used to Modify a Deterioration Model
Source: South Dakota DOT. 2012. Technical Memo/Software Documentation
New Zealand Transport Agency
The Auckland Harbour Bridge corrosion protective coating system has been undergoing regular maintenance since the bridge opening in 1959. Historic practice was to spot abrasive blast corroded surfaces followed by spot painting and applying a full overcoat. While this process was effective in maintaining the protective coating, it also resulted in significant amount of contaminates being discharged into the Waitematā Harbour despite of the precautions being taken.
In an effort to reduce the discharge, various options have been considered taking into account the protective coating performance and longevity, with the aim to achieve the lowest practicable environmental discharge and whole of life costs.
One option involved collecting the abrasive blasting removal of the coating via the use of full scale containment to capture contaminants. However, it was found that this option would require strengthening of the bridge to safely carry the containment under wind loading at a cost of NZ$65M over a 10-year period.
As such, by undertaking a comprehensive review of the coating maintenance, a 40 years Coatings Maintenance Plan was developed. The identified lowest whole of life solution involved:
- On the land spans, use of full containment (where it could be supported from the ground), allowing for the full removal of the coating system via abrasive blasting, and its full reinstatement. These spans are to be left as long as possible before reinstating the protective coating, while ensuring minimal, if any section loss, to the steel superstructure.
- Spot repair and overcoating of other spans to maintain the existing coating for as long as practicably possible. A more proactive intervention approach is also adopted while using abseil techniques to minimise access costs.
- An outcomes based approach for consenting purposes that involved the establishment of low level discharge limits for contaminants deemed to be environmentally safe. This enables small areas of abrasive blasting without full containment for spans other than above land.
Thus, allowing for the continued corrosion protection of the bridge 125,000m2 external surface areas in a marine environment, while providing a cost effective and environmentally responsible solution.
Source: https://www.icevirtuallibrary.com/doi/abs/10.1680/jbren.18.00051
Toronto Transit Commission
The Toronto Transit Commission initiated a review to determine optimal bus life for their fleet as well as assess the potential for hybrid propulsion technology. Through specialized modelling methods, a data-driven approach was used to assess the total cost of ownership (TCO) for their fleet vehicles. This review analyzed historical asset work order records along with other capital and operating expenses to help identify the optimal asset life cycle. The four key areas analyzed were:
- Procurement/Installation: Asset Design Specifications & Procurement Cost
- Operations & Maintenance: Labor, Parts, Fuel (if applicable), Consumable Items and Outsourced Work
- Overhaul/Rehabilitation: Major Asset Refurbishment/Component Replacement Cost (ex. Transit Bus Transmission Rebuild or Facility Rehabilitation)
- Disposition: Salvage Value (End-of-Life)
The model provided insights on when the optimal time to dispose of a fleet vehicle to minimize overall fleet cost, the comparative TCO of different vehicle types, and the relative effect and up-time benefit gained for different operations and maintenance activities or rehab treatments, by engine or other component types used in the fleet. They advanced their understanding of treatment effectiveness and allowed them to make more informed decisions about fleet renewal.
Washington State DOT
The Washington State DOT conducted a pavement life cycle analysis using performance and cost data that demonstrated the cost-effectiveness of its pavement preservation projects. Based on the results that are documented in their Transportation Asset Management Plan (https://www.wsdot.wa.gov/sites/default/files/filefield_paths/WSDOT_TAMP_2019_Web.pdf), the DOT instituted a “one touch policy” requiring all capital projects to have had at least one pavement maintenance treatment by Maintenance or contracted work forces before it can be programmed for a pavement preservation project. This has enabled the DOT to defer capital improvements on pavements by two to three years, or in instances of multiple touches, by four to six years at a very low cost. In 2018, the agency received an additional $6 million to test a similar program on bridges. In addition to being a cost-effective use of available funds, the programs have helped build buy-in among maintenance personnel by demonstrating the importance of the data they collect.