2.2.2
Performance Management
Asset management utilizes performance management to set objectives, define measures, establish targets, and monitor results. Transportation Performance Management (TPM) relies on the TAM principles and process to help achieve the agency's broader goals and objectives.
Relationship to Federal TPM Activities
The MAP-21 Act (2012) established a performance-based program intended to focus Federal Aid highway program and public transportation system (e.g., bus, light rail, and ferry) investments on national transportation goals. It was also intended to increase accountability and transparency in the use of federal transportation funds, as well as improve project decision-making through the strategic use of system performance information. The performance-based provisions of MAP-21 were retained in the FAST Act in 2015.
TPM is defined by FHWA as a strategic approach to making investment and policy decisions to achieve national performance goals using system information in accordance with rules established by the Department of Transportation (see Figure 2.3). The FHWA recognizes asset management as the application of TPM to manage the condition of infrastructure assets needed to provide for mobility and safety in the nation’s transportation system. In short, the FHWA refers to asset management as the engine driving infrastructure performance.
Figure 2.3 FHWA's Strategic Approach to TPM
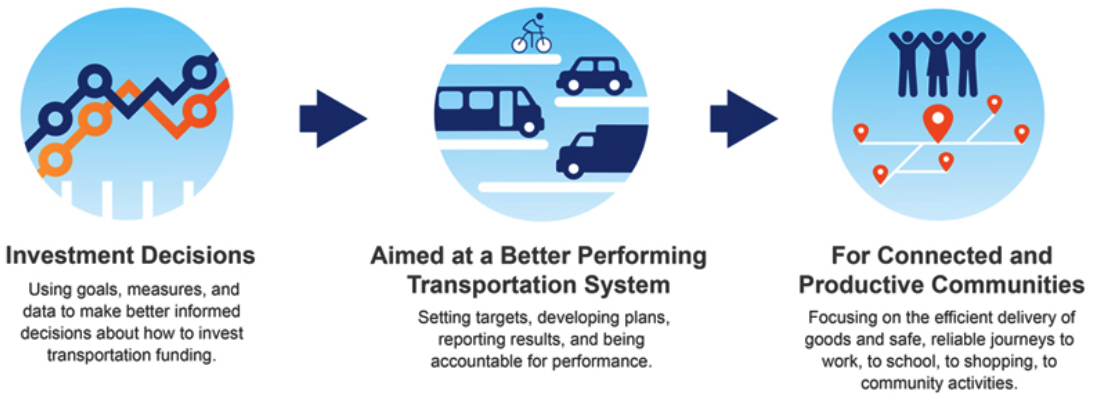
Source: FHWA TPM Homepage. 2019 https://www.fhwa.dot.gov/tpm/
Asset management plans document the processes and investment strategies developed by an agency to manage its infrastructure assets. These asset management plans support an agency’s performance-based planning and programming processes for making long-term investment decisions and feed shorter-term project and treatment selection activities. Together, these activities ensure the investment decisions of an agency are aligned with performance objectives and goals.
TPM Regulations
The TPM provisions for highways included in federal law are implemented in accordance with rulemakings organized around the following six elements:
- National goals – focusing the Federal Aid highway program on the seven areas listed below:
- Congestion reduction
- System reliability
- Environmental sustainability
- Freight and economic vitality
- Infrastructure condition
- Reduced project delivery delays
- Safety
- Measures – assessing performance or condition in carrying out the TPM-based Federal Aid highway program
- Targets – funding recipients are required to document future performance expectations under a fiscally-constrained environment
- Plans – identifying strategies and investments for addressing performance needs
- Reports – documenting progress toward target achievement and investment effectiveness
- Accountability and transparency – requiring federal funding recipients to achieve or make significant progress toward targets
TPM Relationship with TAM
There is a close relationship between TPM and TAM, since both consider asset and system performance, risks and available resources to achieve desired objectives over time. Both rely on a strategic approach, using data to make investment and policy decisions in order to achieve performance objectives. Internationally, there is less distinction between asset management and performance management, with the IAM defining asset management as encompassing the “balancing of cost, opportunities and risks against the desired performance of assets to achieve the organizational objectives.” In the United States, TAM applies to the technical and financial decisions, plans and actions related to physical infrastructure, while TPM considers a broad range of system performance categories.
A graphic illustrating the integration of asset management and performance management is provided in Figure 2-4. In the figure, the circle on the left represents the interconnection of the various performance areas that transportation agencies are concerned with throughout their planning processes. Flowing into the performance circle is the asset management circle, representing an agency’s infrastructure needs to support system performance.
The FHWA’s Expert Task Group (ETG) published a white paper explaining the relationship between asset management and performance management. It acknowledges the performance of a transportation system is dependent on many factors, including operational characteristics, and system usage and demand, in addition to the physical condition of the infrastructure assets. The paper explains that “performance management focuses on how policies, resource allocation, and other decisions affect all aspects of system performance including safety, operations, environmental stewardship, and infrastructure condition.” (FHWA 2019) Asset management is described as an application of performance management principles with a long-term focus to manage the performance of infrastructure assets, the resources allocated to operate a transportation system, and the investments made to achieve the agency’s long-term goals and objectives.
Figure 2.4 Integration of Performance Management and TAM
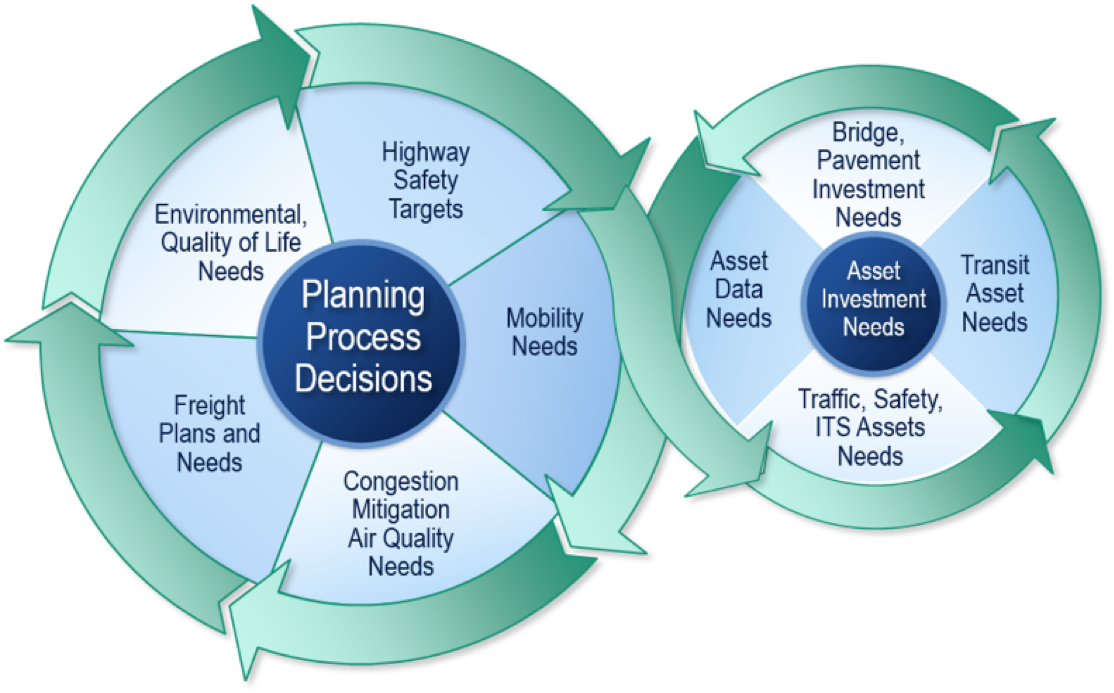
Source: NHI 136106A, Introduction to Transportation Asset Management. 2019
British Columbia
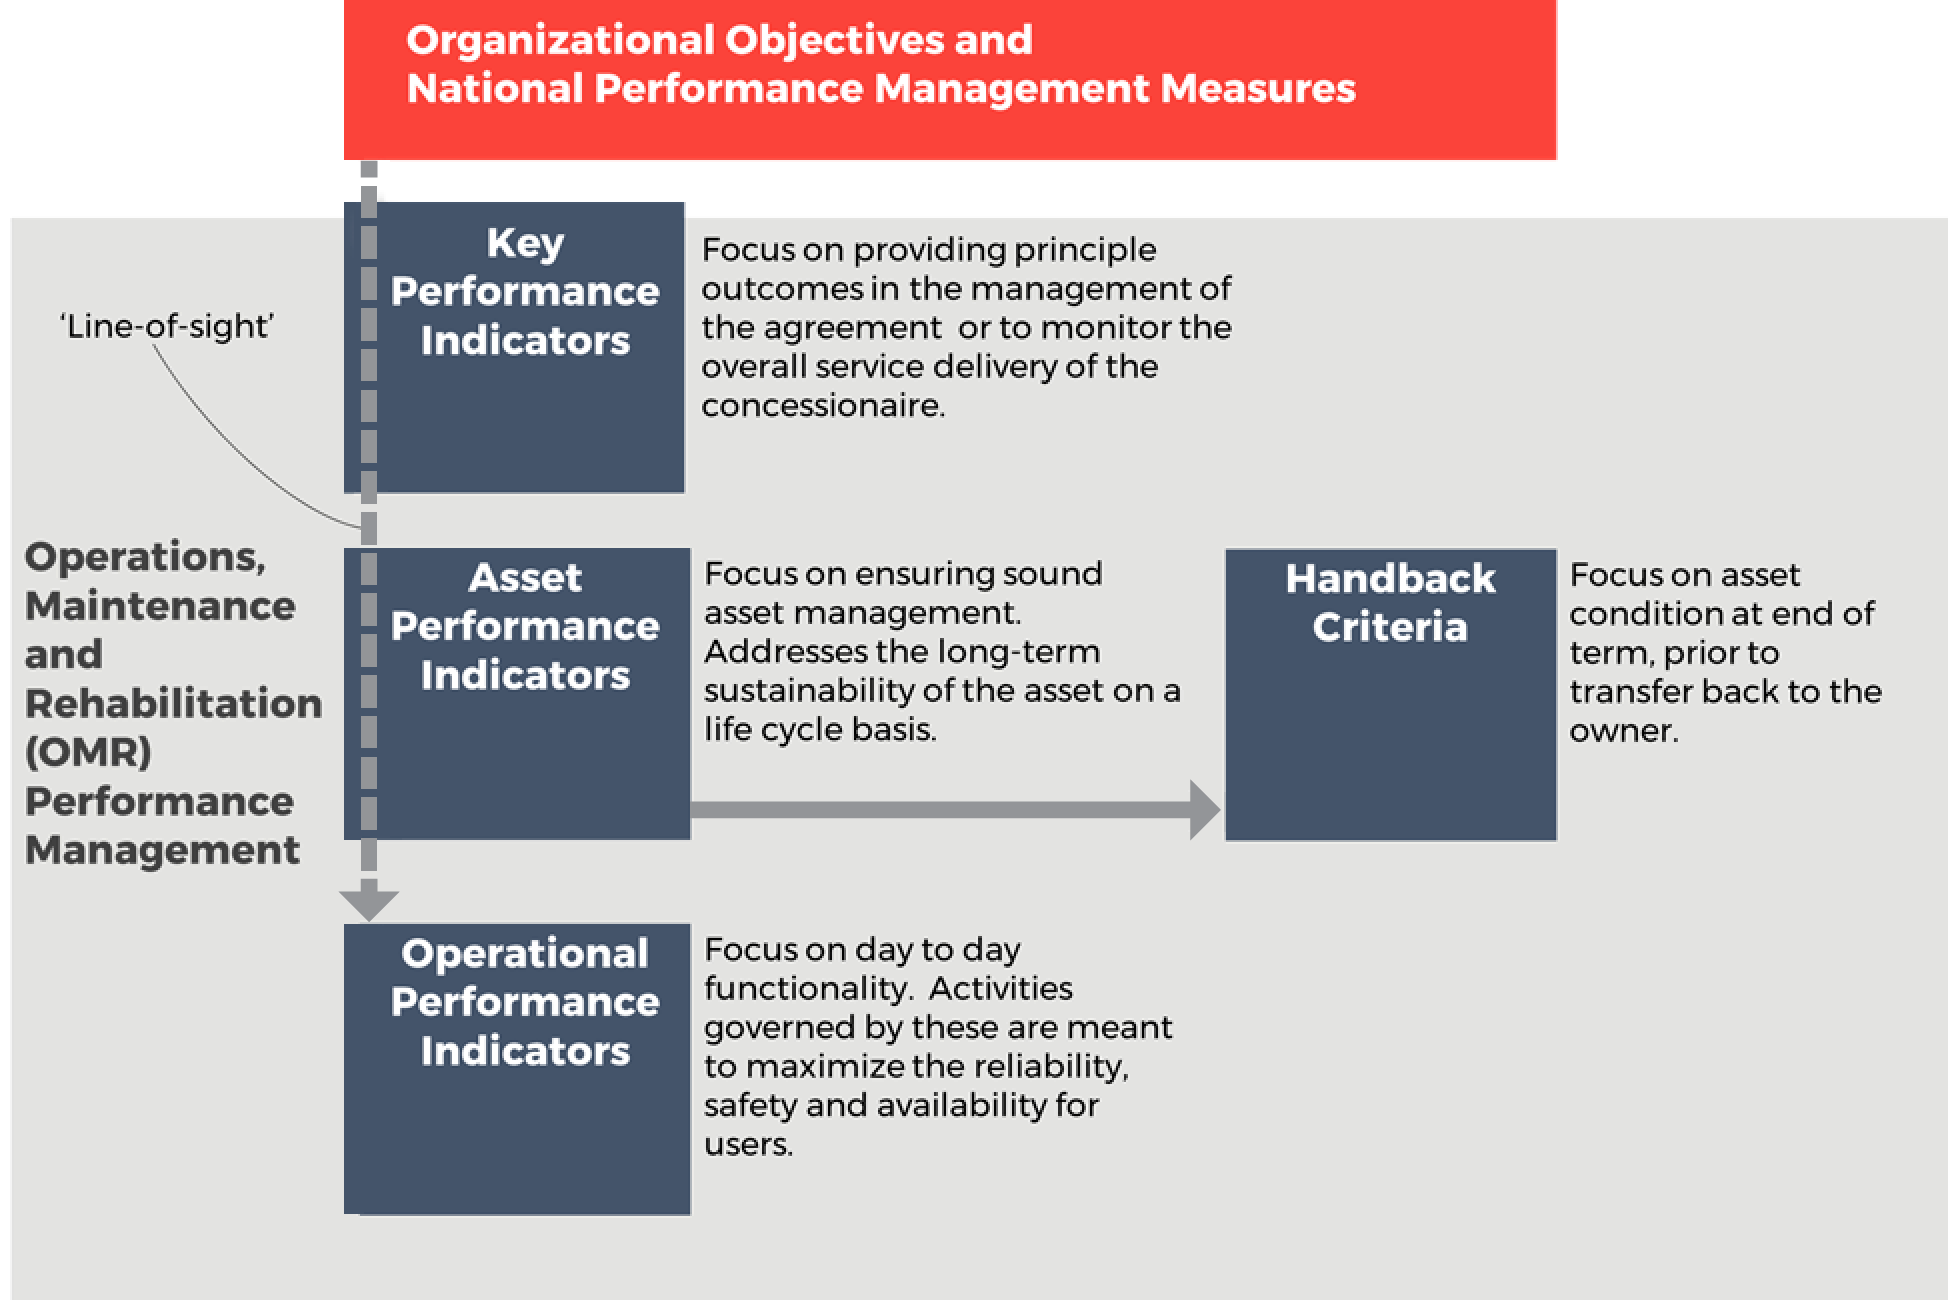
To support the alignment of agency policies, objectives and day-to-day practices, the Province of British Columbia established the tiered structure shown in Figure 2.5 for a design-build-finance-operate project. The highest of the three levels, Key Performance Measures, defines the high-level outcomes for service delivery in terms of a few key strategic areas. The second level, Asset Preservation Performance Measures, defines the minimum acceptable condition levels for each of the individual assets to preserve their value. The third level, Operational Performance Measures, corresponds to the many specific requirements for operating and maintaining the highway in a safe manner on a day-to-day basis. The tiered approach helped align stakeholders at all levels and clarified priorities for all parties.
Performance Management Framework
To support the alignment of agency policies, objectives and day-to-day practices, agencies may establish a tiered performance management framework, such as the example illustrated below for a model Design-Build-Finance-Maintain-Operate (DBFMO) project (Figure 2.5). The highest of the three levels, Key Performance Measures, defines the high-level outcomes for service delivery in terms of a few key strategic areas. The second level, Asset Preservation Performance Measures, defines the minimum acceptable condition levels for each of the individual assets to preserve their value. The third level, Operational Performance Measures, corresponds to the many specific requirements for operating and maintaining the highway in a safe manner on a day-to-day basis.
Further discussion on Performance Management Frameworks, defining Performance Measures and Performance Targets is included in Chapter 6.
Figure 2.5 Typical Performance Management Framework used in a DBFMO Project
For the transit community, TCRP Research Report 198 presents a framework for developing relationships between service quality and asset conditions, using a variety of transit system performance and customer satisfaction attributes. The research conducted in developing the report found many correlations between asset condition and performance, as noted below (Spy Pond Partners, et.al, 2018).
- Asset condition is related to the quality attributes of Frequency, Reliability, and Travel Speeds. As assets decline in condition, failures become more likely, reducing frequency, reliability, and average speeds.
- Asset condition is related to Appearance/Aesthetics in that customer perceptions of this factor are likely to be worse when assets are in poor condition and/or are technically obsolescent.
- Asset condition is related to other service quality attributes, including Comfort, Ease of Access, Environmental Impact, Information, Safety, and Security. For these attributes, increasing asset failures may affect quality, although the effects may be difficult to model. For instance, reduced service frequency resulting from increased failures can lead to greater crowding and less comfort. A particularly challenging area is safety. Given that operating severely deteriorated assets could compromise safety, in theory and in general practice, transit agencies establish thresholds for safe operations and remove an asset from service, rather than operating unsafely. Thus, potential safety issues tend to become operational issues, rather than actual safety issues. Regardless, customer perceptions are likely to be worse when assets are in poor condition for these factors, as in the case of Appearance/Aesthetics.
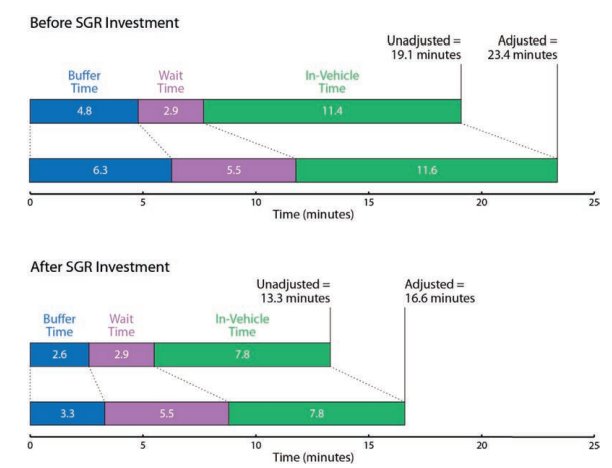
In one example, the impact of State of Good Repair (SGR) investment on the calculation of Effective Journey Time (EJT) is demonstrated. The example illustrates the differences in the calculated unadjusted and adjusted journey time, both before and after SGR investment, for a hypothetical rail line. Although the calculation is not based on actual data, it is intended to show that, after a SGR investment, both the adjusted and unadjusted journey times decrease. Before investment, the actual journey time for all components is 19.1 minutes, increasing to 23.4 minutes when adjustment factors are included. Following an investment in improved vehicles and track, these journey times decrease to 13.3 and 16.6 minutes. Looking closer at the components of time that change in this example, the decrease in buffer time after SGR investment indicates that travel times are more reliable and passengers do not have to build in as much buffer when planning their trips. Overall, in this example, SGR investments reduce EJT an average of 6.8 minutes per trip. This savings can be multiplied by an average value of time and number of trips per year to yield a prediction of the annual user benefit resulting from the investment. The results can be used in a variety of ways to analyze asset conditions and service quality.
Figure 2.5-B Comparing Adjusted and Unadjusted SGR Investment
Minnesota DOT
The Minnesota DOT’s performance management system consists of clear policies, performance trend data and performance forecasts to guide investments and operational decisions. The system is designed to (http://www.dot.state.mn.us/measures/):
- Address stakeholders’ desire for accountability and transparency
- Provide more informed decision-making and solutions to increasing challenges
- Enhance customer-responsiveness
- Ensure compliance with legislators' mandates
- Improve internal management
- Facilitate refinement of programs and services
- Set benchmarks for comparison of results
MnDOT uses performance criteria to guide capital investments and annual operational budgets. Transportation system and agency performance reports are regularly reviewed by MnDOT management. The ongoing measurement and review process assists MnDOT in evaluating the efficiency of service delivery and assessing the effectiveness of program activities. This objective-based approach increases transparency, and encourages innovation by keeping the focus on outcomes.
The accountability and transparency provided by MnDOT’s performance management system has contributed to MnDOT’s reputation among elected officials as a trusted partner in addressing challenging issues.
Accountability and transparency are a foundation of success for public agencies. The benefit is increased trust. This can help elected officials view MnDOT as a trusted partner and work together on challenging issues. Confidence in agency decision-processes and results is important to legislators considering new investments.