Section 5.1
Resource Allocation and Prioritization Process
Resource allocation is an interconnected process of decisions about how to allocate funds to different assets, often driven by legal requirements or a desire for better accountability. DOTs face a variety of constraints when trying to manage their assets, which makes it especially important to apply rigorous, data-driven methods when making long-term choices.
5.1.1
What is Resource Allocation?
In the context of TAM, resource allocation is the process of assigning scarce resources to investments in transportation assets. The assigned resources can be money, staff time, contractor capacity, equipment, or anything else that an organization requires for its assets. The investments can be capital projects, maintenance efforts, or other projects and activities that require the use of an organization’s resources through various delivery methods.
To the extent an organization is focused on preserving its existing transportation assets, ideally it will make investments consistent with the life cycle management approach for its assets as described in Chapter 4. However, organizations often lack the funding, staff, or other resources needed to achieve all of their goals and objectives, and must make hard decisions about how to divide resources while considering competing needs. If resources for existing assets are systematically constrained such that the life cycle management approach is simply not achievable, the resource allocation process may need to revise life cycle strategies or the overall life cycle management approach.
The approaches used for resource allocation vary. For instance, in considering how to allocate capital funding over multiple years, an organization may need to either prioritize projects or establish an overall budget for certain types of investment, depending on the specific context. In day-to-day allocation of operations and maintenance resources, the challenge is more tactical, as a manager assesses what staff, materials and equipment are immediately available, considers both internal forces and contract capacity, and puts these to the best possible use considering current conditions and challenges.
The output of the resource allocation process could be a specific assignment of resources or a plan for what capital projects to fund. In addition, the results of the resource allocation process may impact other plans and decisions related to TAM. To the extent the process involves allocating money, a financial plan may serve both as an input to the process (by specifying what funds are available) and an output of the process that details how funds will be spent. TAM financial planning is discussed further in Section 5.3.
Once an initial set of resource allocation decisions has been made, an organization may need to reconsider the best delivery option for planned work. Issues related to work planning and delivery are discussed further in Section 5.4.
All organizations practice resource allocation in some manner, whether formally or informally. By using a structured and repeatable approach for resource allocation, an organization improves its own resilience and ensures that it will continue to succeed even as new challenges arise and personnel changes over time. This chapter outlines an idealized approach to resource allocation an organization can use to help assess how it allocates resources, and how best to improve its process.
It also describes various processes closely related to resource allocation, such as risk management, financial planning and work planning and delivery.
5.1.2
Transportation Agency Context
For U.S. transportation agencies, the resource allocation process is influenced by the set of legislative and regulatory requirements related to transportation planning and programming.
Since the early 1970s, U.S. Metropolitan Planning Organizations (MPOs) and state Departments of Transportation (DOTs) have been required to develop long-range transportation plans (LRTPs). These plans establish the goals and objectives of an agency and detail its high-level investment plan (not necessarily listing specific projects) over a period of at least 20 years.
Requirements initiated by MAP-21 further specify that an LRTP should be performance-based, detailing forecasted performance using a set of federally specified performance measures, and additional “locally significant performance measures” if desired. These measures include summaries of good/fair/ poor condition for National Highway System (NHS) pavements and bridges. MPOs include performance measures and targets in their LRTPs. State DOTs have additional requirements to report shorter-term performance targets in different areas, including two- and four- year targets for NHS pavement and bridge condition.
In addition to developing LRTPs, MPOs and state DOTs are required to develop investment plans: each MPO develops a Transportation Improvement Program (TIP), while each state DOT develops a Statewide TIP (STIP). A TIP or STIP is a four-year (or more), fiscally constrained program of projects, including those that use federal funds (with some exceptions), additional “regionally significant” projects, and other projects the agency wishes to include. Because TIPs and STIPs are fiscally constrained, an agency must project its available revenue for the investments (typically capital) covered by the program over a period of at least four years, and many agencies have developed revenue projection models extending further into the future to support longer-range planning.
Beginning in 2018, again as a result of MAP-21, state DOTs are required to prepare TAMPs addressing pavements and bridges on the NHS at a minimum, while potentially including other asset classes and road systems. An agency’s TAMP describes the asset inventory and its conditions, how assets are managed over their life cycles, and a 10-year financial plan for how to best maintain assets in a “desired state of good repair.”
The various plans and programs cover different time periods and are intended to comply with different requirements. However, all of them may impact the resource allocation process, particularly with respect to allocation of funding for capital projects.
TIP
Information gathered and data analyzed in the TAM process should inform resource allocation decisions that agencies document primarily in their LRTPs, TIPs, or STIPs. This is where integration and collaboration with planning and programming groups within the agency is essential.
While these requirements are specific to the U.S., other countries have established their own planning and programming requirements, resulting in different—though frequently analogous—impacts to their resource allocation processes. Lessons learned from asset management experience in the U.S. and abroad include:
- In some cases organizations have implemented asset management programs and prepared asset management plans in response to legal requirements, while in others efforts to implement asset management concepts have been motivated by a desire to improve decision-making. While it is difficult to generalize, it appears that jurisdictions that adopt asset management planning by choice tend to realize the benefits much more quickly, improve service delivery, and allocate resources more effectively.
- Alignment of resource allocation to achieve goals and objectives is very important to ensure an agency advances from a traditional maintenance management approach, in which targets for asset conditions result from the available budget, to a performance-based approach in which an organization’s goals and objectives help define the required level of service (LOS) for its assets, which in turn drives resource allocation decisions.
- Organizational goals ideally should not focus on assets, or their condition, but the outcomes that are desired, such as improved mobility, safety and infrastructure resilience. Changing technology (CAV, communications), social (graying populations, work from home patterns, ridesharing), economic (integrated transportation modes), may be very relevant to how resource allocation should be conducted. Agencies that make resource allocations based largely on the condition and life cycle strategies of only the existing portfolio, may face greater challenges achieving their goals, and adapting to the changing needs of their economies
- International, and US DOT agencies that have focused resource allocation on their goals and objectives, rather than on the existing assets they are responsible for, tend to be more readily able to leverage alternative service delivery models that may present service enhancement or cost saving opportunities. These agencies agree that “We don’t need to build it or own it or maintain it, to deliver mobility.”
Washington State DOT
Washington State DOT has worked closely with its legislature to adopt asset management based resource allocation policies.
The following is an excerpt from state legislation that was last updated in 2002:
”deficiencies on the state highway system shall be based on a policy of priority programming having as it’s basis the rational selection of projects and services according to factual need and an evaluation of life cycle costs...”
– RCW 47.05.010
This legislation along with good business practices has made Washington State DOT have one of the most mature asset management practices and an integrated set of tools, business processes, and organizational culture to support good asset management.
5.1.3
Prototypical Resource Allocation Process
The basic resource allocation approach includes seven basic steps. Specific approaches to resource allocation differ depending on where resources are being allocated and the organizational context.
This section describes a basic resource allocation process. The resource allocation process can be used to answer three key questions:
- What resources are required and how should they be distributed over time to best meet the long-term goals and objectives?
- What performance targets are achievable given available resources?
- How should resources be used in the short term to best support the goals and objectives?
The details of the process differ depending on what resources are being allocated to what investments, the timeframe and the particular circumstances faced by the organization.
A generic process is presented here as a framework for assessing the different allocation processes used by different organizations, as well as to help structure the discussion of issues related to resource allocation presented in subsequent sections of this chapter. The process is iterative; it is frequently necessary to walk through the process in order to establish a proposed allocation, review the proposed solution, and then revisit the assumptions made earlier, altogether resulting in a revised outcome.
TIP
Almost all agencies already have structured resource allocation processes; introducing TAM or improving TAM practice should begin with assessing existing processes to identify areas where asset-related data and TAM process analysis outputs (e.g. life cycle planning outputs) can be incorporated.
In applying the prototypical process, it is important to consider that organizations typically have different resource allocation processes for allocating different resources over different time periods. The basic steps in the process are the same regardless of the specific context, but the details of how each step is performed may vary.
For example, in considering how to allocate resources over a period of 10 years or more, an organization might consider what funding is needed and how best to allocate funds across multiple investment categories while setting aside decisions about specific projects. In this case, the key resource being allocated is money, and the emphasis of the process will be on Step 1 – Establish Goals and Objectives and 3 – Quantify Targets. Further, in this case there may be less emphasis on Step 2 – Determine Constraints, and the prioritization performed in Step 5 may yield identification of high-level priorities rather than a prioritization of specific projects.
On the other hand, when considering how best to use staff resources and materials to perform maintenance work in the short term (less than one year), the organization would apply the process differently. In this case, the resources being allocated would include time and materials. The emphasis on the process will be on Step 2 – Determine Constraints, Step 5 – Prioritize Investments, and Step 7 – Finalize Allocation and Plans. In this case the specific allocation may not have a significant impact on the goals and objectives established in Step 1, and the prediction of future performance in Step 6 is less relevant than in the case of a longer-term allocation.
The practice examples in this section show how agencies have implemented this basic process to address different resource allocation challenges.
TIP
Although a generic framework for resource allocation is presented, agency context and other factors (e.g. legal requirements) will create the need for agencies to allocate resources in different ways.
Michigan DOT
Michigan DOT recently introduced principles of performance-based contracting to their routine highway maintenance delivery. The focus of this initiative was on developing a better understanding of performance, providing more consistency of service, encouraging innovation adoption and identifying efficiency opportunities.
To achieve this MDOT developed performance measures for 23 non-winter maintenance activities. They then examined how these activities contributed to the objectives and community outcomes MDOT wanted to achieve (e.g. safety, reliability, economic benefit, and quality of life) and used that analysis to select six initial key measures for which targets were set to focus the effort. The performance monitoring system helped one MDOT region identify unsealed shoulders (ensuring they are even and traversable) as an area requiring improvement. They invested in additional shoulder maintenance in 2015 and from this realized a performance increase of more than 30%.
MDOT is using this performance monitoring approach to better understand the cost of improving its maintenance level of service. The agency is also identifying specific resources to focus in areas where it can achieve a more consistent and safer outcome.
Southland District Council (New Zealand)
Southland District Council (SDC) manages one of the largest road networks in New Zealand. Dairy farming is critical to the economy of the local area and more broadly to the Country (SDC generates 10% of New Zealand’s dairy exports). In the period 2000-2010 there had been significant expansion of the dairy farming industry and further expansion was likely. Maintenance and renewal costs were estimated to increase significantly and SDC’s road rates were already among the highest in the country. SDC recognized that a new approach was necessary and they could not keep doing things the same way.
SDC developed the Economic Network Plan as an asset management approach that allowed SDC to determine where investment in the network would provide the greatest financial return to the community. The Economic Network Plan considered the following services provided by the network:
- Safety
- Road Condition (Levels of Service)
- Enable Exports
- Service Delivery
- Customer Quality
Consideration of the resources required to maintain the network led SDC to the decision that its highest volume roads would be maintained to its then-current LOS standard. These roads represented 20% of the road network but carried nearly 70% of the traffic. The remaining 80% of the network would have a reduction in standard over time. The Economic Network Plan provided the basis for this change.
Like many agencies, the SDC was forced to take a different approach when financial constraints required change. It enabled all parties to focus on:
- Shifting from ‘Engineering’ to ‘Customer Service Network Management’ (why the service is provided)
- Managing customer expectations proactively rather than reacting to them
- Making safety a priority
- Investing in technology and information to understand, manage and integrate with HCV operators
Source: https://www.nzta.govt.nz/assets/Road-Efficiency-Group-2/docs/southlandnetworkplan.pdf
Note: For more information on this example, see the case study on the SDC’s experience in the International Infrastructure Management Manual (IIMM).
South Dakota DOT
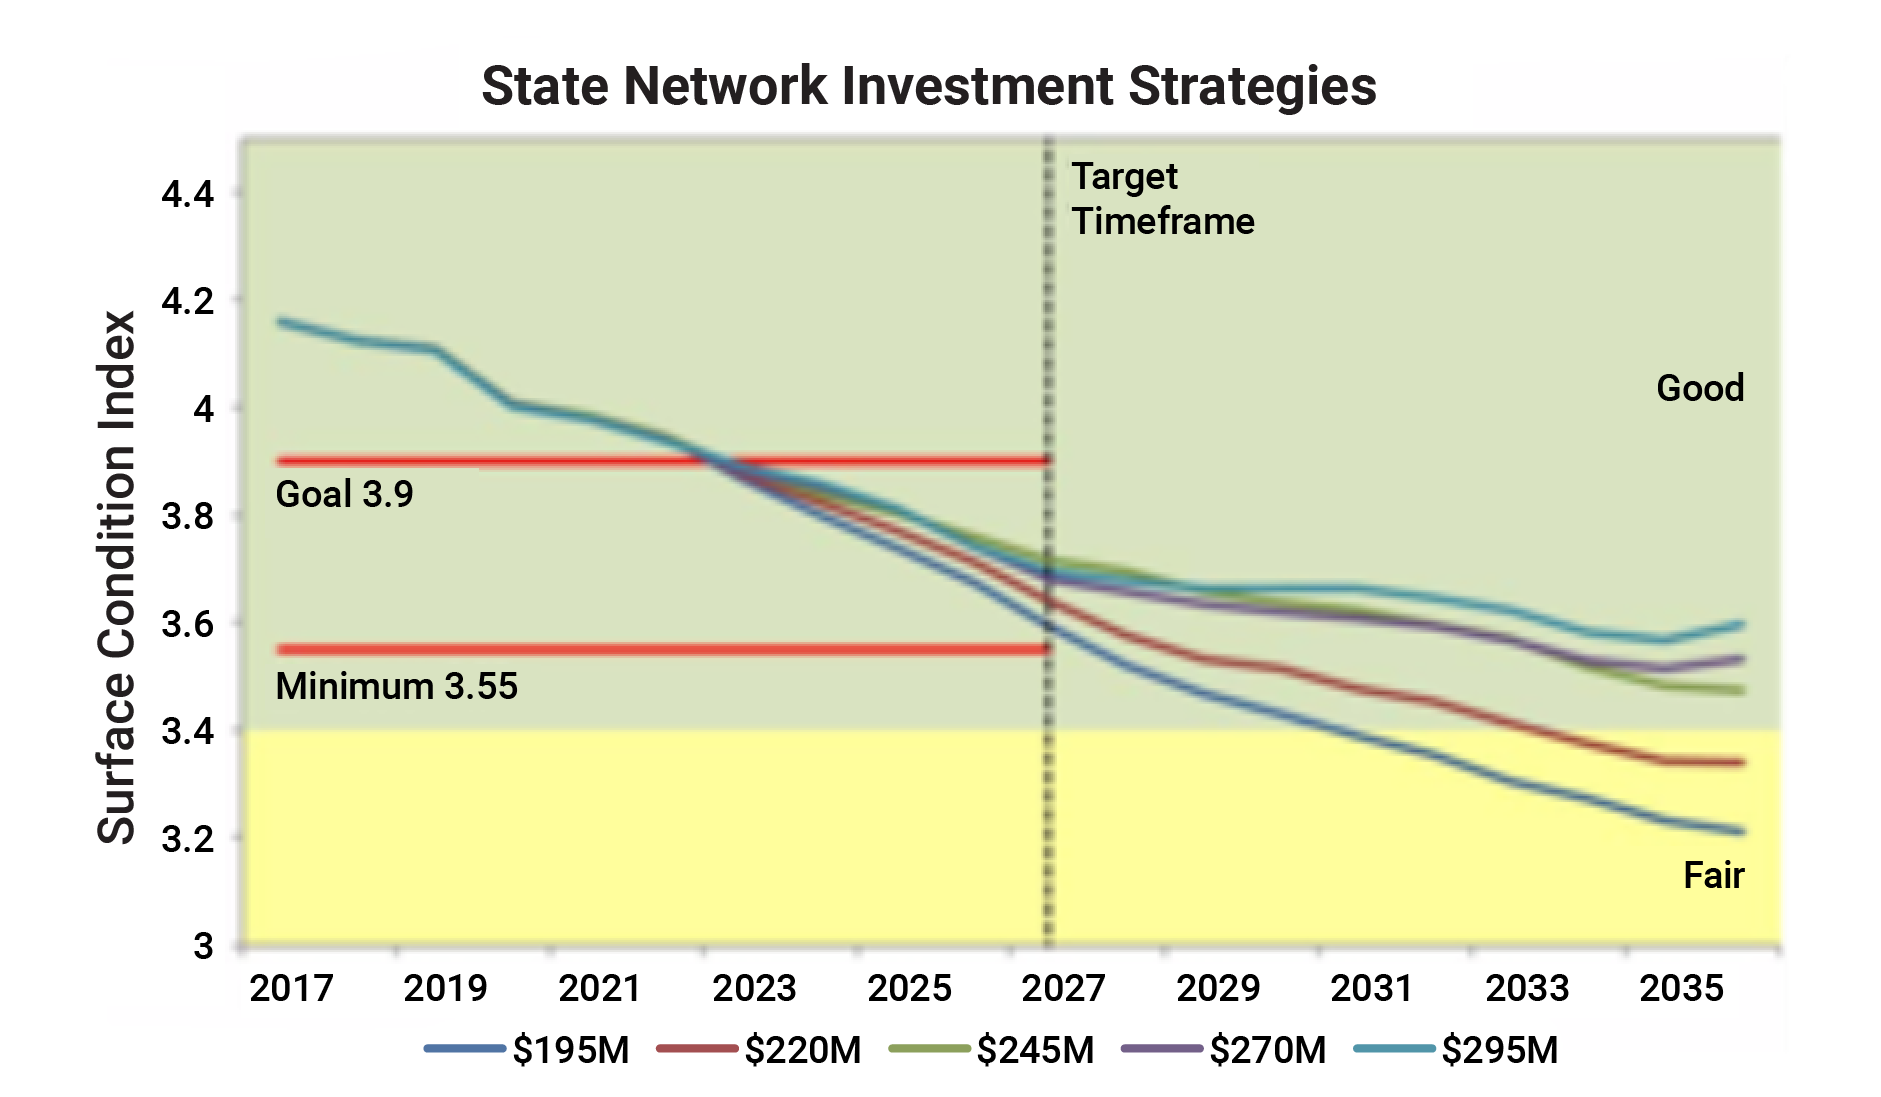
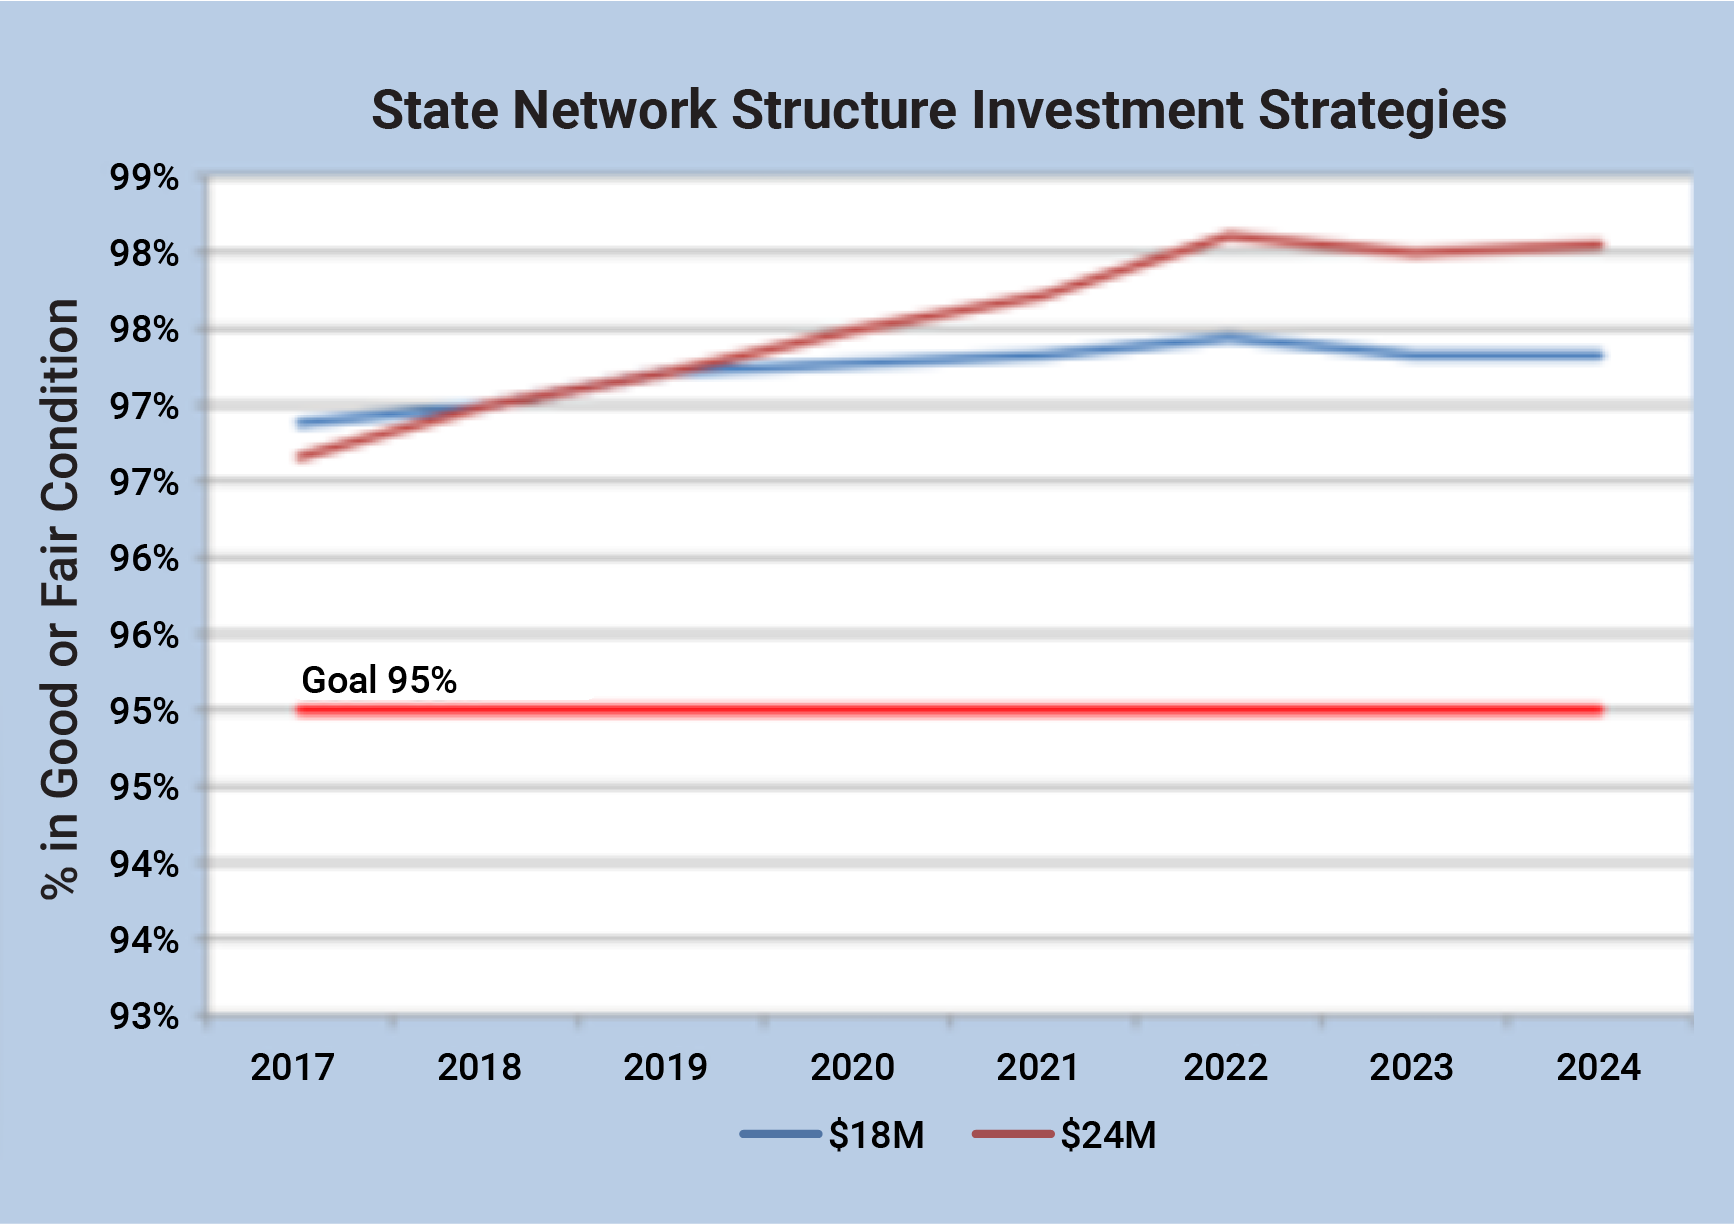
SDDOT’s agency mission is “to efficiently provide a safe and effective public transportation system.” To support this high-level goal the agency sets ten-year objectives for its pavements and bridges, as well as a minimum acceptable condition for pavements. For pavements SDDOT summarizes conditions using Surface Condition Index (SCI), a composite measure represented on a scale from 0 (worst condition) to 5 (best conditions) that incorporates measures of roughness, rutting, faulting and distress indices. For bridges, SDDOT summarizes conditions based on the percentage of structures in good or fair condition, using the FHWA good/fair/poor measure for classifying the condition of a bridge.
To determine how to allocate capital funds for state-owned pavements and bridges SDDOT relies heavily on its pavement and bridge management systems. The agency predicts conditions for a 10-year period for a range of different budget levels, and then compares the predicted performance to the agency’s goals and objectives. The figures, reproduced from SDDOT’s 2018 TAMP, show results in terms of predicted SCI over time for five budget scenarios generated using SDDOT’s Pavement Management System (PMS), and results in terms of percent of bridges in good or fair condition for two budget scenarios generated using the agency’s Bridge Management System (BMS).
Given the projections as well as additional projections of pavement condition for six functional systems, the agency uses its Trade-Off Tool to evaluate the impact of different funding scenarios and recommends the funding distribution that will produce the greatest benefit. The final result of the analysis is a distribution of funding between asset type and functional system, as well as the distribution of funds between four types of work:
- Construction and Reconstruction
- Resurfacing and Asphalt Surface Treatment
- Rehabilitation and
- Safety
Decisions about what capital projects to perform are then made given the funding level established in the trade-off analysis.
Source: SDDOT Transportation Asset Management Plan. 2018.http://www.sddot.com/resources/reports/SDDOT2018TAMPFHWASubmittal.pdf
State Network Investment Strategies
State Network Structure Investment Strategies
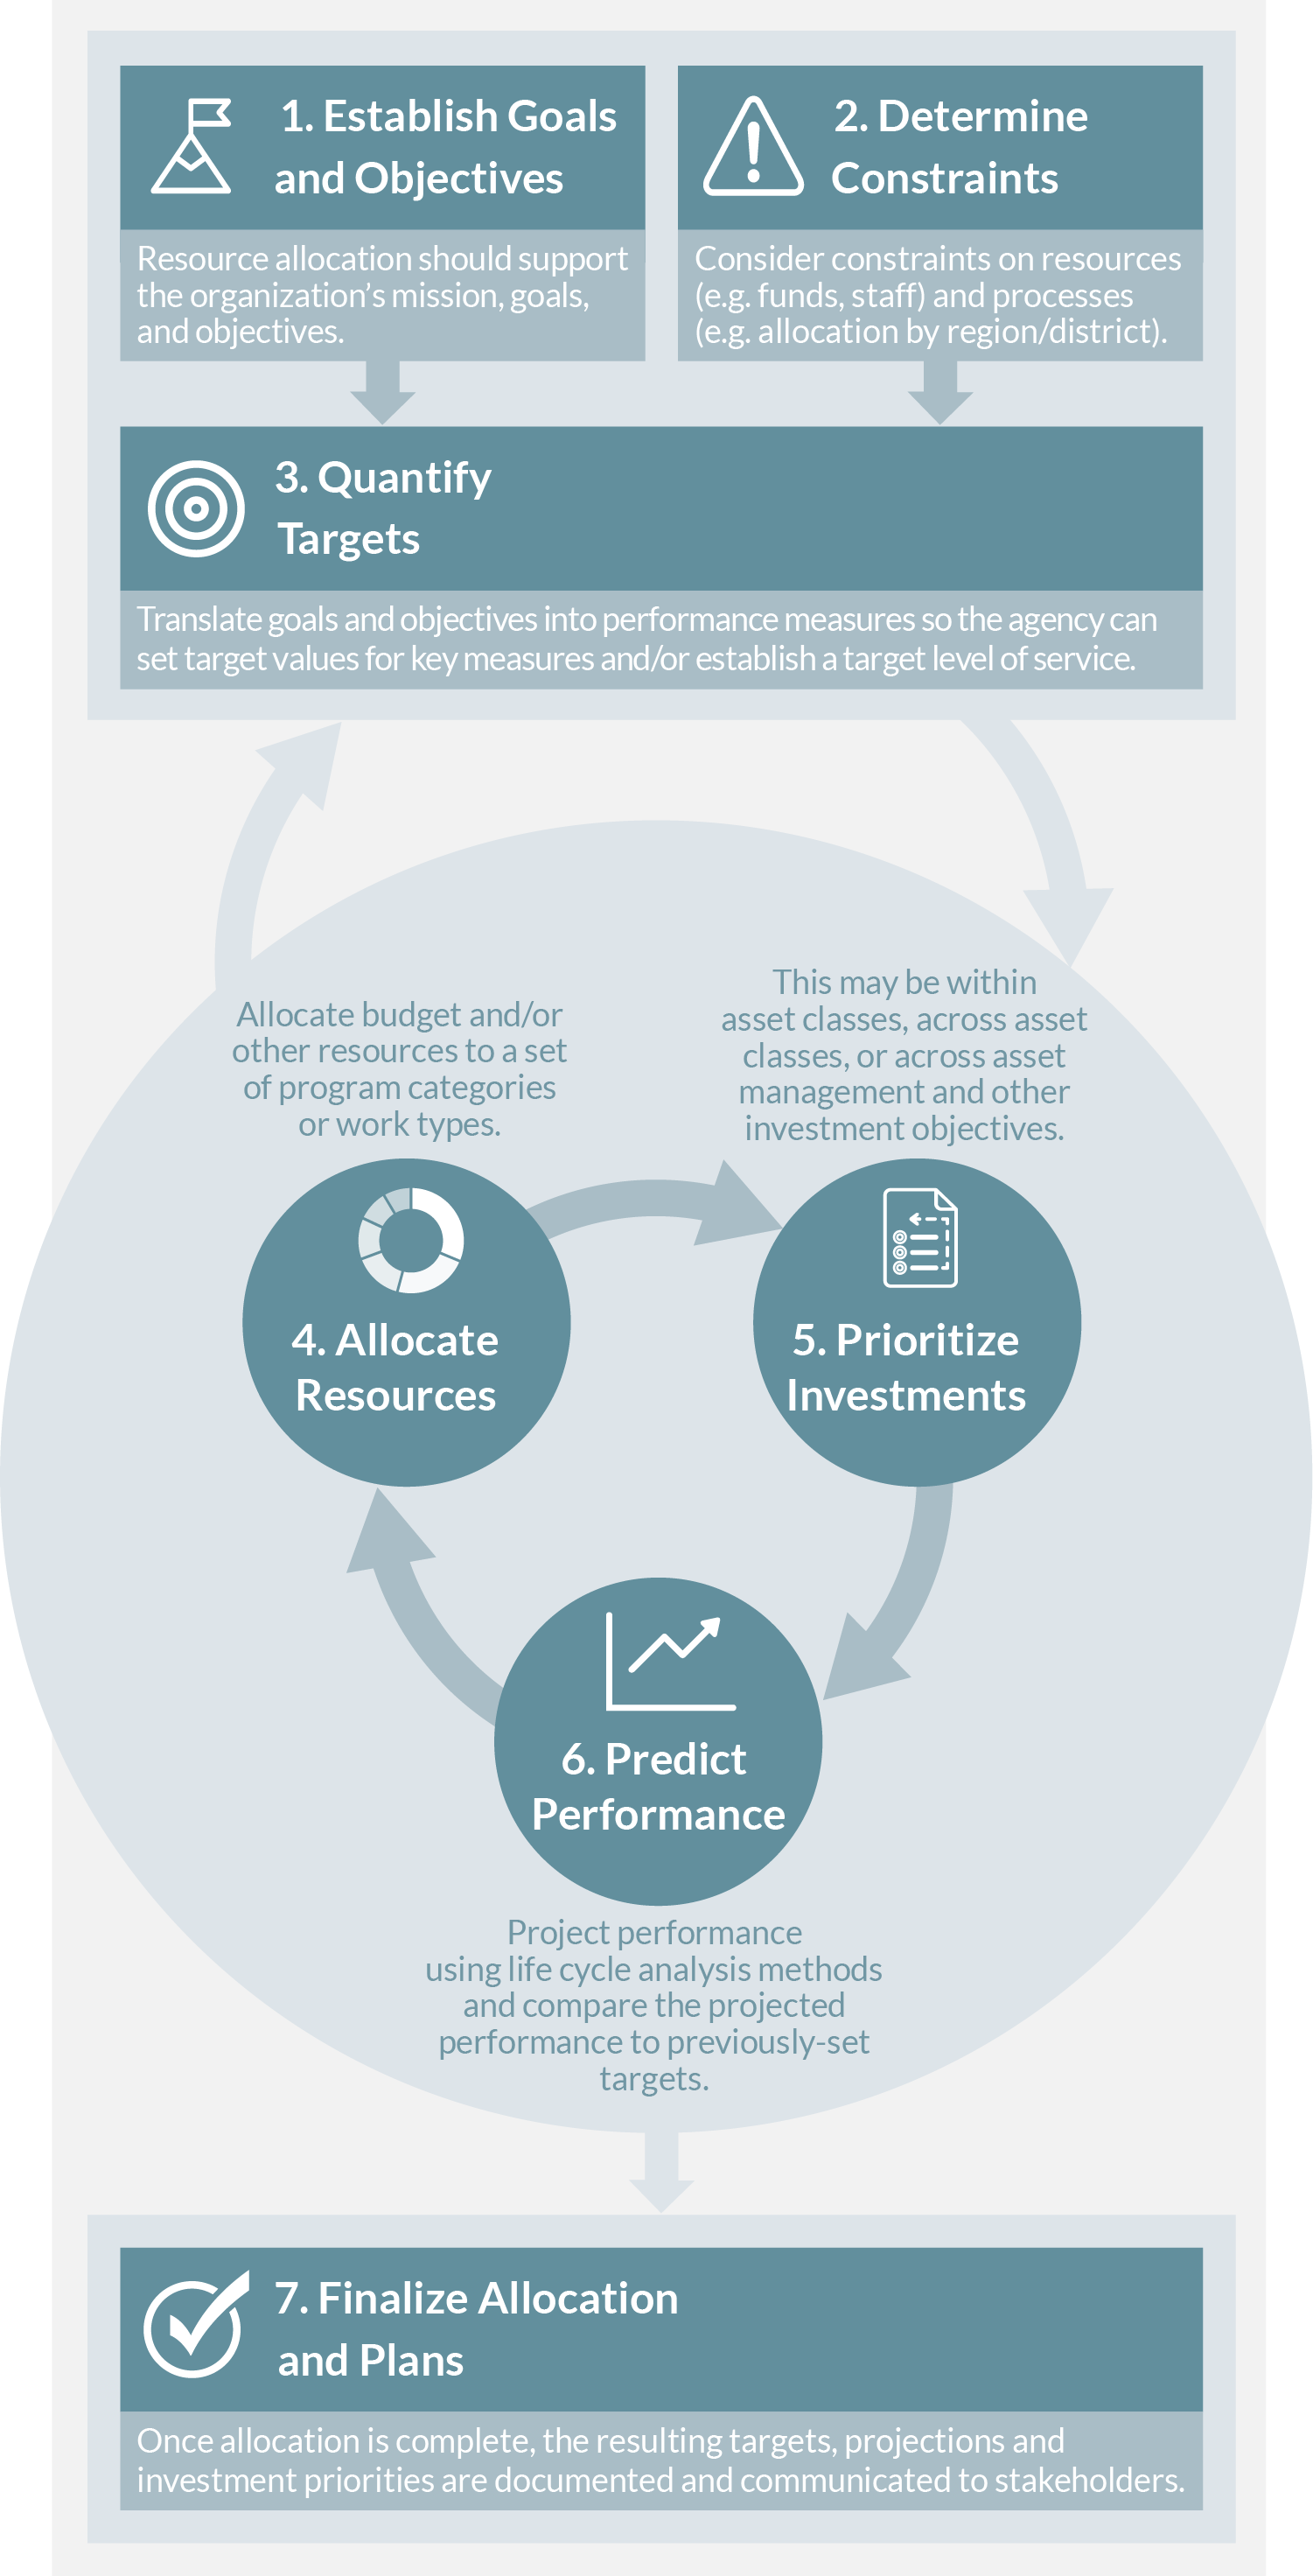
There are Seven Basic Steps in the Resource Allocation Process
- Establish Goals and Objectives. The mission, vision and broad agency goals are meant to guide decision-making across an organization. Goals and objectives may be articulated in an organization’s LRTP and/or TAMP. Ideally, the resource allocation process should support achieving these.
- Determine Constraints. Establish what resources must be allocated, and what the constraints on them are. Typically this will include constraints on available funds, but may include constraints on staff, contractor capacity, equipment, materials, or other resources. Further, there may be other constraints relevant to the process, such as constraints to distribute funds equitably between different regions or areas, or constraints on exactly how certain resources can be used.
- Quantify Targets. Translate goals and objectives into specific criteria for supporting allocation decisions. Where feasible, define performance measures that quantify the level of achievement. Set target values for key measures and establish a target level of service as discussed in Section 5.4.
- Allocate Resources. Split the budget and other resources to the set of program categories or types of work. The allocation specifies the distribution of resources between different categories or work types. The details of how this step is performed are dependent on the details of the resources being allocated, assets being analyzed, and types of investments under consideration.
- Prioritize Investments. Determine what specific investments to make given the overall allocation of resources. This determination may be made within an asset class, across asset classes or across asset management and other investment objectives (e.g. safety or mobility) depending on how the process is structured. The prioritization should maximize achievement of the organization’s goals and objectives as quantified using the measures and targets set in Step 3 subject to the constraints established in Step 4.
- Project Performance. Predict future performance given the assumed allocation and priorities, and compare the predicted performance to previously established targets. This may result in revisions to the constraints, targets or outcomes of other steps described above. To the extent that the targets are set for asset conditions, use the life cycle analysis methods described in Chapter 4 to predict future asset condition.
- Finalize Allocation and Plans. Once allocation is complete, document the resulting targets, projections and investment priorities and communicate these to stakeholders. Further work may be required following completion of the formal process, such as developing maintenance plans based on the set of approved projects.
Figure 5.1 The Resource Allocation Process
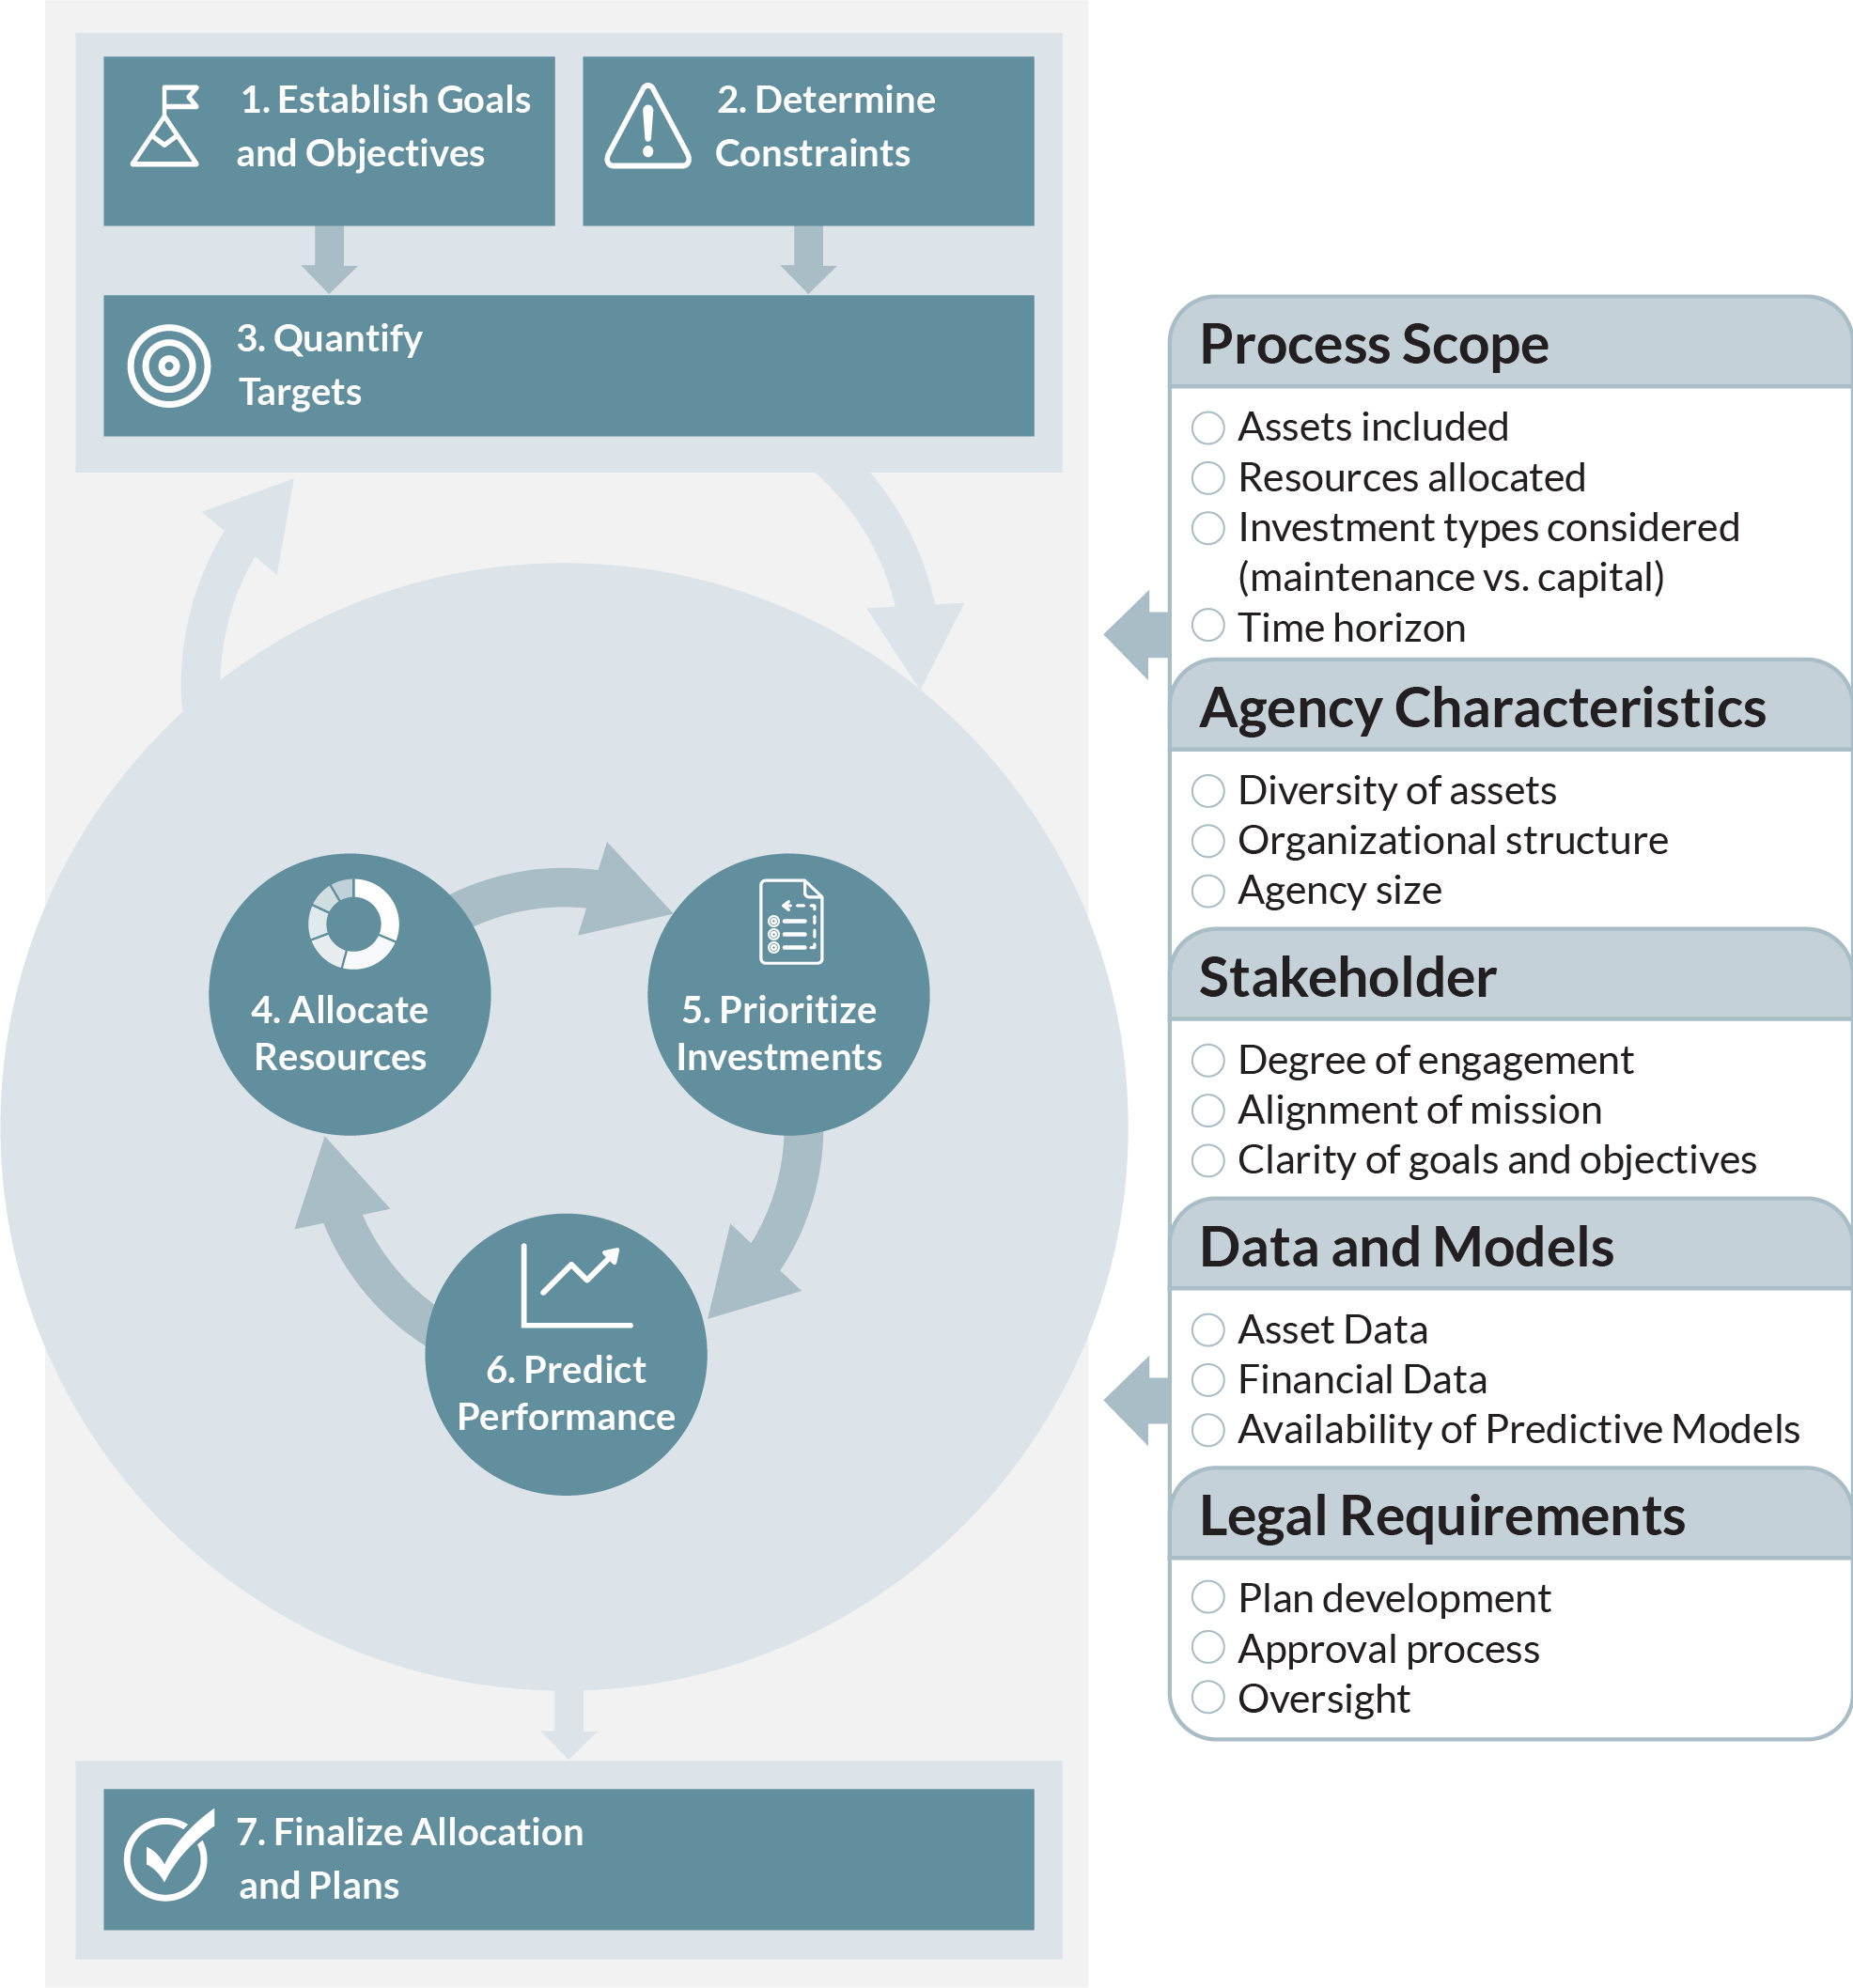
Factors Impacting the Resource Allocation Process
The specifics of how an organization can and should approach resource allocation depend upon a number of different factors. Understanding these factors is key in developing a successful approach to resource allocation.
Figure 5.2 Factors Impacting the Resource Allocation Process
5.1.4
Consideration of Risk in Resource Allocation
Uncertainty and risk complicate the resource allocation decision-making process. Risk management activities, including developing a risk register, are helpful in understanding and mitigating uncertainty, which in turn has implications for resource allocation.
Overview
All transportation decision-makers must contend with uncertainty. In regards to resource allocation, uncertainty is inherent in variables such as data on asset conditions and performance, future funding levels and costs, how a transportation system and specific assets will perform, and what external events or other factors may require reallocating resources. This uncertainty complicates efforts to make decisions about the future and forces agencies to be nimble so as to effectively respond to unpredictable events and evolving conditions.
In recent years, transportation and other industries have made significant progress developing improved approaches for managing uncertainty to minimize negative and leverage positive impacts. An area of focus in transportation has been in managing the risk of project cost and schedule overruns; a number of agencies have established enterprise risk management programs in order to address risk and uncertainty across their organizations. Likewise in TAM, there is increased interest in identifying and assessing risk so as to comply with both the best practices and the FHWA requirement for state DOTs to consider risk in developing their NHS TAMP.
The word ‘risk’ can be very context specific, meaning very different things depending on the industry and application. For instance, a financial analyst is primarily concerned with uncertainty in financial returns and the risk of incurring a significant financial loss. In the nuclear power industry, however, the focus of managing risk is on minimizing the potential for catastrophic loss that might occur from damage to a nuclear facility. As discussed in Chapter 2, in this guide risk is defined as the “effect of uncertainty on objectives” consistent with the ISO definition. This definition captures the full range of applications of risk management, and acknowledges the possibility for both positive and negative consequences of uncertainty.
The term ‘risk management’ is used to capture the set of business processes associated with identifying and managing uncertainty and risk. The overall risk management process is described in Chapter 2. The remainder of this section describes how this process relates to resource allocation.
Implications for Resource Allocation
While the scope of risk management may be very broad, an organization’s approach to risk management and the outcomes resulting from a risk assessment may nonetheless have important implications for TAM resource allocation. Consequently, it is important to establish a risk management approach and integrate consideration of risk with the resource allocation process.
TIP
Multi-objective decision making is a concept in operations research that is implemented in several different forms, from simple consensus-building approaches (e.g. Delphi processes) to more complex software tools. In all cases, it allows consideration of more than one factor or criteria in making a decision.
Specific possible implications of risk management on resource allocation may include, but are not limited to:
- An organization may identify through its risk management approach areas where better data or improved processes are needed to best address a given risk, in turn impacting the resource allocation process. For instance, if uncertainty concerning future asset conditions is found to be a significant risk, this may result in efforts to improve the deterioration models in an agency’s asset management systems and/or motivate data collection improvements to reduce uncertainty.
- An organization may identify specific investments of staff time and/or agency funds required to mitigate negative or leverage positive risk. Once specific investments are identified, they can be assessed along with investments in other asset/investment categories. For example, Caltrans defined a separate program for seismic retrofits as described in the Practice Example.
- If an agency’s allocation of resources hinges on uncertain future values for one or more parameters, it may be necessary to incorporate consideration of uncertainty formally in the decision-making process. This can be accomplished using Monte Carlo simulation or other quantitative approaches to establish the predicted distribution of outcomes. For instance, in performing a life cycle cost analysis to select between project alternatives for a given facility, Monte Carlo simulation can calculate the range of life cycle costs predicted depending on future values for cost escalation, deterioration, or other parameters.
- In approaching formal accounting for uncertainty, an organization may define different scenarios representing the possible range of outcomes and then determine how best to allocate resources in each scenario before establishing a preferred resource allocation approach. For example, if an agency’s future capital budget is unknown, a decision-maker may wish to define a high, medium and low budget scenario and determine what investments would be made in each scenario in order to most effectively prioritize given uncertainty. Likewise, a scenario analysis approach can be useful in assessing how to allocate resources for improving infrastructure resilience given uncertainty concerning future sea level rise. Typically, the decision maker will review results for different scenarios and make a subjective determination of how to allocate resources considering the relevant factors. The Practice Example describing the analysis of harbor-wide barrier systems for the City of Boston shows one such approach. Recent research in the area of Robust Decision Making (RDM) has focused on developing quantitative approaches to select optimal investments between different scenarios.
Caltrans
Caltrans initiated its Seismic Safety Retrofit Program in the wake of bridge failures experienced in the 1989 Loma Prieta Earthquake. Through this program Caltrans evaluated the retrofit needs for all of the over 12,400 bridges on the State Highway System (SHS). Retrofit needs were prioritized using a multi-attribute procedure that calculated a score for each bridge considering the likelihood of an earthquake at the bridge site, the vulnerability of the bridge to collapse in the event of an earthquake, and the impact of a collapse considering the traffic using the bridge and detour distance in the event of a collapse. Through 2014 the program resulted in retrofit of 2,202 state highway bridges at a cost of over $12.2 billion.
Sources:
2018 Caltrans TAMP
Practical Lessons from the Loma Prieta Earthquake (1994), p. 174-180 https://www.nap.edu/catalog/2269/ practical-lessons-from-the-loma-prieta-earthquake
University of Massachusetts
The Sustainable Solutions Lab at the University of Massachusetts Boston used a scenario-based approach to analyze the feasibility and potential risk reduction of Boston Harbor barrier systems to protect the Boston area from future flooding due to sea level rise. The report included an economic analysis in which costs and benefits were predicted for 32 scenarios considering:
- Two barrier system alternatives
- Two construction time scenarios
- Two scenarios for effectiveness of “shore-based solutions”
- Low and high construction cost estimates
- Discount rates of 3% and 7%
The analysis indicated that the benefits of the proposed barrier system would exceed their cost for both systems evaluated, but only in the case that one assumed a low discount rate, accelerated construction schedule, and failure of other shore-based solutions for mitigating sea level rise. Also, the analysis indicated that beyond a certain point sea level rise would be such that a barrier system would no longer prove effective (since the barrier would have to be closed at all times rather than only during flood events). The report further predicted costs and benefits for two alternative scenarios involving incremental adoption of a variety of shore-based mitigation approaches, and recommended an initial focus on shore-based adaption as the most promising strategy for the City of Boston to address sea level rise.
Regional Municipality of Peel (Canada)
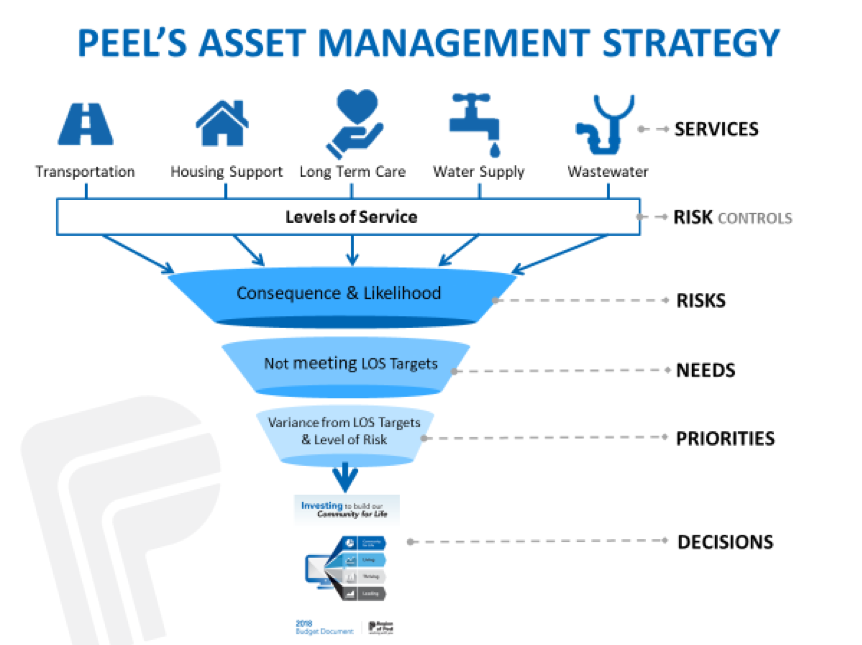
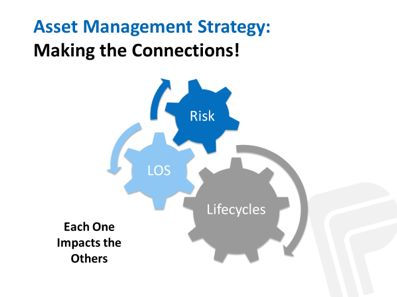
The Region of Peel is the second largest municipality in Ontario, just west of Toronto and supports two cities and a town. Peel assesses needs and priorities across a diverse portfolio of Infrastructure that supports a variety of programs and services including an arterial roads network, solid waste management, water and wastewater treatment distribution and a variety of social, health and emergency services. The Region integrated a number of inputs to enable an optimized investment methodology including a Risk Management, Level of Service, and Life cycle Management Strategies and priortize needs across diverse infrastructure, as illustrated in the figure. The integration of these three strategies was possible through three enablers and working with all of the programs and services to model their infrastructure:
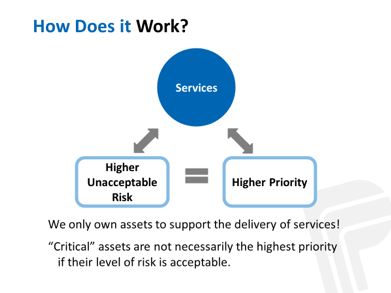
- Establishing a consistent approach to quantifying risk – The Region evaluates the degree of risk that is currently being accepted associated with delivering service levels. Inherent risk (similar to asset criticality) and residual risk (the Region’s risk objective) are established and the current level of risk that an asset presents to service delivery is also determined. The gap between current and residual risk represents the unmet funding and asset needs.
- Establishing a normalized method to determine current level of service to assist the cross-asset funding allocation task. The adopted normalized indicator was determined to be: LOS=% of Assets Meeting LOS + (% of Assets Not meeting LOS x Average Condition of Assets not meeting).
- Adopting a direct relationship between LOS and risk that allows for an analysis of alternative investment scenarios, and modeling techniques to optimize investment allocation. It also allows annual infrastructure evaluation based on the most current condition information and annual Asset Management Reporting.
Peel’s risk-based approach to asset management is integrated with the Region’s Strategic Plan and the Long-Term Financial Planning Strategy, and supports the desired service outcomes by evaluating risk against the Council approved asset levels of service. This approach provides senior decision-makers an objective way to consider resource allocation alternatives and communicate in a common language when evaluating between service areas and different asset portfolios.
Peel Enterprise Asset Management Plan. 2019. http://www.peelregion.ca/council/agendas/2016/2016-04-07-arc-agenda.pdf. http://www.peelregion.ca/finance/_media/2019-enterprise-asset-management-plan.pdf
Washington State DOT
Washington State DOT has worked closely with its legislature to adopt asset management based resource allocation policies.
The following is an excerpt from state legislation that was last updated in 2002:
”deficiencies on the state highway system shall be based on a policy of priority programming having as it’s basis the rational selection of projects and services according to factual need and an evaluation of life cycle costs...”
– RCW 47.05.010
This legislation along with good business practices has made Washington State DOT have one of the most mature asset management practices and an integrated set of tools, business processes, and organizational culture to support good asset management.
Michigan DOT
Michigan DOT recently introduced principles of performance-based contracting to their routine highway maintenance delivery. The focus of this initiative was on developing a better understanding of performance, providing more consistency of service, encouraging innovation adoption and identifying efficiency opportunities.
To achieve this MDOT developed performance measures for 23 non-winter maintenance activities. They then examined how these activities contributed to the objectives and community outcomes MDOT wanted to achieve (e.g. safety, reliability, economic benefit, and quality of life) and used that analysis to select six initial key measures for which targets were set to focus the effort. The performance monitoring system helped one MDOT region identify unsealed shoulders (ensuring they are even and traversable) as an area requiring improvement. They invested in additional shoulder maintenance in 2015 and from this realized a performance increase of more than 30%.
MDOT is using this performance monitoring approach to better understand the cost of improving its maintenance level of service. The agency is also identifying specific resources to focus in areas where it can achieve a more consistent and safer outcome.
Southland District Council (New Zealand)
Southland District Council (SDC) manages one of the largest road networks in New Zealand. Dairy farming is critical to the economy of the local area and more broadly to the Country (SDC generates 10% of New Zealand’s dairy exports). In the period 2000-2010 there had been significant expansion of the dairy farming industry and further expansion was likely. Maintenance and renewal costs were estimated to increase significantly and SDC’s road rates were already among the highest in the country. SDC recognized that a new approach was necessary and they could not keep doing things the same way.
SDC developed the Economic Network Plan as an asset management approach that allowed SDC to determine where investment in the network would provide the greatest financial return to the community. The Economic Network Plan considered the following services provided by the network:
- Safety
- Road Condition (Levels of Service)
- Enable Exports
- Service Delivery
- Customer Quality
Consideration of the resources required to maintain the network led SDC to the decision that its highest volume roads would be maintained to its then-current LOS standard. These roads represented 20% of the road network but carried nearly 70% of the traffic. The remaining 80% of the network would have a reduction in standard over time. The Economic Network Plan provided the basis for this change.
Like many agencies, the SDC was forced to take a different approach when financial constraints required change. It enabled all parties to focus on:
- Shifting from ‘Engineering’ to ‘Customer Service Network Management’ (why the service is provided)
- Managing customer expectations proactively rather than reacting to them
- Making safety a priority
- Investing in technology and information to understand, manage and integrate with HCV operators
Source: https://www.nzta.govt.nz/assets/Road-Efficiency-Group-2/docs/southlandnetworkplan.pdf
Note: For more information on this example, see the case study on the SDC’s experience in the International Infrastructure Management Manual (IIMM).
South Dakota DOT
SDDOT’s agency mission is “to efficiently provide a safe and effective public transportation system.” To support this high-level goal the agency sets ten-year objectives for its pavements and bridges, as well as a minimum acceptable condition for pavements. For pavements SDDOT summarizes conditions using Surface Condition Index (SCI), a composite measure represented on a scale from 0 (worst condition) to 5 (best conditions) that incorporates measures of roughness, rutting, faulting and distress indices. For bridges, SDDOT summarizes conditions based on the percentage of structures in good or fair condition, using the FHWA good/fair/poor measure for classifying the condition of a bridge.
To determine how to allocate capital funds for state-owned pavements and bridges SDDOT relies heavily on its pavement and bridge management systems. The agency predicts conditions for a 10-year period for a range of different budget levels, and then compares the predicted performance to the agency’s goals and objectives. The figures, reproduced from SDDOT’s 2018 TAMP, show results in terms of predicted SCI over time for five budget scenarios generated using SDDOT’s Pavement Management System (PMS), and results in terms of percent of bridges in good or fair condition for two budget scenarios generated using the agency’s Bridge Management System (BMS).
Given the projections as well as additional projections of pavement condition for six functional systems, the agency uses its Trade-Off Tool to evaluate the impact of different funding scenarios and recommends the funding distribution that will produce the greatest benefit. The final result of the analysis is a distribution of funding between asset type and functional system, as well as the distribution of funds between four types of work:
- Construction and Reconstruction
- Resurfacing and Asphalt Surface Treatment
- Rehabilitation and
- Safety
Decisions about what capital projects to perform are then made given the funding level established in the trade-off analysis.
Source: SDDOT Transportation Asset Management Plan. 2018.http://www.sddot.com/resources/reports/SDDOT2018TAMPFHWASubmittal.pdf
State Network Investment Strategies
State Network Structure Investment Strategies
Caltrans
Caltrans initiated its Seismic Safety Retrofit Program in the wake of bridge failures experienced in the 1989 Loma Prieta Earthquake. Through this program Caltrans evaluated the retrofit needs for all of the over 12,400 bridges on the State Highway System (SHS). Retrofit needs were prioritized using a multi-attribute procedure that calculated a score for each bridge considering the likelihood of an earthquake at the bridge site, the vulnerability of the bridge to collapse in the event of an earthquake, and the impact of a collapse considering the traffic using the bridge and detour distance in the event of a collapse. Through 2014 the program resulted in retrofit of 2,202 state highway bridges at a cost of over $12.2 billion.
Sources:
2018 Caltrans TAMP
Practical Lessons from the Loma Prieta Earthquake (1994), p. 174-180 https://www.nap.edu/catalog/2269/ practical-lessons-from-the-loma-prieta-earthquake
University of Massachusetts
The Sustainable Solutions Lab at the University of Massachusetts Boston used a scenario-based approach to analyze the feasibility and potential risk reduction of Boston Harbor barrier systems to protect the Boston area from future flooding due to sea level rise. The report included an economic analysis in which costs and benefits were predicted for 32 scenarios considering:
- Two barrier system alternatives
- Two construction time scenarios
- Two scenarios for effectiveness of “shore-based solutions”
- Low and high construction cost estimates
- Discount rates of 3% and 7%
The analysis indicated that the benefits of the proposed barrier system would exceed their cost for both systems evaluated, but only in the case that one assumed a low discount rate, accelerated construction schedule, and failure of other shore-based solutions for mitigating sea level rise. Also, the analysis indicated that beyond a certain point sea level rise would be such that a barrier system would no longer prove effective (since the barrier would have to be closed at all times rather than only during flood events). The report further predicted costs and benefits for two alternative scenarios involving incremental adoption of a variety of shore-based mitigation approaches, and recommended an initial focus on shore-based adaption as the most promising strategy for the City of Boston to address sea level rise.
Regional Municipality of Peel (Canada)
The Region of Peel is the second largest municipality in Ontario, just west of Toronto and supports two cities and a town. Peel assesses needs and priorities across a diverse portfolio of Infrastructure that supports a variety of programs and services including an arterial roads network, solid waste management, water and wastewater treatment distribution and a variety of social, health and emergency services. The Region integrated a number of inputs to enable an optimized investment methodology including a Risk Management, Level of Service, and Life cycle Management Strategies and priortize needs across diverse infrastructure, as illustrated in the figure. The integration of these three strategies was possible through three enablers and working with all of the programs and services to model their infrastructure:
- Establishing a consistent approach to quantifying risk – The Region evaluates the degree of risk that is currently being accepted associated with delivering service levels. Inherent risk (similar to asset criticality) and residual risk (the Region’s risk objective) are established and the current level of risk that an asset presents to service delivery is also determined. The gap between current and residual risk represents the unmet funding and asset needs.
- Establishing a normalized method to determine current level of service to assist the cross-asset funding allocation task. The adopted normalized indicator was determined to be: LOS=% of Assets Meeting LOS + (% of Assets Not meeting LOS x Average Condition of Assets not meeting).
- Adopting a direct relationship between LOS and risk that allows for an analysis of alternative investment scenarios, and modeling techniques to optimize investment allocation. It also allows annual infrastructure evaluation based on the most current condition information and annual Asset Management Reporting.
Peel’s risk-based approach to asset management is integrated with the Region’s Strategic Plan and the Long-Term Financial Planning Strategy, and supports the desired service outcomes by evaluating risk against the Council approved asset levels of service. This approach provides senior decision-makers an objective way to consider resource allocation alternatives and communicate in a common language when evaluating between service areas and different asset portfolios.
Peel Enterprise Asset Management Plan. 2019. http://www.peelregion.ca/council/agendas/2016/2016-04-07-arc-agenda.pdf. http://www.peelregion.ca/finance/_media/2019-enterprise-asset-management-plan.pdf