7.1.1
TAM Data and Systems
Often organizations maintain data on inventory, condition and needs for individual asset classes in separate, self-contained systems. However, increasingly it is necessary to integrate asset and related data distributed across multiple systems to support decision-making.
As discussed in Chapter 6, there are several different types of information needed for TAM decision making. These include:
- Asset inventory and design information including location, type, quantity, material, and design details. This also includes summary level information about the asset as a whole as well as information about individual asset components (e.g. different pavement layers or bridge elements). It may also include asset valuation information (calculated based on deteriorated replacement cost, historic cost, or fair market value).
- Asset condition and performance information including results of visual inspections, measured condition (such as roughness or cracking for pavements), and computed measures of performance (such as remaining service life or “deficient” status designation). This also includes aggregated network level measures (such as the percentage of pavement in good condition).
- Contextual information such as system or network characteristics, functional classification, highway geometric characteristics, traffic volumes, congestion and reliability, crash history, adjacent land uses, weather and features of the natural environment. This information is helpful for understanding factors that may impact the asset service requirements or goals, physical deterioration, funding eligibility, and/or project needs and constraints.
- Work information including date, cost and scopes of work proposed, scheduled and completed on assets – including installation, replacement/reconstruction, rehabilitation, preservation and maintenance. When projects include multiple assets, it is valuable to itemize the work performed by asset.
- Revenue and funding allocation information including historical and forecasted funds available for asset installation, replacement/reconstruction, rehabilitation, preservation and maintenance – by source; and historical allocations by asset category and work type.
- Analysis information including forecasted condition and needs under varying funding or program scenarios, treatment life or life extension results, or project prioritization ratings or rankings.
Agencies store and manage TAM-related data within several different information systems:
- Asset Management Systems (AMS) – this includes pavement management systems (PMS), bridge management systems (BMS), management systems for other specific asset classes (sign or signal management systems), and systems used to manage information for multiple asset classes. All of these systems are used to store inventory and inspection data, and track work performed on an inventory of assets. They also typically include contextual information needed for modeling and analysis, such as traffic, functional classification, number of lanes, and presence of a median. More advanced management systems may identify and forecast preservation and rehabilitation or replacement needs, and analyze funding scenarios. However, often agencies use multiple systems for this purpose, with separate systems for maintaining the asset inventory and predicting future conditions. Pavement and bridge management systems are typically used as the sources for federal Highway Performance Monitoring System (HPMS) and National Bridge Inventory (NBI) reporting.
- Maintenance Management Systems (MMS) – used to plan and track routine maintenance activities. These systems typically store information about planned and completed maintenance activities and resources (labor, materials, equipment) consumed. MMS may include customer work requests, work orders, and maintenance level of service (LOS) information. Some MMS do not store any asset inventory data. In such cases, work is tracked by maintenance activity category and route section rather than specific asset. Note that there are many commercial Asset Management Systems that provide full functionality for asset inventory, inspection/condition assessment, work planning, and work tracking.
- Program and Project Management Systems (PPMS) – used to manage information about capital and major maintenance projects from initial planning and programming through completion. There may be separate systems for managing programming/funding information, preconstruction/design information and construction phase information. Some agencies integrate data from these various systems to obtain a single source of project information. Project information typically includes a mix of tabular data as well as unstructured data (for example, documents and images). Unstructured data may be managed within an engineering content management system separately from other data.
- Financial Management Systems (FMS) – used to manage and track revenues, expenditures, budgets, grants, payments, receipts, and other financial information. These systems are often supplemented with special purpose tools supporting budgeting, revenue forecasting and analysis.
- Enterprise Resource Planning Systems (ERP) – incorporate features of financial systems as well as a wide variety of other modules for functions including human resources, payroll, purchasing, maintenance management, inventory management, equipment management, project programming, project financial management, and revenue forecasting.
- Highway Inventory Systems (HIS) – used to store and report administrative and physical characteristics of the roads and highways. Federal Highway Performance Monitoring System (HPMS) requirements and the Model Minimum Inventory of Roadway Elements (MIRE) define standard road inventory elements; some DOTs maintain additional elements. HPMS elements include pavement type, pavement condition (roughness, cracking, rutting and faulting), and structure type. These systems may include Linear Referencing System (LRS) management capabilities or, may be integrated with a separate LRS management system. Per FHWA’s All Roads Network of Linear Referenced Data (ARNOLD) requirements, state DOTs must submit an LRS for all public roads to FHWA, linked to their HPMS data.
- Crash Data Systems (CDS) – used to store and report data about collisions and resulting injuries and fatalities; which when combined with traffic data and road inventory data provides information for identifying traffic and safety asset needs.
- Traffic Monitoring Systems (TMS) – used to store and report traffic data, required for federal reporting and used for a wide variety of purposes, including TAM processes for asset deterioration modeling, treatment selection and prioritization.
- Engineering Design Systems (EDS) – used to create design drawings or models including design details for different assets. As agencies adopt 3D object-based design modeling practices, there are opportunities to share information about assets between design models and other asset data systems used across the life cycle.
- Enterprise Geographic Information Systems (GIS) – used to manage spatial information, including asset location. Assets may be represented as point, linear or polygon features; location may be specified based on coordinates and/or based on a linear referencing system (LRS). Asset features maintained within GIS may be linked to asset information within other systems.
- Imagery Databases (ID) – used to store highway video imagery and mobile LiDAR data that can be used for manual or semi-automated extraction of asset inventory.
- Data Warehouses/Business Intelligence Systems (DW/BI) – used to integrate data from source systems for reporting and analysis. These may be tailored for TAM decision support.
- Other – there may be other specialized decision support tools that produce analysis results – for example, tools for life cycle cost analysis, cross-asset optimization, or project prioritization.
TIP
Taking stock of what data and information systems supporting TAM is a critical first step to take before pursuing data integration and system development initiatives.
Table 7.1 provides an overview of different systems with the types of information they typically contain. Note that this may vary within each agency.
Table 7.1 - TAM Data and Systems Overview
| Asset Inventory, Condition, and Performance | Contextual | Asset Work Information | Revenue and Funding Allocations | Analysis Results | |
|---|---|---|---|---|---|
| Asset Management Systems | • | • | • | • | • |
| Maintenance Management Systems | • | • | • | • |
|
| Program and Project Management Systems | • | • | • |
||
| Financial Management/ERP | • | • | • | ||
| Road Inventory Systems/HPMS | • | • | • | • | |
| Crash Databases | • | ||||
| Traffic Monitoring Systems | • | ||||
| Engineering Design Systems | • | ||||
| Enterprise GIS Databases | • | • | • | • | |
| Imagery Databases | • | ||||
| Data Warehouses/BI | • | • | • | • | • |
| Other | • |
Common components included in computer-based asset management information systems are shown in Figure 7.1. Network inventory, network definition (e.g., location), and asset condition information serve as the primary components in a database, which may or may not be external to the management system. Agency-configured models are used to predict changes in asset condition over time and to determine what treatments are appropriate as the assets age and deteriorate. These models may be developed and updated based on historical condition and cost data.
When developing a computer-based model, an objective (performance, condition, financial, risk) must be defined within the model for it to evaluate these criteria to develop and select optimal strategies. Metrics such as benefit-cost, risk, condition and treatment costs are often used.
A typical pavement management system performs some type of benefit/cost analysis that determines the performance benefits (typically in terms of improved condition) and the costs associated with each possible treatment timing application. By selecting the projects and treatments with the highest benefit/cost ratio, an agency can demonstrate that it is maximizing the return on its investment.
Bridge management systems more typically rely on optimization to perform a single-objective analysis, such as minimizing life cycle costs or maximizing condition, or a multi-objective optimization analysis that considers factors such as condition, life cycle cost, risk of failure, and mobility. Project- and/or network-level benefit/cost analyses are used in a bridge management system to explore all feasible treatment options over an analysis to determine the most cost-effective set of treatments with the highest benefits to the network.
TIP
Start by defining what questions the agency wants to answer and then make a plan for how data across systems could be integrated to answer these questions.
Figure 7.1 Typical Management System Components
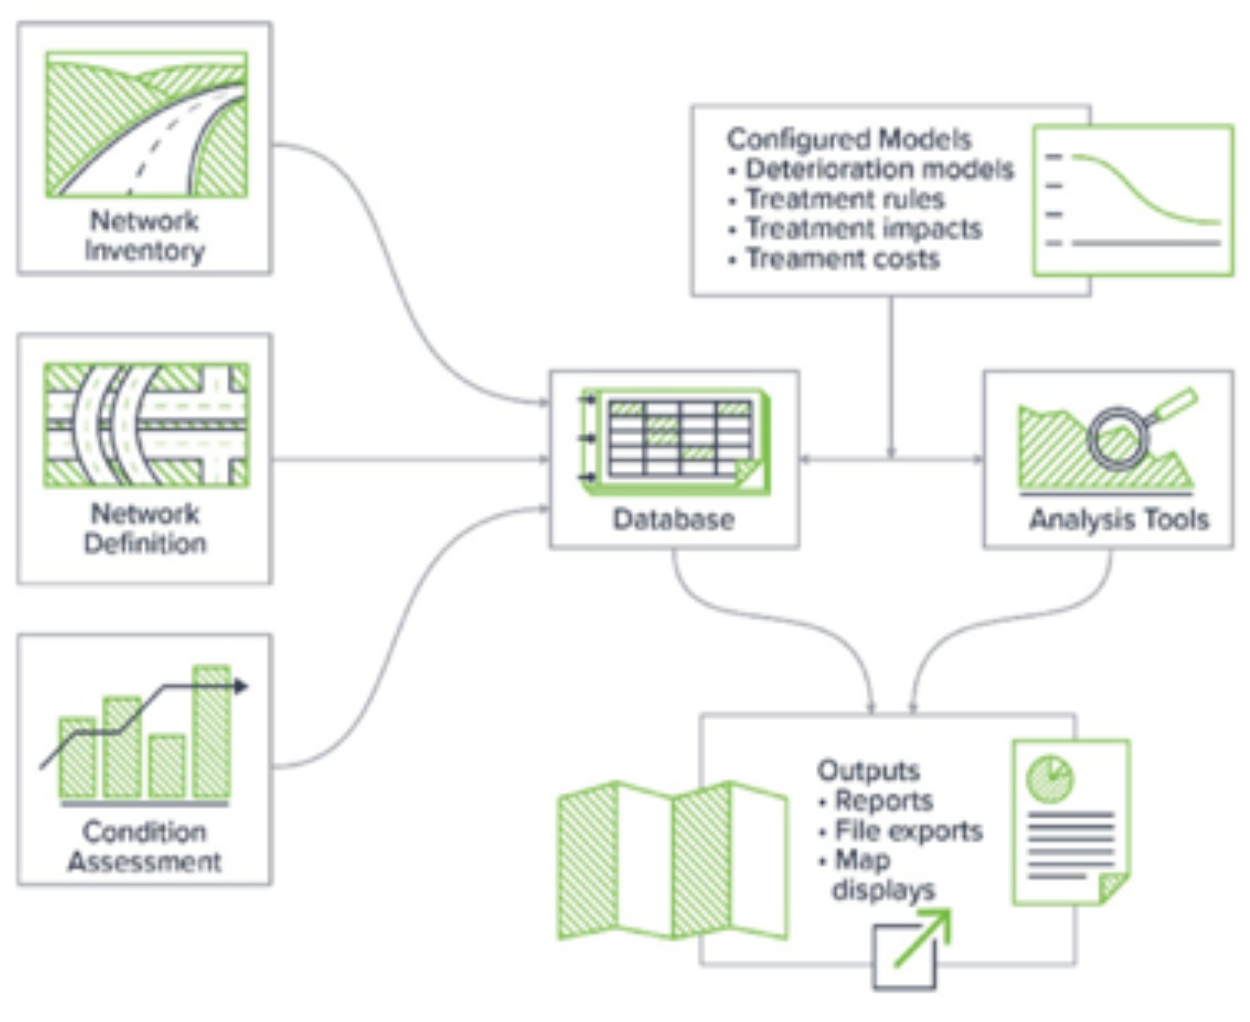
Source: Applied Pavement Technology, Inc. 2018.
Figure 7.2 shows an example of how the different systems listed in Table 7.1 might be integrated, adapted from the approach used by a U.S. state DOT.
Figure 7.2 Data Integration Example
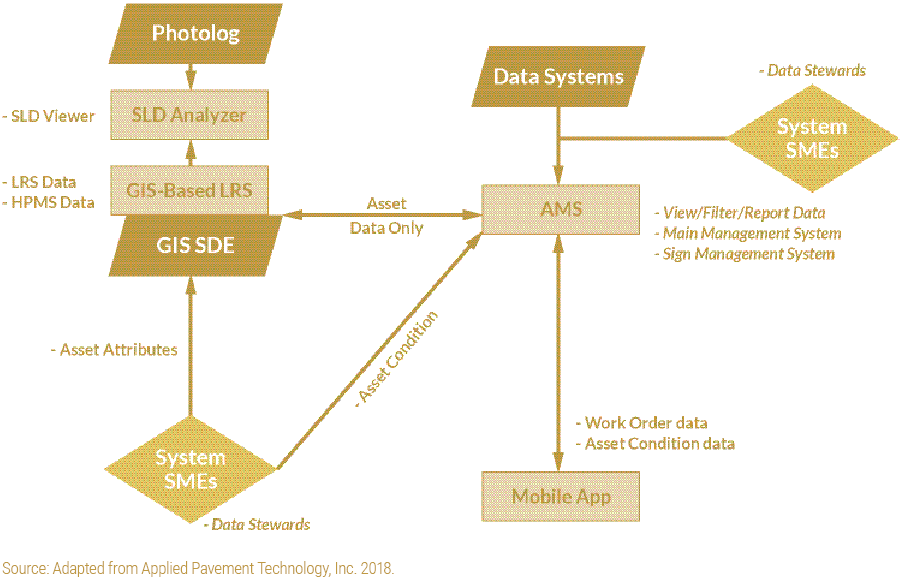
Source: Adapted from Applied Pavement Technology, Inc. 2018.