Section 6.3
Monitoring Funding and Resource Allocation Methods
Understanding past funding and resource allocation trends provides valuable context for future investment strategies. This section discusses the types of trends commonly used in TAM and illustrates how the trends can be used to adjust a program.
Monitoring Funding and Resource Allocation Methods
Understanding past funding and resource allocation trends provides valuable context for future investment strategies. This section discusses the types of trends commonly used in TAM and illustrates how the trends can be used to adjust a program.
6.3.1
Types of Funding and Resource Allocation Trends
This section describes several funding and resource allocation trends that are commonly used by the transportation industry.
Funding and Resource Allocation Trends
Historical trends related to the performance and condition of the highway system or the way investments have been made provide useful information for estimating future investment needs. These trends contain important insights into future needs and highlight the consequences associated with different tradeoffs in the various use of funds. This information can be useful in developing the life cycle management and financial planning portions of a TAMP.
The FHWA introduces the importance of historical trends for the following reasons:
- Illustrating whether past expenditures were adequate or whether they need to increase
- Helping an agency shift from a budgeting process based on incremental growth in expenditures to a performance-based approach addressing need
- Building agency confidence in forecasting future investment needs and conditions
Types of funding and resource allocation trends commonly include:
- Revenue trends over time by funding source
- Funding allocations by program category over time
- Expenditures by asset and work category over time
- Expenditures by system (e.g., Interstate, non-Interstate NHS and non-NHS) over time
- Expenditures by district or region over time
Revenue Trends by Funding Source
A summary of revenue trends by funding source provides an agency with a foundation for projecting the amount of revenue available in future years to address asset needs. These trends help an agency understand whether revenues are increasing or decreasing, identify which revenue sources have significant amounts of variability or more consistent growth rates over time, and illustrate whether the agency is relying on unsustainable funding. The information is a vital foundation for forecasting future revenue levels for planning purposes and helping formulate the assumptions upon which future revenue forecasts are based.
An example of a revenue trend table is provided in Table 6.3. The trends illustrate which revenue sources have increased or decreased over time and are thus important for making future revenue projections. The table also highlights how overall funding levels peaked between 2007 and 2009 largely due to state bonds in 2007, federal bonds in 2007 and 2009 and one-time ARRA (American Recovery and Reinvestment Act) funding in 2009. When these three funding sources ended, the available revenue reverted to 2005 levels. If the effects of inflation were taken into consideration, the agency could also show how the purchasing power of available funding has dropped in later years.
Table 6.3 Example of Historical Revenue Trends by Funding Source
| Sources | 2003 | 2005 | 2007 | 2009 | 2011 | 2013 | 2.15 |
|---|---|---|---|---|---|---|---|
| State Motor Fuel Tax | $658 | $651 | $644 | $637 | $630 | $624 | $617 |
| License, Vehicle Fees | $60 | $60 | $59 | $57 | $53 | $50 | $50 |
| Other | $21 | $21 | $23 | $22 | $21 | $22 | $22 |
| State Bonds | $20 | $76 | $296 | $92 | $0 | $0 | $0 |
| Federal-Aid | $725 | $789 | $825 | $857 | $900 | $888 | $877 |
| ARRA | $0 | $0 | $0 | $273 | $10 | $0 | $0 |
| Federal Bonds | $0 | $0 | $120 | $80 | $0 | $0 | $0 |
| Total Revenue | $1,484 | $1,597 | $1,967 | $2,018 | $1,614 | $1,584 | $1,566 |
Source: NHI 136002 – Financial Planning for Transportation Asset Management. Participant Workbook.
Funding Allocations by Program Category
Transportation agencies typically track funding allocations and expenditures by program category, but the number of categories and the category descriptions may vary depending on the agency. In general, funding allocations are tracked separately for the highest-value assets and the performance of these assets are incorporated into the agency’s strategic goals. This may lead agencies to track investments made in pavements, bridges, maintenance, safety and other assets. Within each of these categories, agencies can project the level of funding expected and predict the conditions and performance expected for it. Past trends in funding allocations by category can help indicate whether expected funding will be adequate to achieve the stated objectives.
Expenditures by Asset and Work Category
Information on past expenditures by asset and work type, along with resulting conditions, provides insight into the amount of funds needed for these activities in future years or helps set expectations for conditions achievable in future years. Where there are differences in planned expenditures and needed expenditures, the agency may report the existing financial gap.
Expenditures by System
Expenditures by system also provide valuable information, laying the groundwork for predicting how future funding levels will impact the condition of the Interstate, non-Interstate NHS and non-NHS assets. The information by system also conveys the agency’s past priorities for system investment, with higher levels of investment in high-volume facilities being common.
Expenditures by District or Region
Trends showing expenditures by district or region may be used to identify geographical areas requiring more focus on a particular type of work or experiencing an accelerated rate of asset deterioration. Information provided at this level can also be used to identify differences in production rates with the potential to serve as the basis for improving future practices. For example, a district with an unusually high production rate for repairing guardrail end treatments could share its experiences with other districts to improve the overall productivity rate at the statewide level.
Overcoming Challenges Associated With Trend Analysis
It can be difficult to predict future trends based on historical data, especially when there is a significant amount of variability occurring. For example, the FHWA construction inflation trends shown in Figure 6.3 illustrate how variability can have a significant impact on historical trends. In this example, the FHWA National Highway Construction Cost Index has a compound annual growth rate of 1.16 percent between 2003 and 2014. However, between 2005 and 2008, significant inflation occurred. An agency preparing a construction estimate in 2006 would look very different than one developed in 2003 or 2013. To address this type of challenge, the agency can include any assumptions made, when preparing an estimate based on trends with significant variability. It could also conduct a sensitivity analysis to better understand the consequences of the potential variability.
Figure 6.3 Actual and Compound Average Annual Construction Inflation Trends between 2003 and 2014
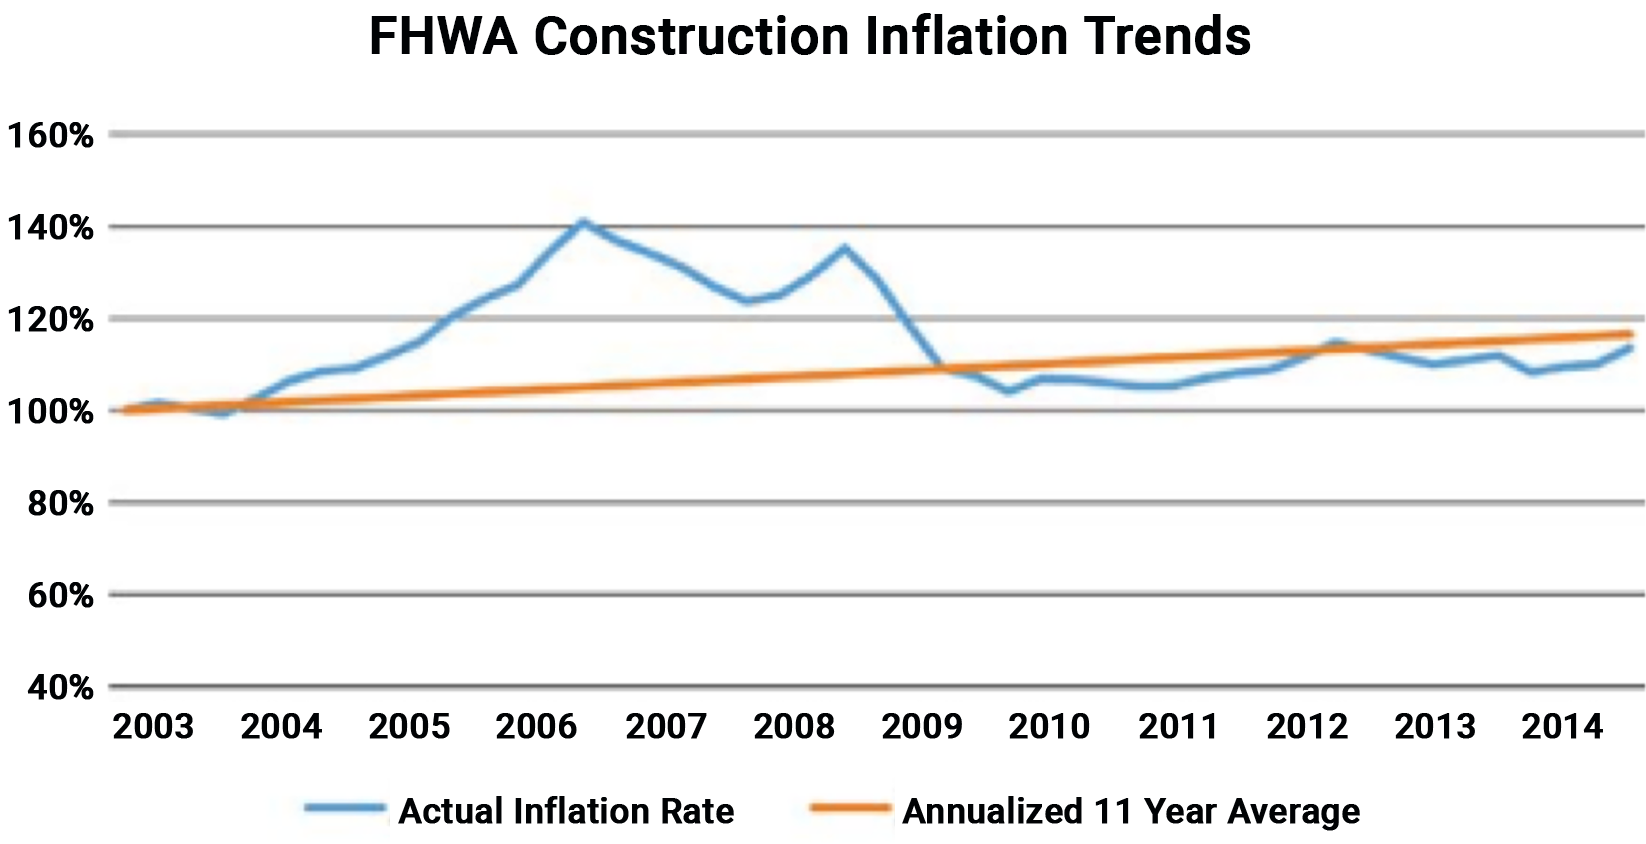
Source: FHWA. 2015. Managing Risks and Using Metrics in Transportation Asset Management Financial Plans.
Another challenge in using trends is the fact that past performance does not guarantee future results, especially if there have been changes in the condition impacting performance. For example, a bridge may have performed well for years, but changes in traffic volumes and weights could significantly increase the rate at which the bridge deteriorates. Similarly, the use of new bridge deck materials may last longer than the materials used previously. To address these challenges, an agency may find it beneficial to modify historical models to better reflect current and future conditions. Monitoring performance over time will allow the agency to develop new models specific to changes in traffic or materials.
A third challenge arises in trying to develop trends for expenditures in work activities when there are inconsistencies within the agency as to what treatments are included in each category. This typically occurs with work activities related to maintenance and preservation. For example, the categorization of a treatment may vary depending on whether the work was performed by inhouse forces or a contractor. Another example is when a preservation treatment is used as a stop-gap improvement on a project that needs more substantial repairs. Again, the actual performance of the stop-gap improvement could be much shorter than the application of that same treatment when used as a preservation improvement. The absence of standardized work categories or the use of stop-gap treatments consistently across the agency can make it difficult to show meaningful performance trends for these types of activities. As a result, it can be difficult to show the benefits associated with these treatments. The solution is to define treatments consistently throughout the agency and to ensure that the treatments are being used as expected.
6.3.2
Using Trend Data to Make Program Adjustments
This section illustrates how some agencies have successfully used historical trends to make program adjustments.
Adjusting a Program Based on Trends
TAM Guide Book Club #8: Strengthening How Data Supports Your TAM Program
The availability of historical trends is integral for making future projections as part of the planning and programming process. As shown by the examples included in this section, agencies have used trend data creatively to make program adjustments and more effectively align planned investments with strategic objectives.
Minnesota DOT
The Minnesota State Highway Investment Plan (MnSHIP) outlines a 20-year strategy for investing in the state highway system. The most recent document, published in 2017, outlines investment priorities for the period from 2018 to 2037 (http://minnesotago.org/application/files/3414/8431/5979/ MnSHIP_Final_Jan2017.pdf). One of the figures included in the plan uses historical inflation trends to illustrate the declining purchasing power of revenue due to construction costs growing at an annual rate of approximately 4.5 percent. This cost growth rate exceeds the projected annual revenue growth rate of approximately 2 percent, which is expected to erode over half of the buying power of revenues by 2037. As a result of this analysis, MnDOT was able to communicate its financial situation with stakeholders and could better manage the risks associated with continued construction cost increases over the planning period.
Anticipated Construction Revenue by Year Including Adjustments for Inflation
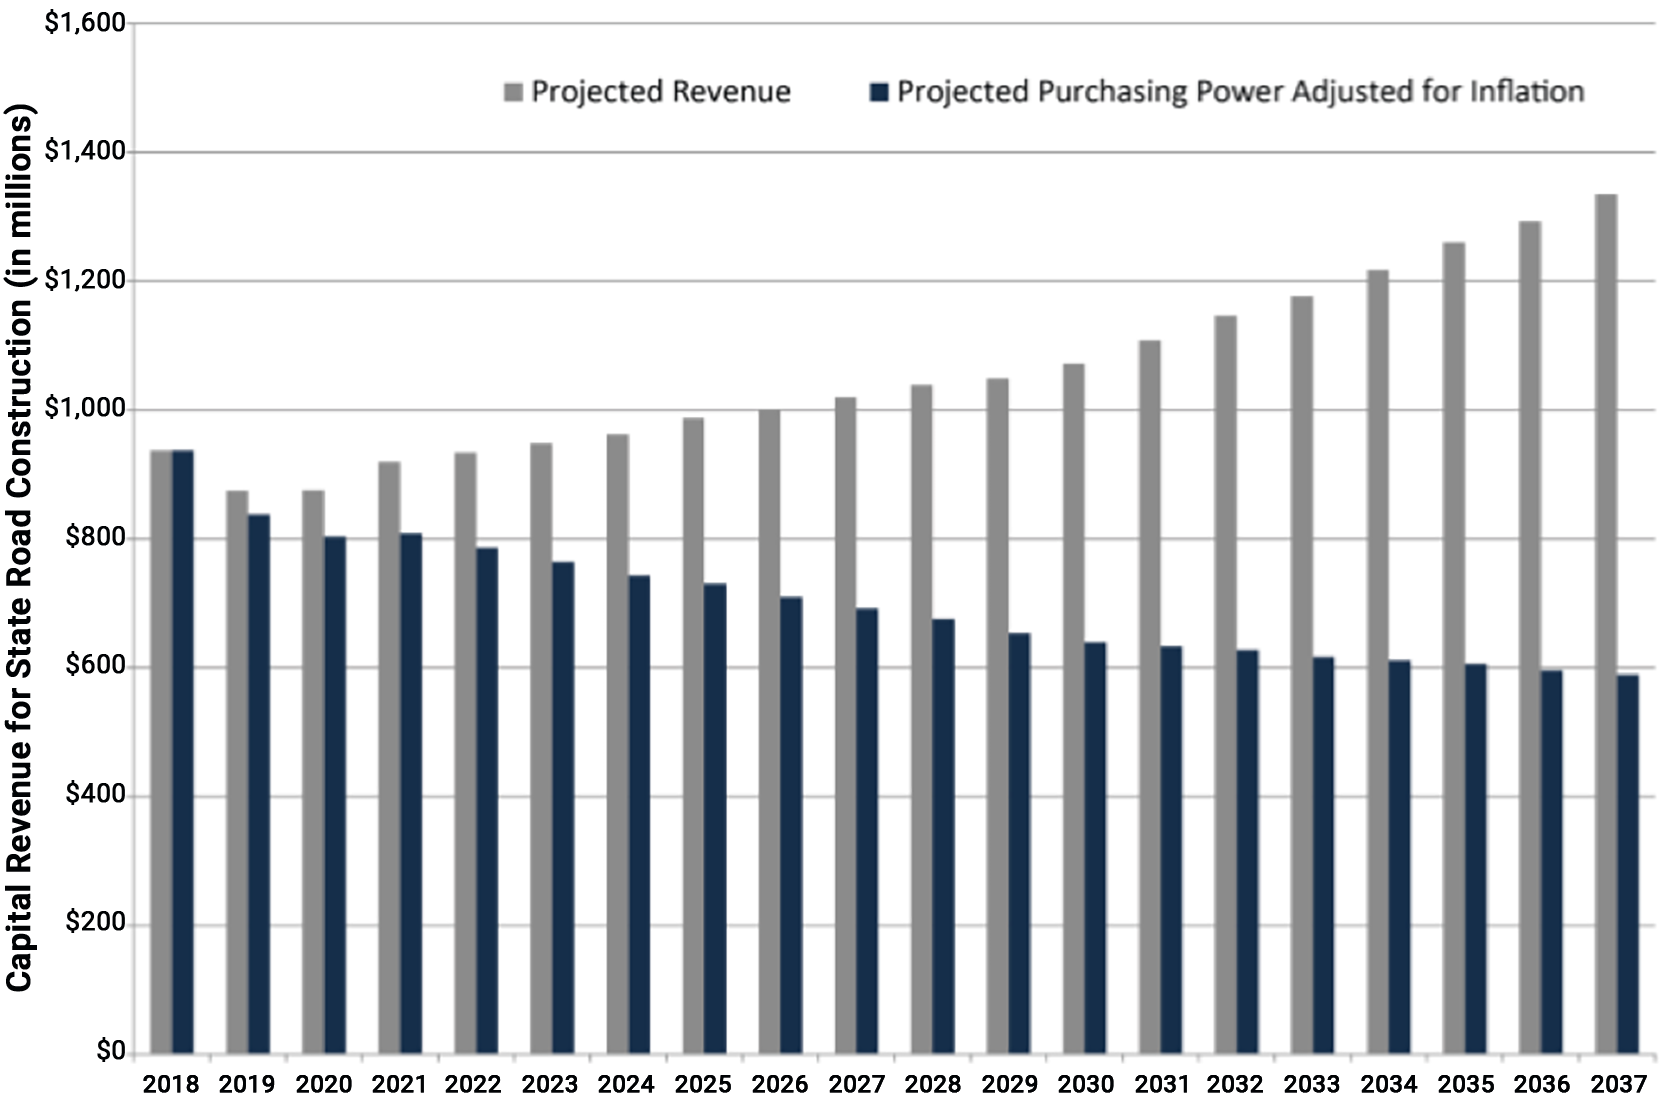
Source: Minnesota DOT. 20-Year State Highway Investment Plan 2018-2037.
Illinois DOT
The Illinois DOT used a graph showing the number of miles of state-maintained roads in need of unfunded rehabilitation or reconstruction, which was referred to as the backlog. The graph, shown in the figure to the right, illustrates the fact that the backlog was growing over time due to the inadequacy of funding. The increasing trend in backlog prompted the Illinois DOT to reconsider its approach to selecting projects and treatments, moving towards the increased use of preservation treatments to slow the rate at which pavement conditions drop into a backlog condition. In addition to the change in treatments, the Illinois DOT developed a new pavement performance measure based on the percent of the network in good enough condition to be a candidate for a preservation treatment. The change in performance measure was intended to shift funding priorities from deteriorated pavements to those that could be kept in good condition for a longer period of time. The changes were documented in the Illinois DOT’s April 2018 Transportation Asset Management Plan (http://www.idot.illinois.gov/transportation-system/ transportation-management/planning/tamp) and were used in developing the fiscal year 2019-2024 Multi-Year Proposed Highway Improvement Program. In addition, new software tools are being acquired to further support this improved approach to managing pavements and bridge assets.
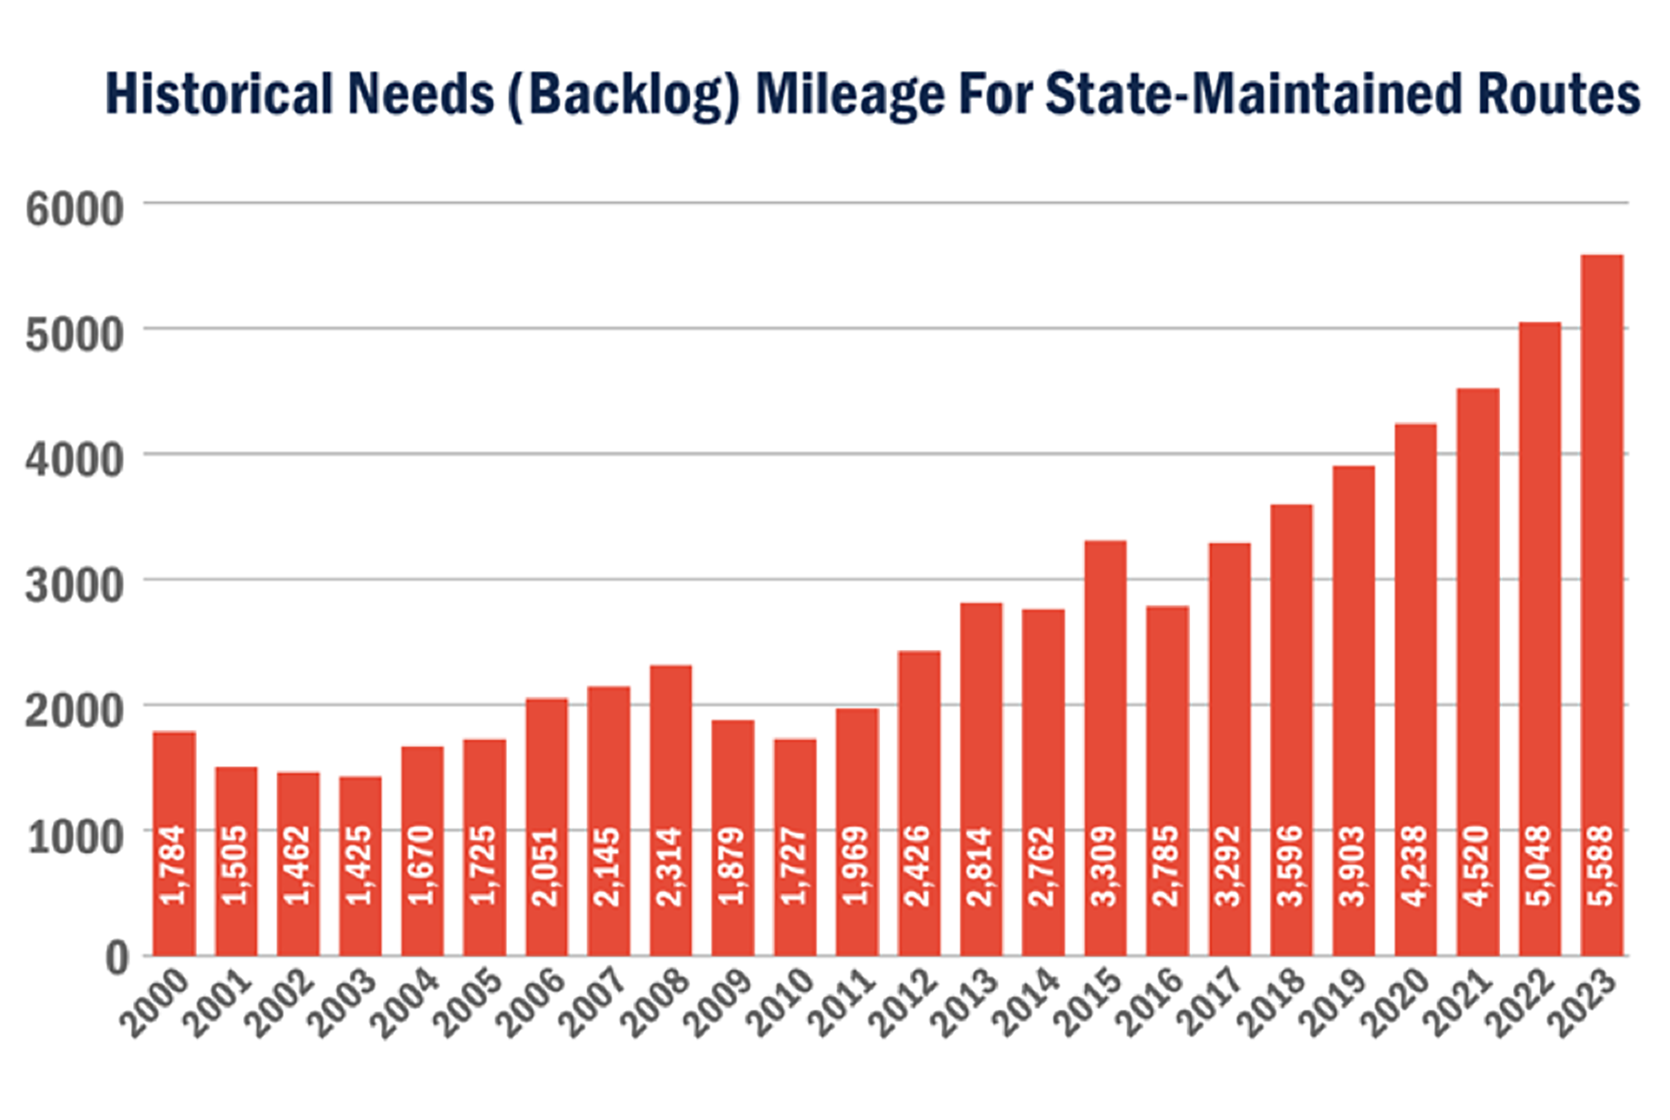
Source: Illinois DOT Transportation Asset Management Plan. 2018.
New Mexico DOT
In 2004, the New Mexico DOT realized that a significant percentage of state-maintained bridges were classified as structurally deficient. To address this issue, the agency targeted increased investments in bridge preservation. Going forward, the agency funded rehabilitation activities for bridges in poor condition and added preventive maintenance activities for bridges in good or fair condition to slow the rate of deterioration on these bridges. As shown in the figure to the right, the program has been very effective in improving bridge conditions. Adding a line to the graph showing the targeted conditions would help convey the impact that the increased preservation expenditures have had on achieving performance objectives.
Trend Showing the Decrease in Structurally Deficient Bridge Deck Area Resulting from Targeted Investments
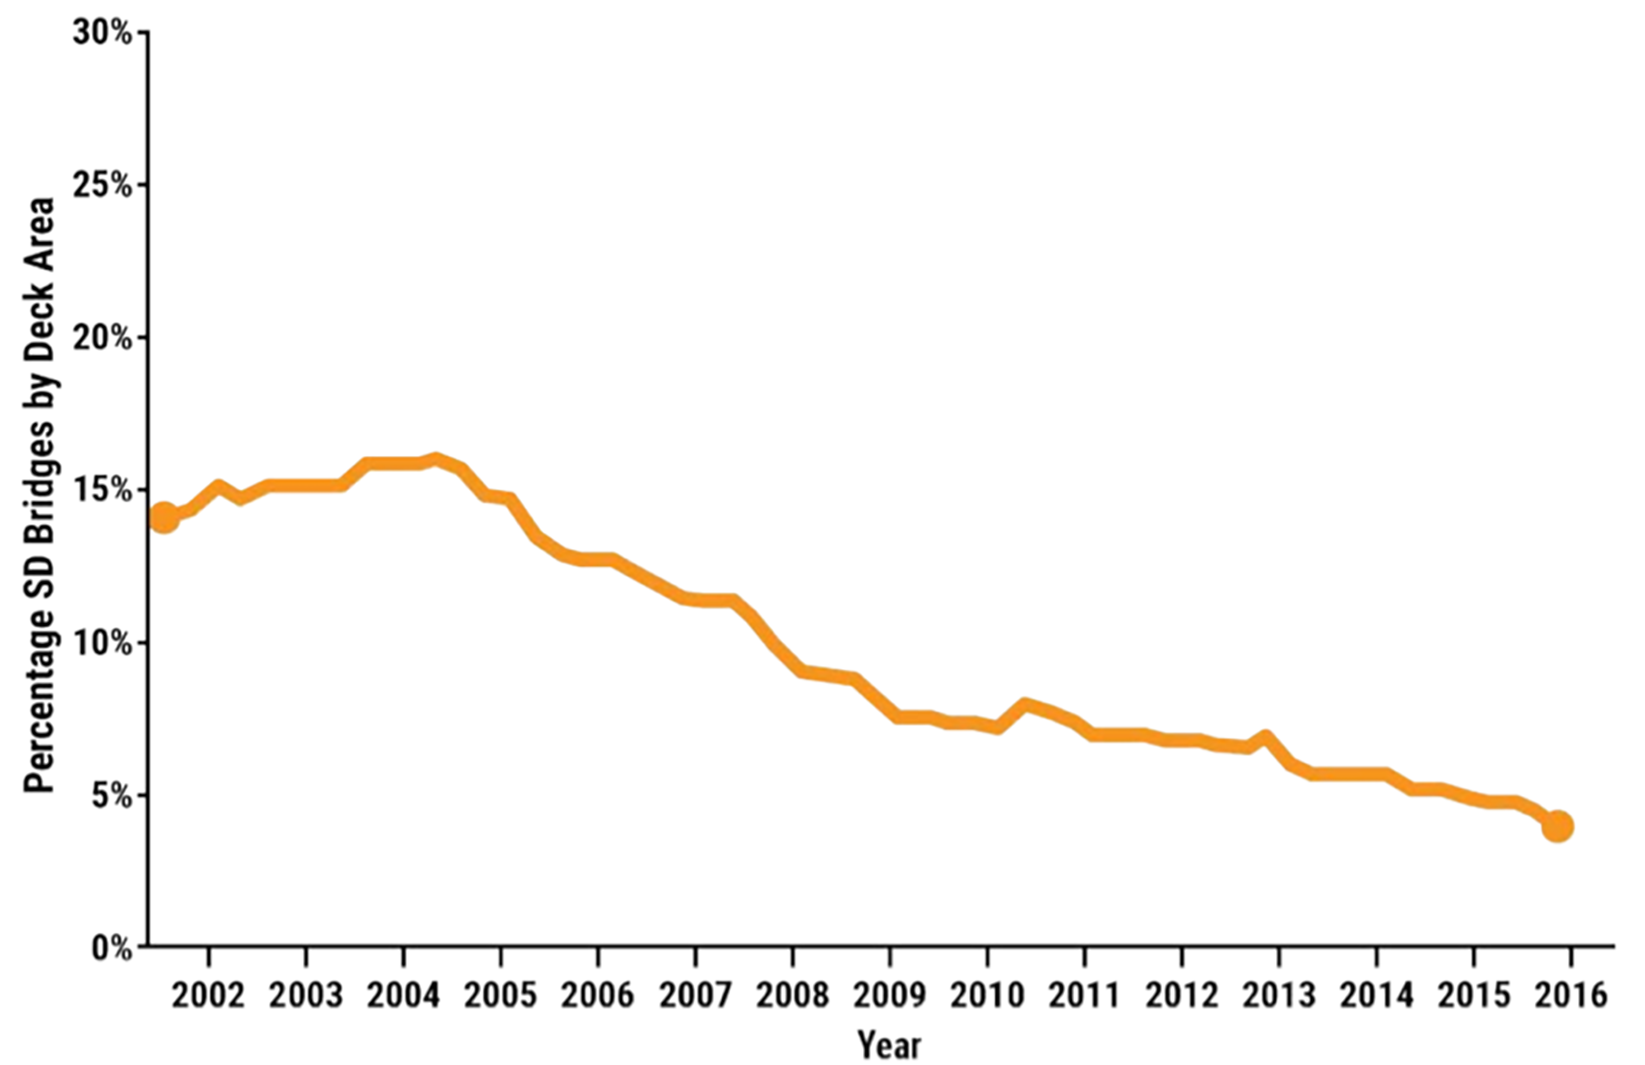
Source: New Mexico DOT Transportation Asset Management Plan. 2018.
South Dakota DOT
To determine the effectiveness of road investments, the South Dakota DOT uses historical trends and projects conditions for each road category to show whether targeted conditions can be achieved with planned investment scenarios. The figure to the right illustrates the type of graph developed for the Interstate network. As shown, the graph presents both historical and projected conditions based on a Surface Condition Index (SCI) that ranges from 0 to 5, with 5 representing a distress free pavement. Overlaid on the graph is the acceptable condition range, which in this case spans an SCI between 3.8 and 4.2. The graph shows that Interstate conditions gradually improved over time. Although it projects average future conditions to drop, they are expected to continue to fall into the acceptable condition range. The results of the analysis provide the agency with confidence that the planned investments will achieve the desired condition levels over the analysis period. In addition, the projections are updated annually to provide a picture of changing financial trends and funding availability. This allows the DOT to react to any downturn in the projections.
Past and Future Pavement Conditions and Goals
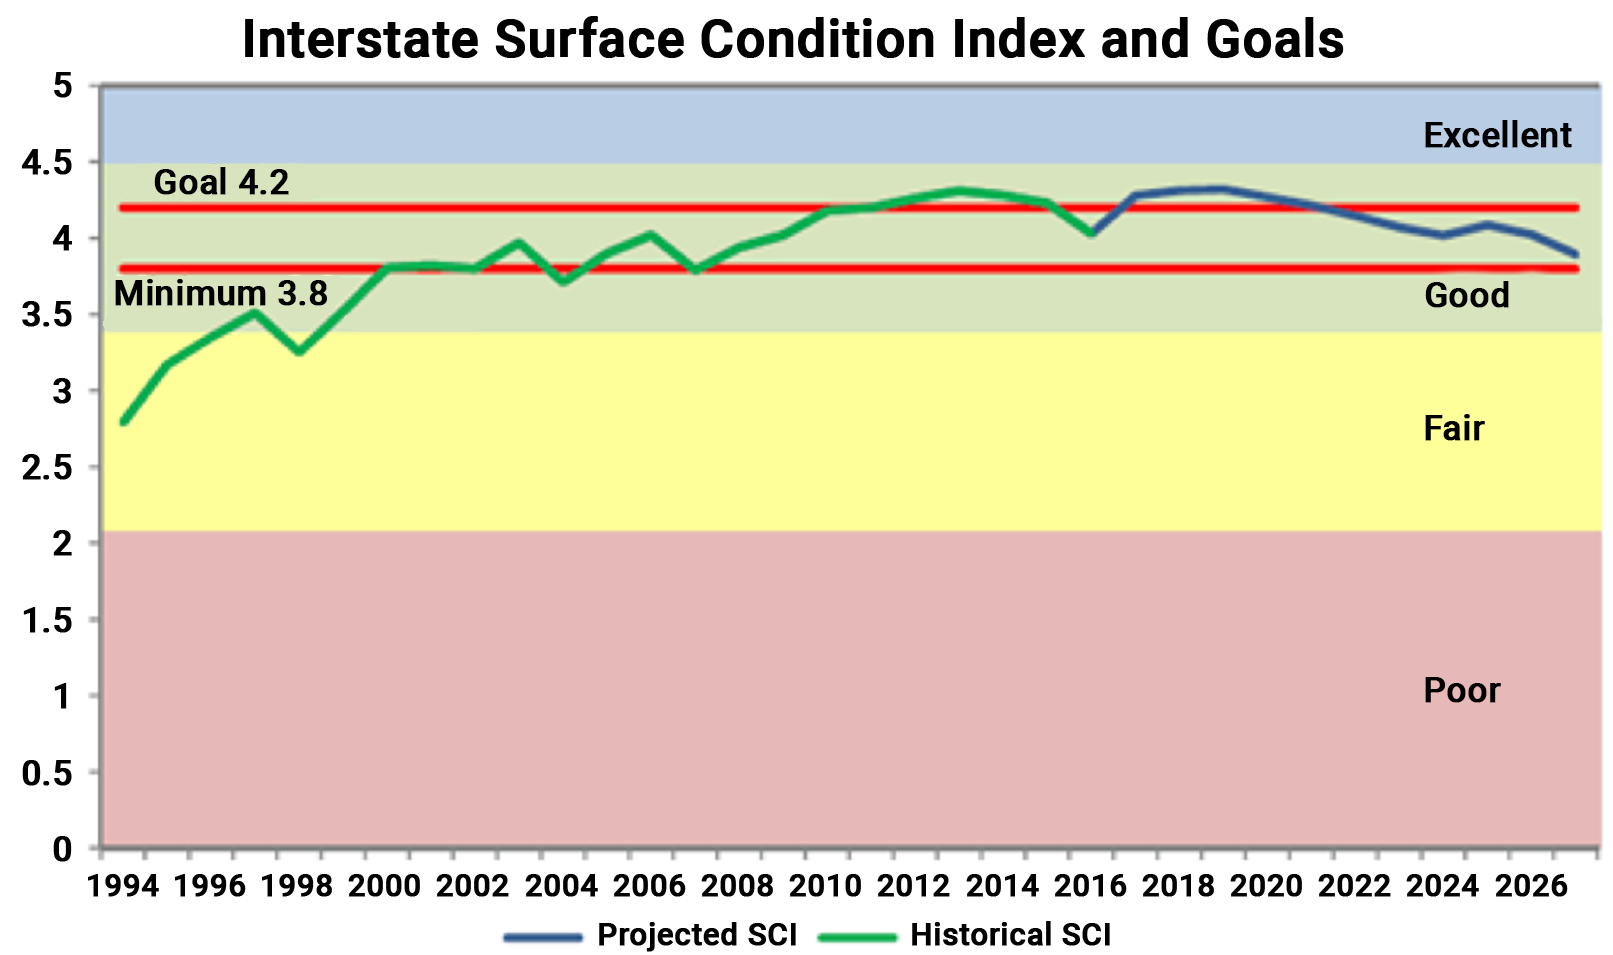
Source: South Dakota DOT Transportation Asset Management Plan. 2019. https://dot.sd.gov/media/documents/SDDOT2019TAMPFHWASubmittalrevised8-28-2019.pdf
Minnesota DOT
The Minnesota State Highway Investment Plan (MnSHIP) outlines a 20-year strategy for investing in the state highway system. The most recent document, published in 2017, outlines investment priorities for the period from 2018 to 2037 (http://minnesotago.org/application/files/3414/8431/5979/ MnSHIP_Final_Jan2017.pdf). One of the figures included in the plan uses historical inflation trends to illustrate the declining purchasing power of revenue due to construction costs growing at an annual rate of approximately 4.5 percent. This cost growth rate exceeds the projected annual revenue growth rate of approximately 2 percent, which is expected to erode over half of the buying power of revenues by 2037. As a result of this analysis, MnDOT was able to communicate its financial situation with stakeholders and could better manage the risks associated with continued construction cost increases over the planning period.
Anticipated Construction Revenue by Year Including Adjustments for Inflation
Source: Minnesota DOT. 20-Year State Highway Investment Plan 2018-2037.
Illinois DOT
The Illinois DOT used a graph showing the number of miles of state-maintained roads in need of unfunded rehabilitation or reconstruction, which was referred to as the backlog. The graph, shown in the figure to the right, illustrates the fact that the backlog was growing over time due to the inadequacy of funding. The increasing trend in backlog prompted the Illinois DOT to reconsider its approach to selecting projects and treatments, moving towards the increased use of preservation treatments to slow the rate at which pavement conditions drop into a backlog condition. In addition to the change in treatments, the Illinois DOT developed a new pavement performance measure based on the percent of the network in good enough condition to be a candidate for a preservation treatment. The change in performance measure was intended to shift funding priorities from deteriorated pavements to those that could be kept in good condition for a longer period of time. The changes were documented in the Illinois DOT’s April 2018 Transportation Asset Management Plan (http://www.idot.illinois.gov/transportation-system/ transportation-management/planning/tamp) and were used in developing the fiscal year 2019-2024 Multi-Year Proposed Highway Improvement Program. In addition, new software tools are being acquired to further support this improved approach to managing pavements and bridge assets.
Source: Illinois DOT Transportation Asset Management Plan. 2018.
New Mexico DOT
In 2004, the New Mexico DOT realized that a significant percentage of state-maintained bridges were classified as structurally deficient. To address this issue, the agency targeted increased investments in bridge preservation. Going forward, the agency funded rehabilitation activities for bridges in poor condition and added preventive maintenance activities for bridges in good or fair condition to slow the rate of deterioration on these bridges. As shown in the figure to the right, the program has been very effective in improving bridge conditions. Adding a line to the graph showing the targeted conditions would help convey the impact that the increased preservation expenditures have had on achieving performance objectives.
Trend Showing the Decrease in Structurally Deficient Bridge Deck Area Resulting from Targeted Investments
Source: New Mexico DOT Transportation Asset Management Plan. 2018.
South Dakota DOT
To determine the effectiveness of road investments, the South Dakota DOT uses historical trends and projects conditions for each road category to show whether targeted conditions can be achieved with planned investment scenarios. The figure to the right illustrates the type of graph developed for the Interstate network. As shown, the graph presents both historical and projected conditions based on a Surface Condition Index (SCI) that ranges from 0 to 5, with 5 representing a distress free pavement. Overlaid on the graph is the acceptable condition range, which in this case spans an SCI between 3.8 and 4.2. The graph shows that Interstate conditions gradually improved over time. Although it projects average future conditions to drop, they are expected to continue to fall into the acceptable condition range. The results of the analysis provide the agency with confidence that the planned investments will achieve the desired condition levels over the analysis period. In addition, the projections are updated annually to provide a picture of changing financial trends and funding availability. This allows the DOT to react to any downturn in the projections.
Past and Future Pavement Conditions and Goals
Source: South Dakota DOT Transportation Asset Management Plan. 2019. https://dot.sd.gov/media/documents/SDDOT2019TAMPFHWASubmittalrevised8-28-2019.pdf