6.3.2
Using Trend Data to Make Program Adjustments
This section illustrates how some agencies have successfully used historical trends to make program adjustments.
Adjusting a Program Based on Trends
TAM Guide Book Club #8: Strengthening How Data Supports Your TAM Program
The availability of historical trends is integral for making future projections as part of the planning and programming process. As shown by the examples included in this section, agencies have used trend data creatively to make program adjustments and more effectively align planned investments with strategic objectives.
Minnesota DOT
The Minnesota State Highway Investment Plan (MnSHIP) outlines a 20-year strategy for investing in the state highway system. The most recent document, published in 2017, outlines investment priorities for the period from 2018 to 2037 (http://minnesotago.org/application/files/3414/8431/5979/ MnSHIP_Final_Jan2017.pdf). One of the figures included in the plan uses historical inflation trends to illustrate the declining purchasing power of revenue due to construction costs growing at an annual rate of approximately 4.5 percent. This cost growth rate exceeds the projected annual revenue growth rate of approximately 2 percent, which is expected to erode over half of the buying power of revenues by 2037. As a result of this analysis, MnDOT was able to communicate its financial situation with stakeholders and could better manage the risks associated with continued construction cost increases over the planning period.
Anticipated Construction Revenue by Year Including Adjustments for Inflation
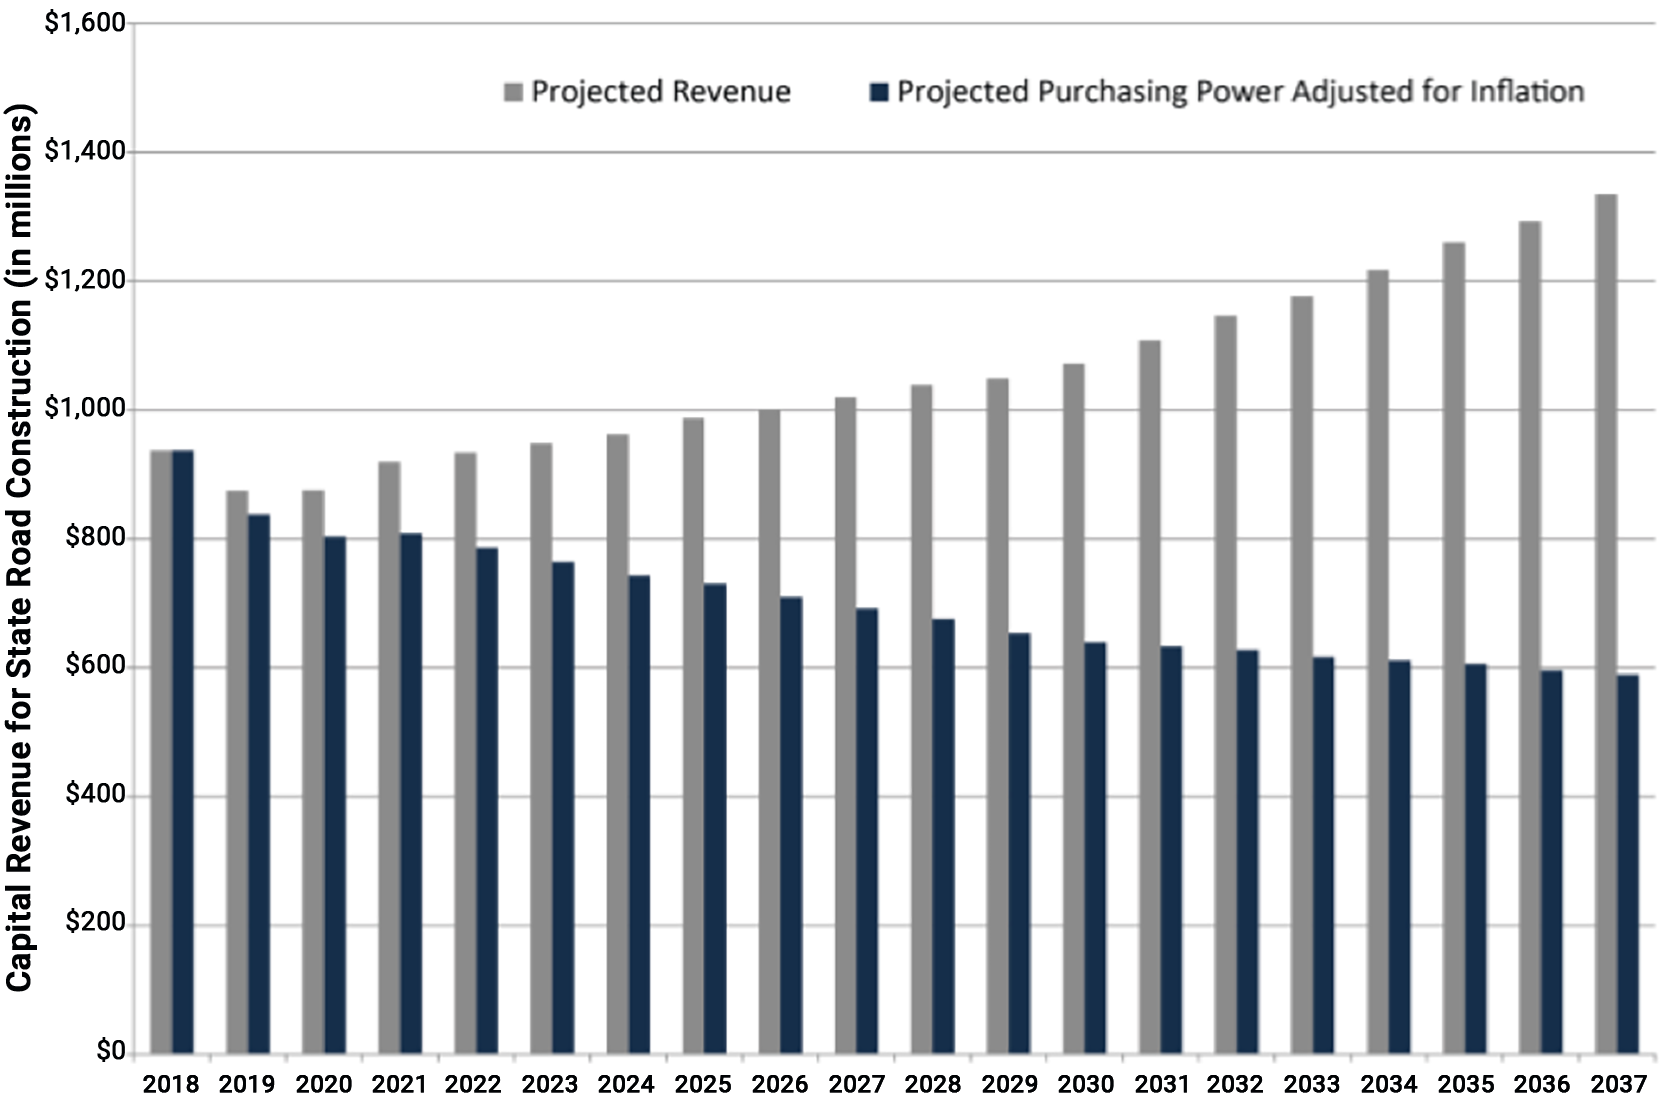
Source: Minnesota DOT. 20-Year State Highway Investment Plan 2018-2037.
Illinois DOT
The Illinois DOT used a graph showing the number of miles of state-maintained roads in need of unfunded rehabilitation or reconstruction, which was referred to as the backlog. The graph, shown in the figure to the right, illustrates the fact that the backlog was growing over time due to the inadequacy of funding. The increasing trend in backlog prompted the Illinois DOT to reconsider its approach to selecting projects and treatments, moving towards the increased use of preservation treatments to slow the rate at which pavement conditions drop into a backlog condition. In addition to the change in treatments, the Illinois DOT developed a new pavement performance measure based on the percent of the network in good enough condition to be a candidate for a preservation treatment. The change in performance measure was intended to shift funding priorities from deteriorated pavements to those that could be kept in good condition for a longer period of time. The changes were documented in the Illinois DOT’s April 2018 Transportation Asset Management Plan (http://www.idot.illinois.gov/transportation-system/ transportation-management/planning/tamp) and were used in developing the fiscal year 2019-2024 Multi-Year Proposed Highway Improvement Program. In addition, new software tools are being acquired to further support this improved approach to managing pavements and bridge assets.
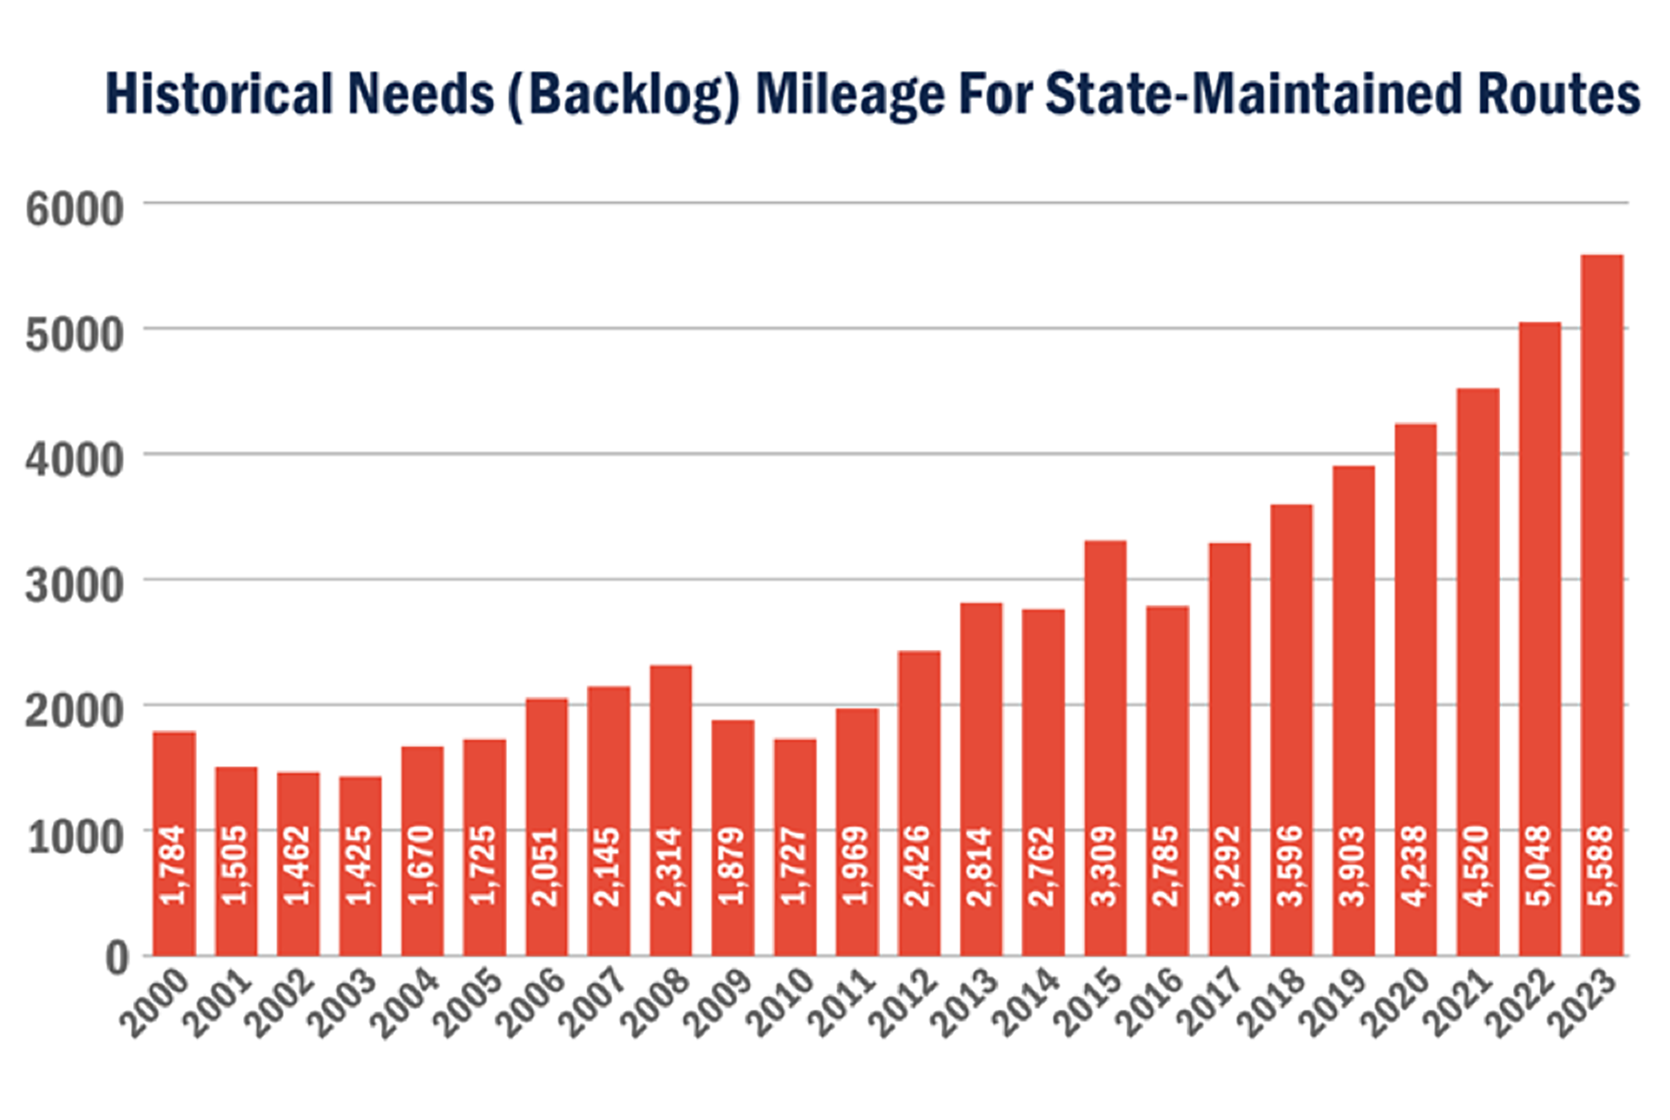
Source: Illinois DOT Transportation Asset Management Plan. 2018.
New Mexico DOT
In 2004, the New Mexico DOT realized that a significant percentage of state-maintained bridges were classified as structurally deficient. To address this issue, the agency targeted increased investments in bridge preservation. Going forward, the agency funded rehabilitation activities for bridges in poor condition and added preventive maintenance activities for bridges in good or fair condition to slow the rate of deterioration on these bridges. As shown in the figure to the right, the program has been very effective in improving bridge conditions. Adding a line to the graph showing the targeted conditions would help convey the impact that the increased preservation expenditures have had on achieving performance objectives.
Trend Showing the Decrease in Structurally Deficient Bridge Deck Area Resulting from Targeted Investments
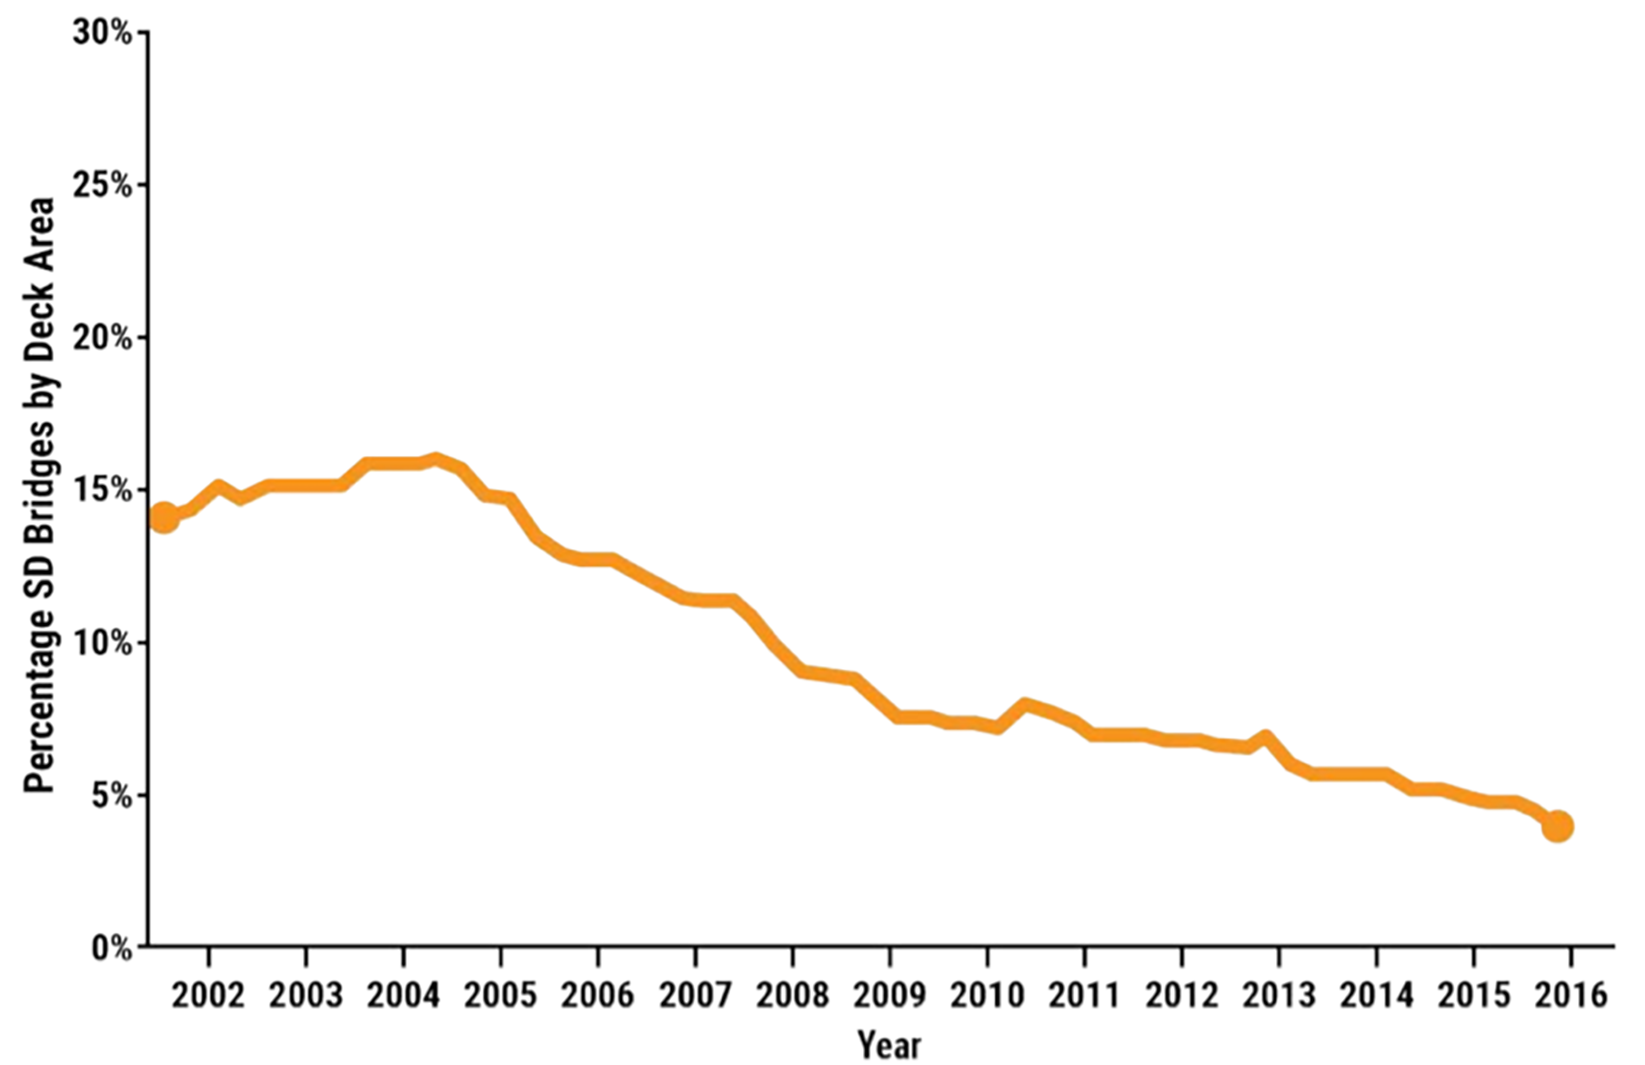
Source: New Mexico DOT Transportation Asset Management Plan. 2018.
South Dakota DOT
To determine the effectiveness of road investments, the South Dakota DOT uses historical trends and projects conditions for each road category to show whether targeted conditions can be achieved with planned investment scenarios. The figure to the right illustrates the type of graph developed for the Interstate network. As shown, the graph presents both historical and projected conditions based on a Surface Condition Index (SCI) that ranges from 0 to 5, with 5 representing a distress free pavement. Overlaid on the graph is the acceptable condition range, which in this case spans an SCI between 3.8 and 4.2. The graph shows that Interstate conditions gradually improved over time. Although it projects average future conditions to drop, they are expected to continue to fall into the acceptable condition range. The results of the analysis provide the agency with confidence that the planned investments will achieve the desired condition levels over the analysis period. In addition, the projections are updated annually to provide a picture of changing financial trends and funding availability. This allows the DOT to react to any downturn in the projections.
Past and Future Pavement Conditions and Goals
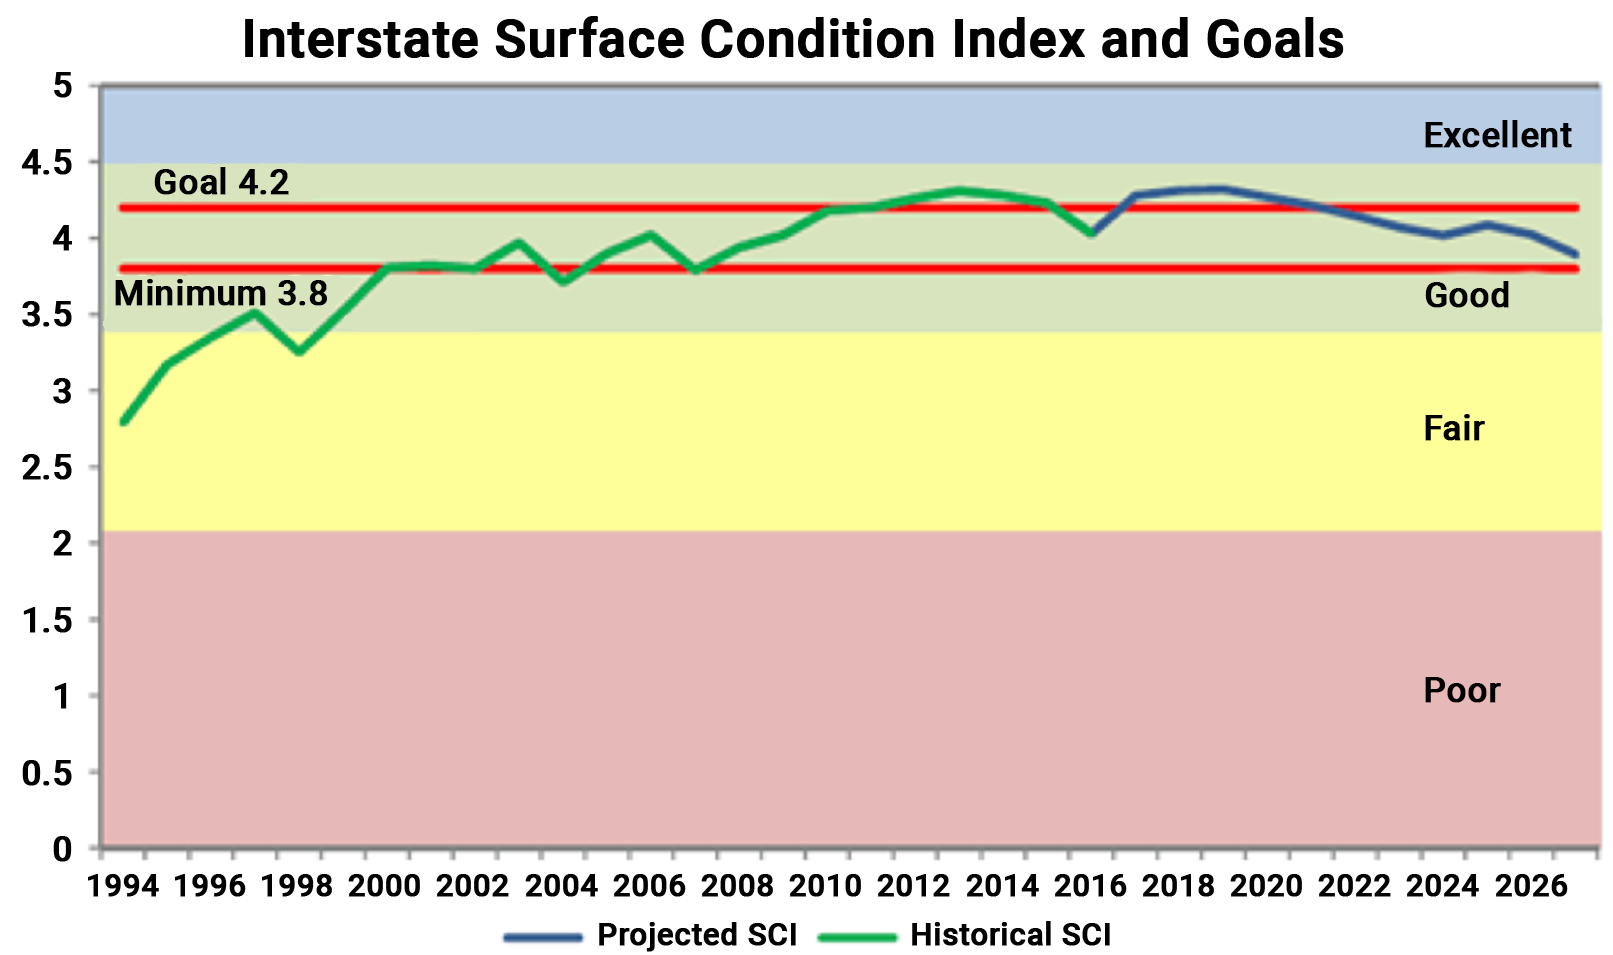
Source: South Dakota DOT Transportation Asset Management Plan. 2019. https://dot.sd.gov/media/documents/SDDOT2019TAMPFHWASubmittalrevised8-28-2019.pdf