Section 6.5
Monitoring Risks and TAM Processes
Chapter 2 introduced a process for identifying, analyzing, evaluating and managing risks, including a step for monitoring and reviewing risks on a regular basis. Since risks are constantly changing, it is important to establish processes to track changes in risks over time and monitor actions taken to manage risks. The same is true of other business processes that support TAM; they should be monitored regularly to ensure that analysis results continue to support investment decisions and that any gaps between desired and actual levels of maturity are addressed. This section introduces tools used to track and manage risks, highlights methods of monitoring and evaluating TAM processes, suggests a structure for assigning responsibility for implementation of new processes, and illustrates successful practices used in transportation agencies.
6.5.1
Monitoring and Managing Risks
Risk registers, risk reports, and risk mitigation plans are commonly used tools to track and manage risks. This section describes and illustrates each of these tools.
Risk Register
A risk register is one of the most common tools for tracking and managing risks within an agency, since it provides a framework for capturing critical information about each risk, its importance to the agency, mitigation plans and tracking and managing responsibilities. A risk register is typically generated as a spreadsheet, though other formats are available. An example of a comprehensive risk register, which includes assignments for risk mitigation strategies, is presented in Figure 6.4. Over time, columns may be added to indicate when the risk information was last updated, what further action is required and whether adequate progress is being made towards the mitigation strategy.
A risk register should be reviewed at least quarterly to evaluate whether the risk register or the risk management plan for any of the performance areas needs to be updated. Periodic changes to the risk profile may be obtained through executive staff meetings meant to evaluate progress regularly, or ongoing reports tracking risk mitigation efforts and results. Annually, the agency may determine whether any strategic-level risks should be adjusted based on evaluation of the agency’s performance and the risk reports provided by the risk owners.
Figure 6.4 Excerpt from a Risk Register Showing Responsibility for Risk Mitigation Activities
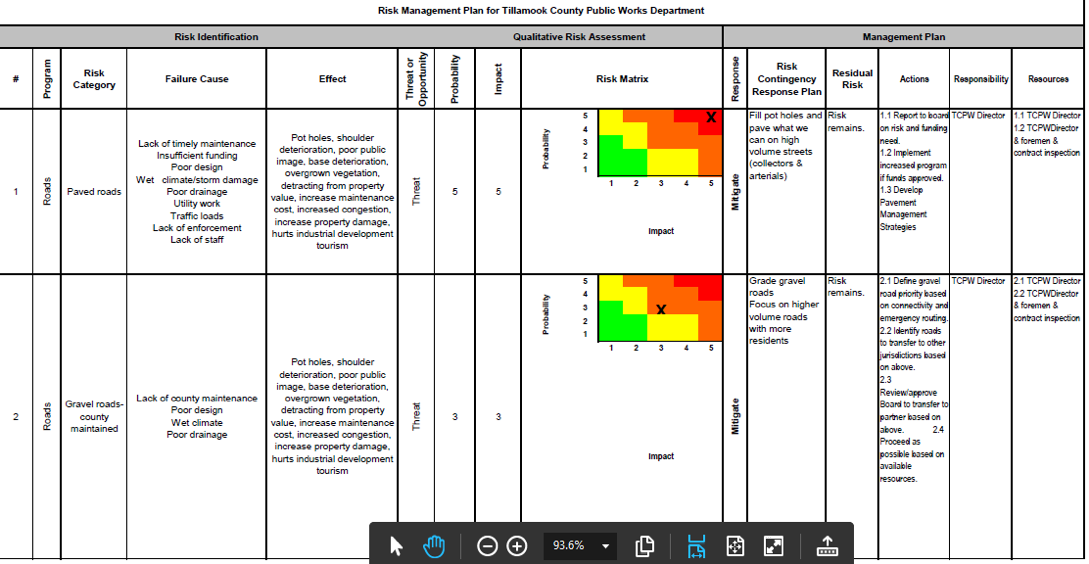
Source: Tillamook County Public Works Road Asset Management Plan. 2009.
Risk Reports
Risk reports, which reflect excerpts from the risk register, may be developed by risk owners to communicate ongoing activities and manage risks at any level of the organization. The type of risk report shown in Figure 6.5 conveys what steps are being taken to address project delivery risks.
TAM Webinar #50 - Improving Your Next TAMP Miniseries: Improving Risk Management and Resiliency
Risk Mitigation Plans
Some agencies see benefit in developing risk mitigation plans for their assets to ensure compliance with regulatory programs and help embed risk into all agency business activities. For example, a risk management plan may be developed when a bridge’s risk of failure reaches a certain threshold. These plans identify specific risks and mitigation strategies to undertake in order to reduce the likelihood or impact associated with the risk.
Figure 6.5 Sample Risk Report
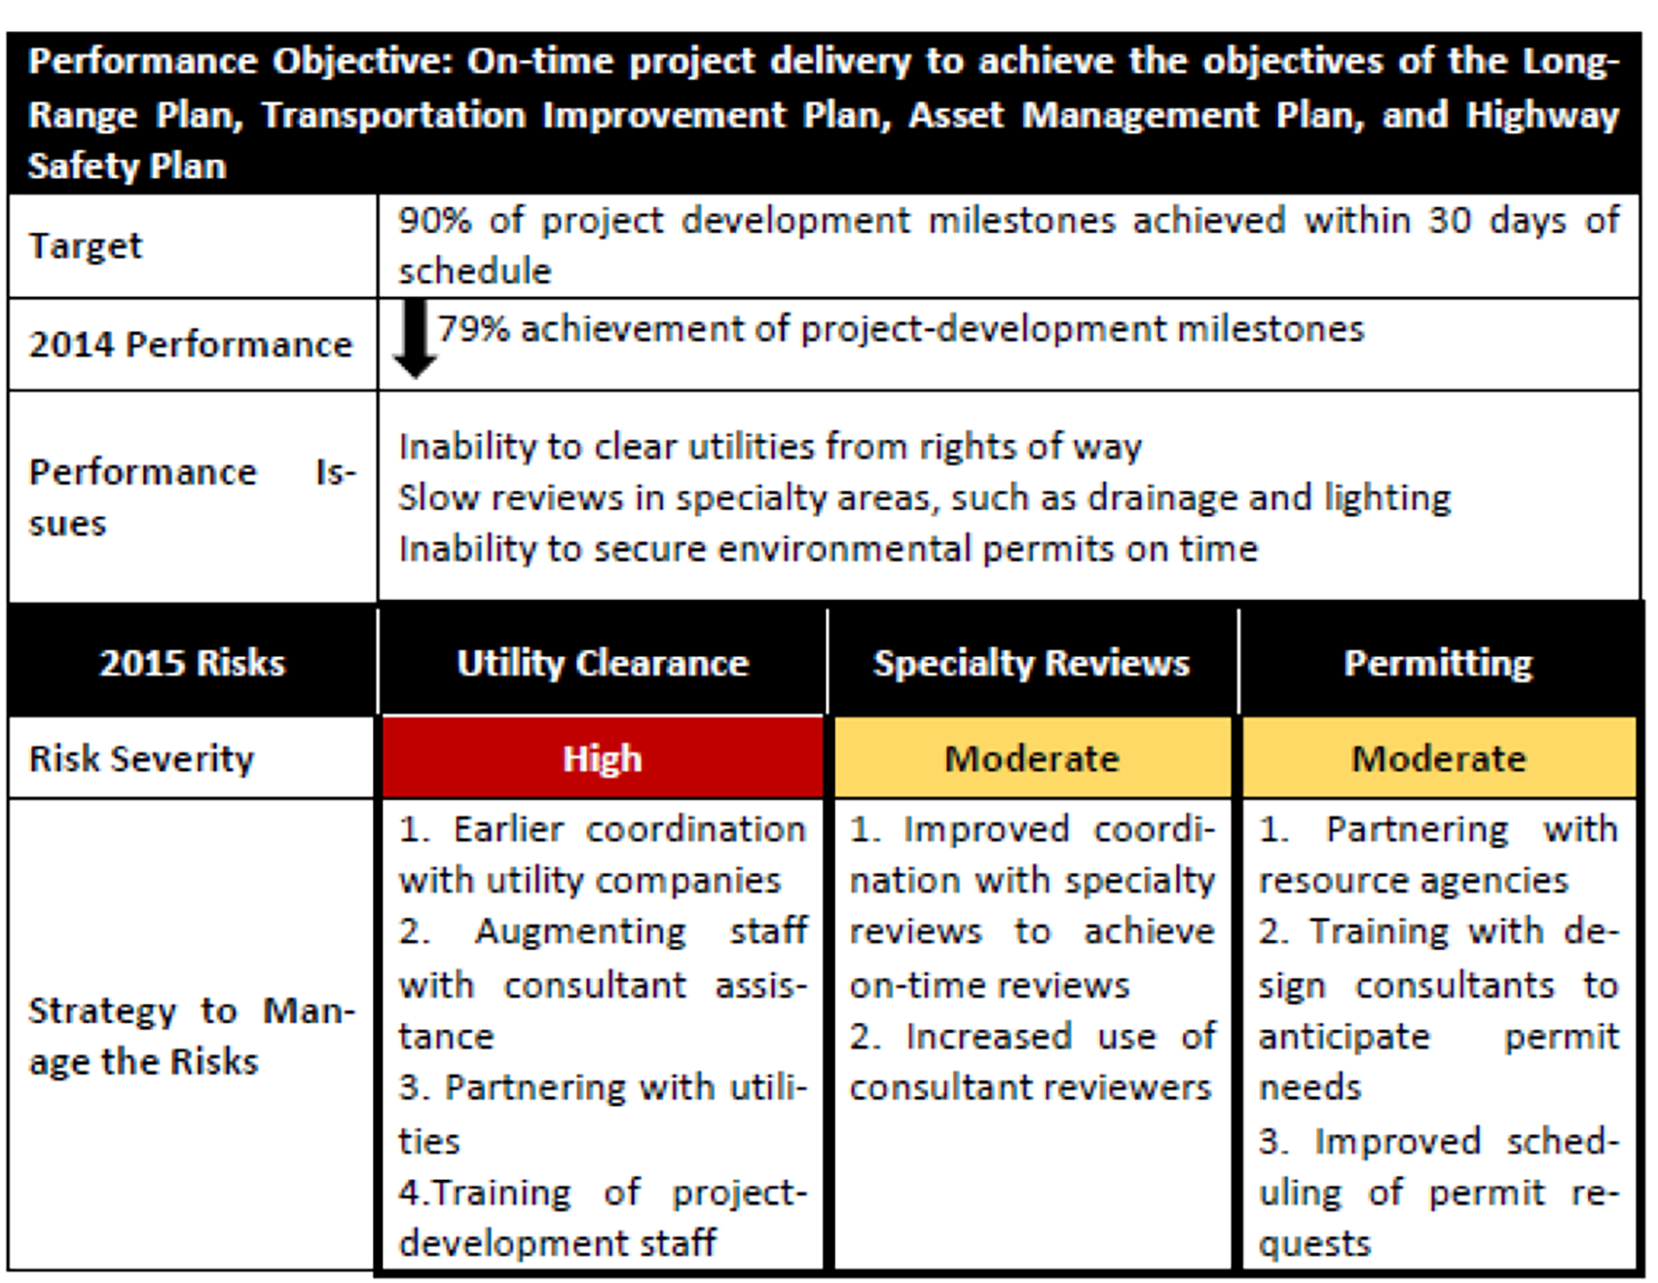
Source: AASHTO. 2016. Managing Risk Across the Enterprise: A Guide for State DOTs.
Washington State DOT
The Washington State DOT recognized the potential safety risk to highway travelers and the adverse impact on regional commerce associated with unstable slope failure. To become more proactive in managing this risk, WSDOT developed the Unstable Slope Management System (USMS) that provides a method for evaluating known unstable slopes and using the information to prioritize slopes for funding of proactive stabilization efforts. The mitigation objective of the unstable slope management program is to sustain a desired state of good repair and low risk over the life span (> 20 years) of known unstable slopes and constructed geotechnical assets at the lowest practicable cost.
Bay Area Rapid Transit Authority (BART)
BART developed a Local Hazard Mitigation Plan in 2017 to reduce or eliminate long-term risks to human life and property related to hazards such as earthquakes, tsunamis, landslides, flood, sea level rise, wildfire, and drought. The analysis focused primarily on high-priority fixed assets such as passenger stations, substations, switching stations, train control rooms, shops/yards, ventilation structures, and emergency exits. These assets were prioritized based on criticality in terms of the impact of an asset failure on reliable and safe service capabilities. The Local Hazard Mitigation Plan details the potential impacts associated with each hazard type and presents prioritized mitigation actions that were determined by votes from the participating members of a Task Force Committee called the Emergency Preparedness Task Force Committee (EPTFC) that is made up of senior managers from all BART departments. The plan is updated at least once every five years. An example of the type of mitigation strategies that were developed are presented in the Figure below. The Plan has helped identify agency priorities that are being addressed and has fostered collaboration among different Departments to reduce potential hazards.
Lessons Learned from Implementing Risk Management
Following the 2016 publication of the AASHTO Guide for Enterprise Risk Management, TRB initiated an NCHRP project to pilot the framework introduced in the Guide. Pilot case studies were conducted by the Tennessee, Utah, and Washington State DOTs; a peer exchange was conducted; and a national community of practice (COP) was formed to provide support for the implementation of risk management and to advocate for further research in this area. Several risk management tools were developed through the research that are documented in the NCRHP report.
A variety of different types of risks were considered during the pilot studies. The Tennessee DOT focused primarily on three types of risks:
- Those associated with inconsistencies in quick-clearance processes associated with crashes and other highway incidents.
- Those associated with roadway plans that could affect the quality, cost, and schedule for delivering projects.
- Those caused when incomplete project plans are submitted for bids.
Several tools were developed to better manage these risks, including checklists, plan submittal delay forms, and a Memorandum of Understanding with the Tennessee Department of Safety to clarify roles and responsibilities for quick clearances.
The Utah DOT pilot addressed four initiatives:
- Reduce risks to Utah DOT objectives by improving hiring practices and retention.
- Reduce risks of poor performance by enhancing the employee evaluating process and strengthening leadership skills.
- Reduce risks of poor performance through a knowledge management process.
- Develop a repeatable and scalable process to assess corridor risks caused by natural disasters.
The study improved leadership access to information for hiring and leading employees, provided a training toolkit for supervisors, and resulted in a process to integrate and incorporate risk and resilience assessments into existing decision-making processes.
Washington State DOT used the pilot to support the full integration of its enterprise risk management practices. The agency also elected to address cultural sensitivity and inclusion in workforce development activities. These efforts resulted in new workforce development and outreach materials.
The pilot studies helped expose the participating agencies to strategies for managing risk. They demonstrated the importance of promoting enterprise risk management concepts among agency leaders to mainstream the concepts into common agency practices. This increases the likelihood that enterprise risk management practices endure beyond changes in agency leadership.
The participants also recognized important links between risk management and both performance and asset management programs. Several agencies recognized the importance of risk management to improving the resilience of a highway network to unexpected events such as flooding or erosion. The pilot studies demonstrated that the ability to use risks to inform planning and investment decisions can be beneficial.
6.5.2
Monitoring TAM Processes and Improvements
As discussed throughout this Guide, TAM is an on-going process that needs to be monitored regularly to ensure that it continues to support an agency’s business decisions. This section presents tools and methodologies used to accomplish this. It also builds on the application of some of the tools introduced in section 2.5.1, Assessing Current Practice.
Gap Assessment
A gap assessment is used to identify differences, or gaps, between an agency’s practices with those suggested as part of an established asset management framework. The results of a gap assessment can be used to identify changes in business processes that are needed or can serve as the basis for developing priorities as part of an asset management implementation plan. The gap analysis tool available through the AASHTO TAM Portal is an example of a tool that can be used by an agency to assess practices so they can be compared to desired, or more established, practices. A summary of the gap analysis tool and other frameworks for assessing current practice was presented in Figure 2.6. An example of a chart showing targeted and current ratings in eight assessment areas over a 2-year period is presented in Figure 6.6. While the agency’s targeted, or desired, scores remained consistently at a rating of 5 over both years, the graph is helpful for determining what assessment areas have improved over the 2-year period and which have not.
Figure 6.6 Example Comparing Assessment Area Scores from Two Different Rating Periods
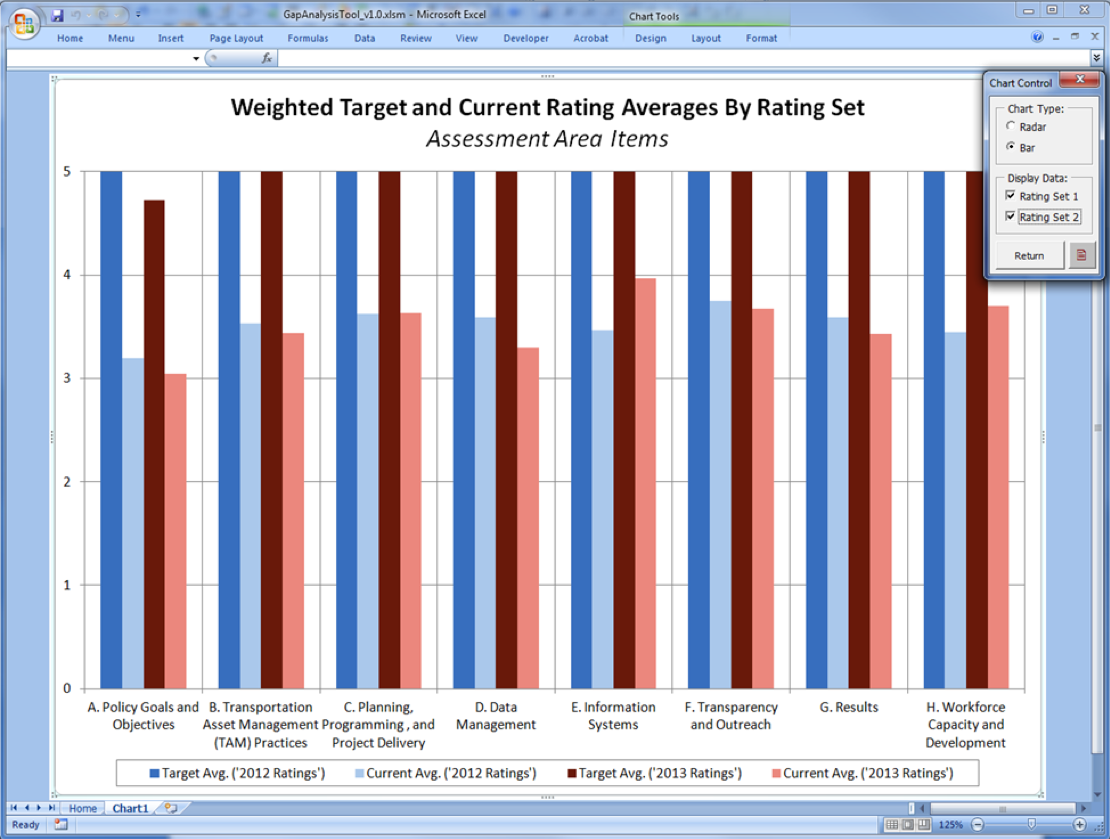
Source: AASHTO. 2015. Transportation Asset Management Gap Analysis Tool User Guide
TAM Webinar #29 - Process Improvements
Lean Six Sigma
A lean six sigma framework uses statistical analyses as part of a continuous improvement approach to evaluate the cause of defects and methodically make improvements to processes to eliminate them. Six sigma is widely used in manufacturing sectors, but can also be applied to many TAM functions. For instance, a six sigma analysis would be useful in analyzing the root cause of defects associated with a poorly-performing asset. Combining a six sigma approach with a Lean framework, which focuses on reducing waste, can help agencies develop more efficient and sustainable processes.
New Brunswick DTI
The New Brunswick Department of Transportation and Infrastructure (NB DTI) implemented Lean Six Sigma to better understand and document existing practices and identify where improvements could be implemented for savings or service improvement. The Lean Six Sigma methodology helps to improve performance through a collaborative process that systematically removes waste and reduces variation while improving customer satisfaction. For NBDTI, the application of this methodology has resulted in increased efficiency, cost savings, refined procurement methods, improvements to delivery of operational programs and services, and has supported the application of asset management decision-making to pavements, bridges, culverts, facilities and other transportation infrastructure.
ISO 33000 Process Assessment
The International Organization for Standardization (ISO) has introduced a variety of processes to support Asset Management. ISO 33000 is a standard for Process Assessment, providing a structured approach to help agencies better understand their processes, evaluate the suitability of their existing practices, and to determine the suitability of another organization’s processes as a way of improving practices.
TAM Webinar #63 - Consistency Reporting
The Balanced Scorecard
The Balanced Scorecard approach was initially developed to enable organizations to make complex tradeoff decisions that balanced different types of performance criteria. For example, the framework could be used to help determine the tradeoff between improving the level of service provided in a corridor with improving environmental sustainability on a statewide basis. The balanced scorecard analysis takes a holistic and balanced approach to these types of issues, by simultaneously evaluating competing and dissimilar needs (such as Customer Satisfaction, Sustainability, and Safety). The advantage to the balance scorecard approach is the fact that multiple measures are considered, rather than a single set of measures that might disregard an important factor in the decision. The results produce a rational set of investment decisions that considers all of the factors that the agency views as most important to the final selection.
6.5.3
Managing Implementation Responsibilities and Processes
Monitoring the implementation of new business processes benefits from a clear definition of roles and responsibilities. This section illustrates approaches that agencies use to assign responsibility for implementation activities so that progress can be tracked.
Assigning Responsibility for Managing Risks and Implementation Activities
A key step in managing risks and other implementation activities is establishing a set of roles and responsibilities for each of the tasks at hand. The risk management process introduced in Chapter 2 includes a step for monitoring risks on a regular basis through a risk register or some other format.
Risks
When assigning responsibilities for managing risks, different types of risks are normally assigned to different individuals or divisions within a transportation agency:
- Strategic risks – Impact the agency’s ability to achieve its goals and objectives. Ignoring risks at this level can cascade down to impact programs and projects at other levels of the agency. For this reason, strategic risks are generally assigned to members of agency leadership and may be addressed by incorporating risks into regular management meetings and key policy documents.
- Program risks – Impact an organization’s ability to administer a program in a coordinated way. Risks at this level are typically the responsibility of the program manager ensuring there are effective controls over risk and documenting risk activities.
- Project risks – In many agencies, a project risk management process is in place with responsibility for managing risks assigned to the project manager. At this level, primary responsibilities include managing risks associated with the project scope, schedule and quality.
- Activity risks – Associated with routine activities performed by the agency, such as snow and ice control, incident response and pavement management modeling. Risks at this level are typically managed and monitored by the activity leader.
An agency may elect to appoint a Chief Risk Officer or to create an Enterprise Risk Unit charged with coordinating the agency’s risk processes and training agency personnel on risk management. If such a unit is created, the Chief Risk Officer often reports directly to the agency’s chief executive officer or another high-ranking executive, symbolizing the importance of risk management to the agency. Agencies without a formal Risk Unit may rely on the Asset Management Coordinator to serve in this role. Examples showing how risk roles and responsibilities have been assigned are provided in Figures 6.8 and 6.9.
Process Improvements
The success of a TAM Improvement Plan that outlines steps the agency plans to take to enhance its asset management program will also benefit from a clear set of roles and responsibilities for:
- Implementing the suggested changes,
- Monitoring progress, and
- Repeating the assessment periodically.
Ownership for the implementation of the planned enhancements generally lies with the TAM Coordinator in an agency, with specific tasks assigned to one or more individuals with the specialized skills and capabilities that are needed.
A major function of the implementation leader is to ensure that all roles are understood and that the various assignments are being carried out as intended. This may require building buy-in among the team members, who are likely busy with other responsibilities. It is also important that the leader have the authority responsibility to hold individuals accountable for progress, even if they report to a different division within the agency.
Table 6.4 Risk Types and Owners
| Risk Levels | Owners | Types of Risks |
|---|---|---|
| Strategic Risks | CEO Senior Staff Board or Commission |
|
| Program Risks | Leaders of major programs, such as safety, pavement, bridge, maintenance, information technology, project delivery, human resources |
|
| Project Risks | Project Managers |
|
| Activity Risks | Activity Managers |
|
Source: Transportation Research Board. 2014. Managing Risk Across the Enterprise: A Guide for State DOTs.
The availability of adequate resources is also important to the successful implementation of an improvement plan. Establishing clear role descriptions that describe the required tasks to be completed and the requirements needed to implement the changes enables an agency to compare the availability of existing staff to the implementation requirements. In some instances, staff may be temporarily assigned responsibility for a particular activity, such as developing a TAMP, to address a specific need.
Table 6.5 Risk Management Roles and Responsibilities for the Highways Agency, England
| Project Manager |
|
| Project Team Member |
|
| Project Risk Manager |
|
| Risk Owner (Action Owner) |
|
Source: Washington State DOT. 2018. Project Risk Management Guide.
Using a RACI Matrix to Assign Roles and Responsibilities
A variety of tools can be used to track roles and responsibilities, including spreadsheets or various type of matrices. One form of responsibility assignment matrix is known as a RACI matrix. The term RACI is taken from the words:
- Responsible. Assigning responsibility for getting the work done or making a needed decision. This is typically the person who gets the work done.
- Accountable. Identifying the person who is responsible for making sure the work is done and is ultimately answerable for the activity or decision.
- Consulted. Recognizing that others will provide information needed to complete an activity.
- Informed. Keeping people aware of progress that is made.
A RACI matrix can be used for virtually any type of activity with a combination of tasks, milestones, and key decisions that will be carried out by several different individuals. It is a common technique used for managing different types of construction, implementation, and monitoring activities and is especially useful when responsibilities are divided across divisions or departments within an organization. For that reason, it is commonly used as part of an enterprise-wide risk management program to help ensure that risks are monitored regularly. An example of a RACI matrix showing responsibilities for adopting an enterprise risk management (ERM) policy is shown in figure 6.7.
Figure 6.7 Example RACI Chart
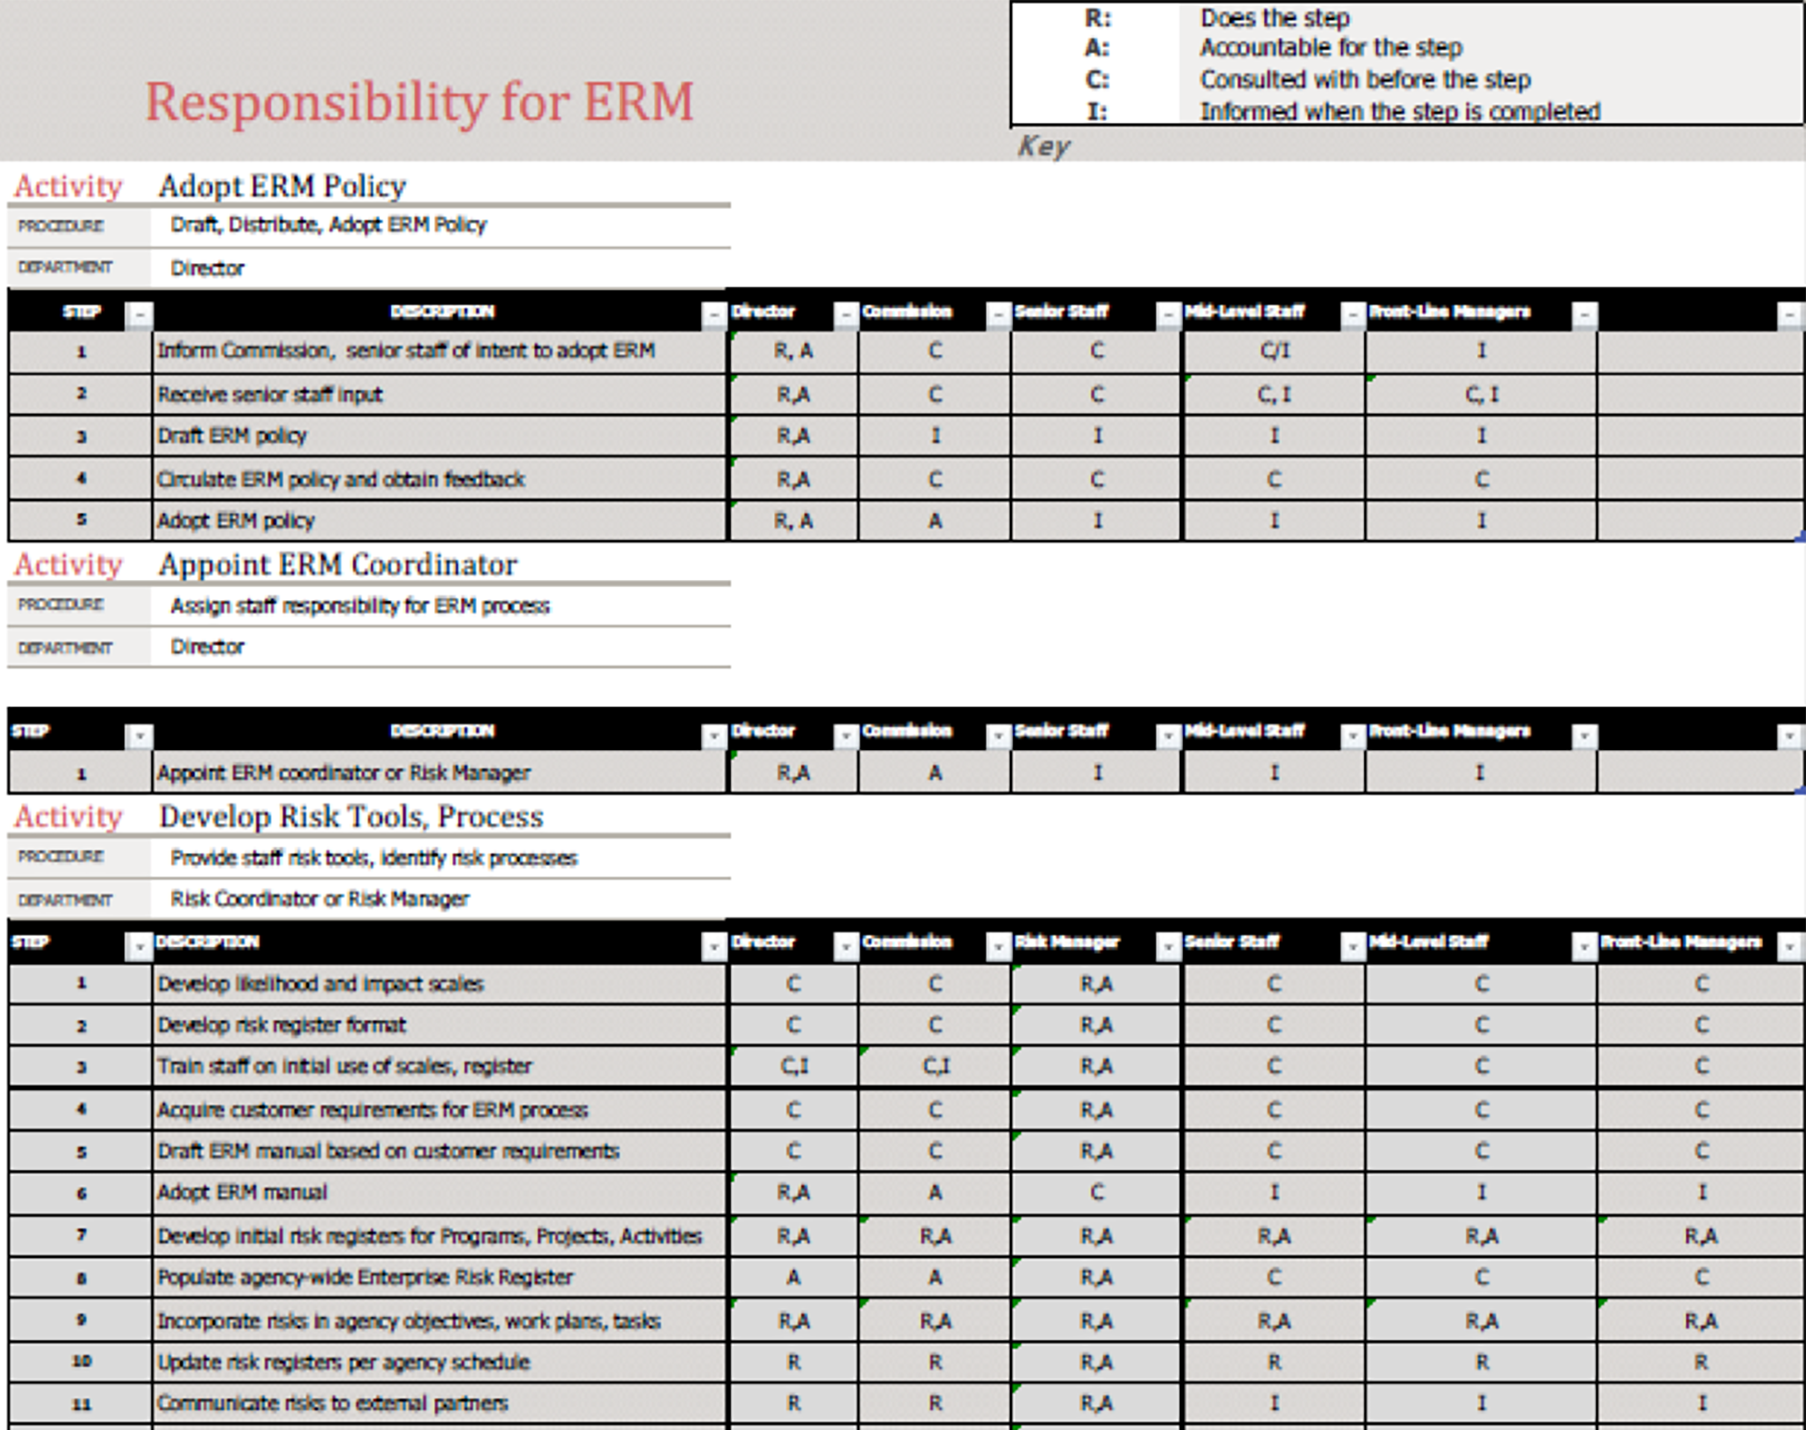
Source: AASHTO. 2016. Managing Risk Across the Enterprise: A Guide for State DOTs.
Seattle DOT
The City of Seattle has a Sidewalk Safety Repair Program to oversee the maintenance of the City’s many sidewalks and curbs to keep them safe and accessible. The Program includes a process for monitoring sidewalk conditions, investigating complaints of unsafe or inaccessible sidewalks, determining repair responsibility (e.g.., adjacent property owner, City, or other utility), using existing conditions to proactively mitigate conditions (beveling and asphalt shimming), and permanently repairing sidewalks that are the City’s responsibility. Repairs are leveraged with other capital projects as much as possible, so coordination with other Divisions is vital to the effectiveness of the program.
Because of the number of Divisions involved in managing sidewalks, the City assigned roles and responsibilities in a RACI matrix, that identifies those with Responsibility (R) or Accountability (A), those that need to be Consulted (C), and those that need to be Informed (I). The RACI matrix developed by the City includes one additional role beyond the four that are commonly included in the matrix. The City of Seattle added an “S” to represent a support role for personnel who might provide information to the process but are not necessarily responsible for completing the activity. The RACI matrix has served the City well by clarifying the responsibilities of each of the Divisions involved in some aspect of the Program so the program looks seamless to the public, as shown on the City’s website (https://www.seattle.gov/transportation/projects-and-programs/programs/maintenance-and-paving/sidewalk-repair-program).
Excerpt From a RACI Matrix Developed by the City of Seattle for Managing Roles and Responsibilities for its Sidewalk Repair Program
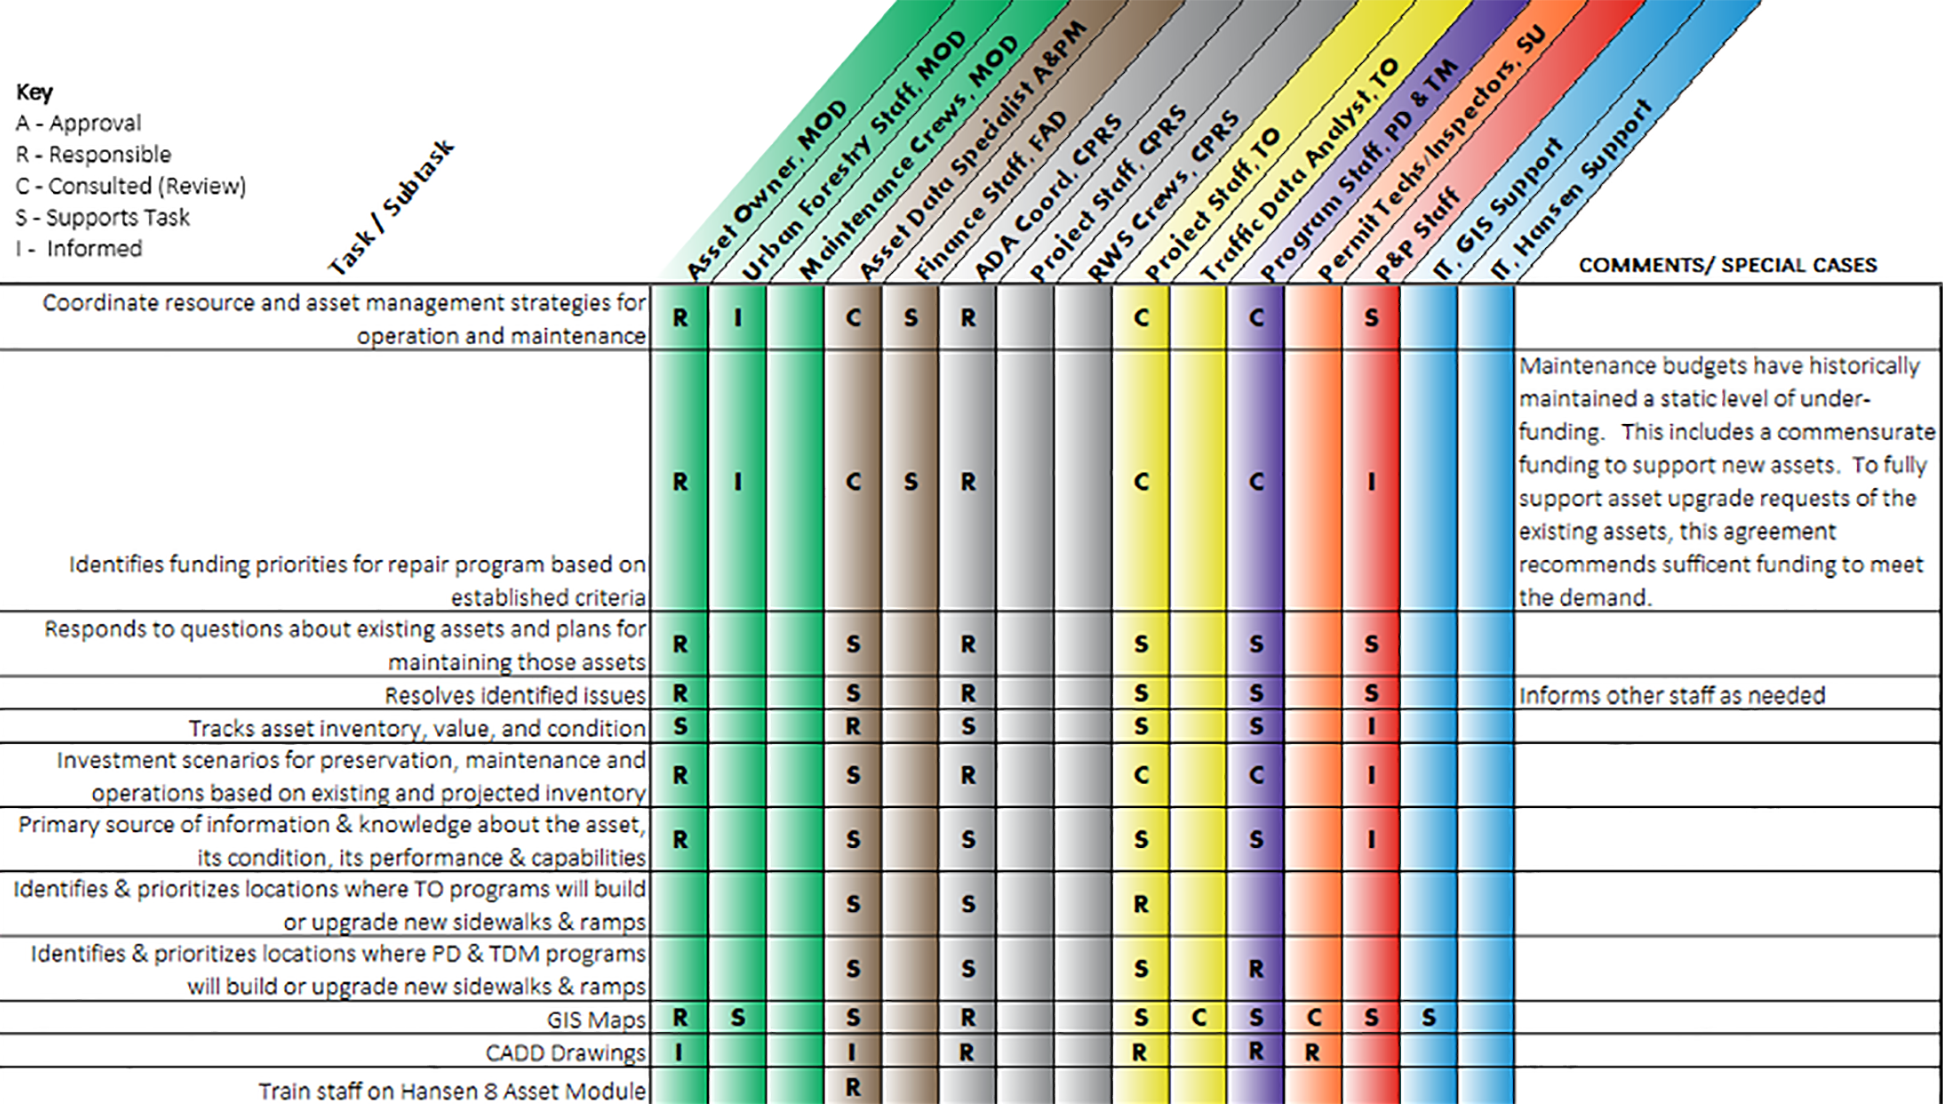
Source: City of Seattle. 2019.
Washington State DOT
The Washington State DOT recognized the potential safety risk to highway travelers and the adverse impact on regional commerce associated with unstable slope failure. To become more proactive in managing this risk, WSDOT developed the Unstable Slope Management System (USMS) that provides a method for evaluating known unstable slopes and using the information to prioritize slopes for funding of proactive stabilization efforts. The mitigation objective of the unstable slope management program is to sustain a desired state of good repair and low risk over the life span (> 20 years) of known unstable slopes and constructed geotechnical assets at the lowest practicable cost.
Bay Area Rapid Transit Authority (BART)
BART developed a Local Hazard Mitigation Plan in 2017 to reduce or eliminate long-term risks to human life and property related to hazards such as earthquakes, tsunamis, landslides, flood, sea level rise, wildfire, and drought. The analysis focused primarily on high-priority fixed assets such as passenger stations, substations, switching stations, train control rooms, shops/yards, ventilation structures, and emergency exits. These assets were prioritized based on criticality in terms of the impact of an asset failure on reliable and safe service capabilities. The Local Hazard Mitigation Plan details the potential impacts associated with each hazard type and presents prioritized mitigation actions that were determined by votes from the participating members of a Task Force Committee called the Emergency Preparedness Task Force Committee (EPTFC) that is made up of senior managers from all BART departments. The plan is updated at least once every five years. An example of the type of mitigation strategies that were developed are presented in the Figure below. The Plan has helped identify agency priorities that are being addressed and has fostered collaboration among different Departments to reduce potential hazards.
New Brunswick DTI
The New Brunswick Department of Transportation and Infrastructure (NB DTI) implemented Lean Six Sigma to better understand and document existing practices and identify where improvements could be implemented for savings or service improvement. The Lean Six Sigma methodology helps to improve performance through a collaborative process that systematically removes waste and reduces variation while improving customer satisfaction. For NBDTI, the application of this methodology has resulted in increased efficiency, cost savings, refined procurement methods, improvements to delivery of operational programs and services, and has supported the application of asset management decision-making to pavements, bridges, culverts, facilities and other transportation infrastructure.
Seattle DOT
The City of Seattle has a Sidewalk Safety Repair Program to oversee the maintenance of the City’s many sidewalks and curbs to keep them safe and accessible. The Program includes a process for monitoring sidewalk conditions, investigating complaints of unsafe or inaccessible sidewalks, determining repair responsibility (e.g.., adjacent property owner, City, or other utility), using existing conditions to proactively mitigate conditions (beveling and asphalt shimming), and permanently repairing sidewalks that are the City’s responsibility. Repairs are leveraged with other capital projects as much as possible, so coordination with other Divisions is vital to the effectiveness of the program.
Because of the number of Divisions involved in managing sidewalks, the City assigned roles and responsibilities in a RACI matrix, that identifies those with Responsibility (R) or Accountability (A), those that need to be Consulted (C), and those that need to be Informed (I). The RACI matrix developed by the City includes one additional role beyond the four that are commonly included in the matrix. The City of Seattle added an “S” to represent a support role for personnel who might provide information to the process but are not necessarily responsible for completing the activity. The RACI matrix has served the City well by clarifying the responsibilities of each of the Divisions involved in some aspect of the Program so the program looks seamless to the public, as shown on the City’s website (https://www.seattle.gov/transportation/projects-and-programs/programs/maintenance-and-paving/sidewalk-repair-program).
Excerpt From a RACI Matrix Developed by the City of Seattle for Managing Roles and Responsibilities for its Sidewalk Repair Program
Source: City of Seattle. 2019.