Topic: Communication
Communication
This page features information on communication, coordination, and sharing information. Whether you want to share data more effectively, communicate results to the public, or enhance departmental cooperation, you can find what you need here.
Overview:
Implementation Considerations:
Related Subsections:
Internal Coordination 3.2.1
Different business units in an agency contribute to the TAM process and are crucial to its success. Many TAM activities depend on internal agency coordination, including: drafting TAM policies that impact units throughout the agency; establishing performance targets for asset condition; developing the TAMP; and prioritizing projects and initiatives. The agency’s planning, programming, project development and delivery, maintenance, and other units must coordinate to make TAM work.
TAM-Related Committees
This section touches on the importance of internal coordination committees across the various TAM-related activities. The form of committees is directly related to the agency’s organizational model. These coordination committees are focused on coordination across functions. The coordination committees with important roles in TAM decision-making include:
TAM Steering Committee
This is a senior-level committee made up of top decision-makers. They provide strategic oversight for TAM and facilitate resourcing and organizational support for agreed-upon changes. They also make sure that the politics of any decision are considered. The How-to Guide Establishing a TAM Steering Committee provides steps to set up this function.
Asset Stewards Committee
This is a committee consisting of individuals with accountability for different asset. It provides a forum for getting agreement on standardized approaches, enabling a holistic view of the TAM program, communication about management practices, and discussions about coordinating project development and work planning.
Asset Data Governance Committee
This committee focuses on improving data for TAM. Its activities may include: coordinating asset data collection activities; developing standards to enable integration of data about different assets; monitoring and facilitating adoption of existing standards; establishing data quality management processes; and advancing investments in tools for field data collection, data analysis, reporting and visualization.
TAM Working Group
This group is composed of unit managers across the agency who deal with key aspects of the TAM process – planning, programming, delivery, maintenance, data management, communications, etc.
Coordinating across TAM committees is also an important function. Typically the TAM lead will make sure the activities of various TAM committees are coordinated. In some agencies, the governance across the committees are explicitly stated so that everyone understands who is doing what and how decisions across committees are related.
TIP
Forming a new set of committees to provide TAM coordination is not always the best approach. Some agencies can rely on their existing management structures. Others may already have committees set up to facilitate cross-unit communications. Smaller agencies may be able to rely on informal communication. What is most important is that the TAM program gets the results it seeks.
TIP
When forming a committee, it is important to limit the overall size of the committee to the smallest group needed to accomplish its objectives. Common practice is to limit committees to no more than 12 members.
New Jersey DOT
The New Jersey DOT TAM Steering Committee is comprised of NJDOT senior leadership. The committee sets policy direction and provides executive oversight for the performance management of the state highway system. The Transportation Asset Management Steering Committee provides general direction to the TAMP effort and assists in communicating the purpose and progress to other stakeholders.
New York State DOT
NYSDOT‘s TAM program is made up of a set of teams that perform TAM-related activities. They use TAM as an all encompassing set of principles that are embedded in activities they perform to make and deliver investments that provide mobility and safety to the traveling public. The TAM program coordinates inside the agency to ensure that TAM is being implemented as efficiently and effectively as possible. The following diagram illustrates the inter-relationships and communication that occurs across functional and geographic teams to make TAM work.
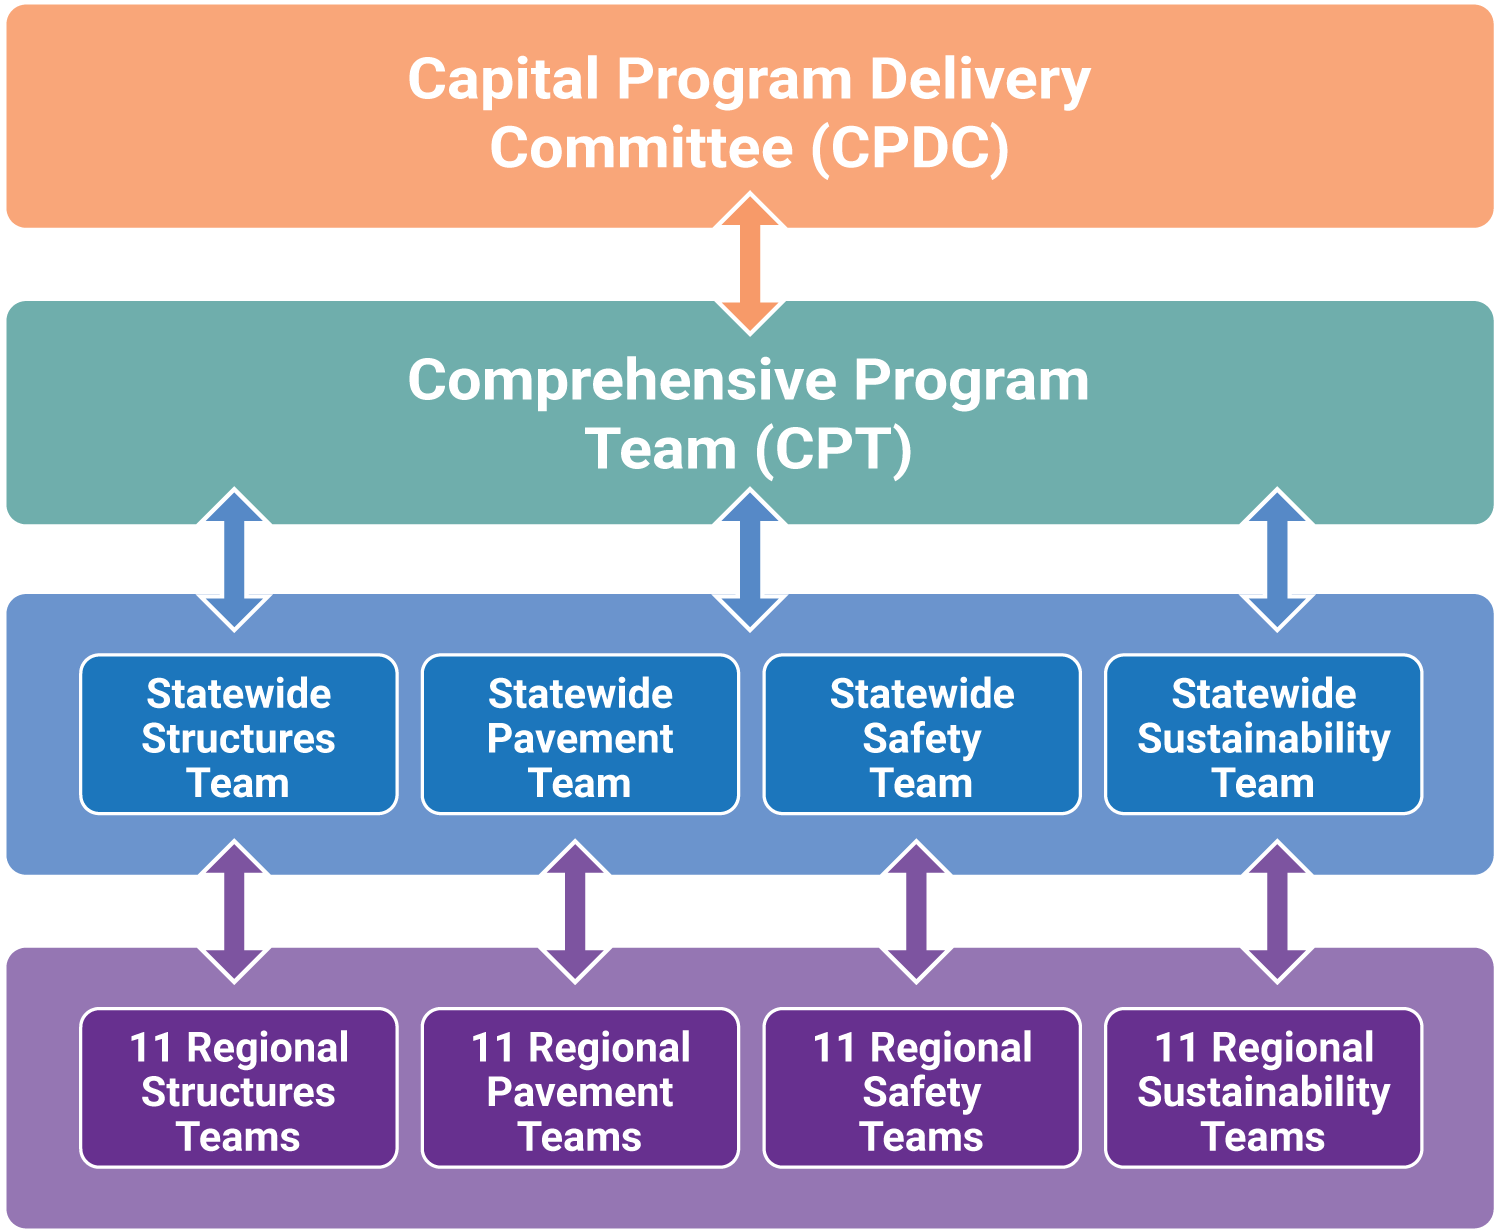
Source: Adapted from New York State Transportation Asset Management Plan. 2018.
Ohio DOT
The Ohio DOT Asset Management Leadership Team is a cross-disciplined team, with representatives from all major business units, that establishes data governance and data collection standards. A sub-group of the Leadership Team, the TAM Audit Group, is then responsible for overseeing all asset data related requirements, and making sure standards are in place and processes are followed. This group reviews and approves all data collection efforts and ensures that efforts are coordinated across the DOT. Having designated roles and responsibilities in regards to data governance and collection allows the agency to identify all potential customers of the data being collected and ensure that the data is sufficient to meet all relevant asset management needs.
The Ohio DOT deploys a hierarchy for managing TAM data collection.
- TAM data priority is established by the Governance Board (Assistant Directors)
- The Asset Management Leadership Team (AMLT), which is a cross-discipline team of representatives from all major business units, develop strategies and collaboration opportunities to achieve Governance Board directives
- The TAM Audit Group (TAMAG) perform business relationship management by working with data business owners, SMEs, and stakeholders to create enterprise TAM data requirements
- The Central Office GIS team utilizes the completed TAMAG business requirements to create data collection solutions
- The District TAM Coordinators provide oversight, support and coordination for data collection solution implementation, operations and performance
External Coordination 3.2.2
In order to deliver transportation products and services to the public, State DOTs must coordinate with other agencies that own and operate transportation facilities. Users don’t distinguish who owns what part of the transportation network, so it is up to the agencies to work together and seamlessly deliver the best results to users.
External Entities
Many entities outside of a state DOT are part of the TAM advancement process. It is important to include external partners in TAM committees. For example, many agencies will have a FHWA member on the steering committee, or a governor’s representative on the strategy committee.
Metropolitan Planning Organizations (MPOs)
MPOs carry out transportation planning processes and represent localities in urbanized areas. MPOs are mandated and funded by the federal government and help ensure that transportation planning in the region reflects the needs of the population. MPOs may be responsible for parts of the State’s NHS. It is a federal requirement to involve MPOs when planning or programming federal aid in metropolitan areas, so it is key to coordinate with these organizations when developing the TAMP.
Local Agencies
Local agencies include city and county agencies. These agencies have a stake in asset management initiatives as they often own various parts of the transportation network and have funding for transportation projects. They are also closely connected to the population in the region and thus have an understanding of the needed asset management-related investments.
Other State Agencies
Various aspects of asset management should include other state agencies. State environmental agencies can provide guidance on air quality and emissions. State information systems agencies can be important for obtaining tools or solutions on a TAM need. Statewide data management initiatives may also require close coordination between the state and the DOT.
Toll Authorities
Toll Authorities operate toll roads across the country to generate revenue for use in maintaining the road. Depending on the relationship between the DOT and the authority, the authorities may own the road, have data and information on the condition of the road, and information on the investment in maintenance over time. It is key to coordinate with the authority to obtain a complete picture of the assets in the state.
Other Modal Agencies
Other Modal Agencies include organizations that operate transportation modes that are not directly operated by the state DOT. These might include public transportation, airports, and marine-related functions. The DOT may have a financial relationship with these agencies for grant-related funding. The DOT will also work with these organizations to deliver the best trip for a traveler.
TIP
A Memorandum of Understanding (MOU) is an informal agreement on coordination between agencies or other organization. They are effective in clarifying roles and responsibilities between the two agencies and determining how decisions will impact business in the future. For example, informal data agreements often specify who is collecting what, how data is being provided, and what geographic network is included.
Legislative and Oversight Bodies
The governor, transportation commission, and state legislative bodies help determine the funding allocations for each state. It is good practice to coordinate with these entities to ensure they understand the importance of asset management and the need for continued DOT funding.
USDOT and its modal agencies such as FHWA, FTA, and FAA also play a role. The FHWA has state division offices that are the conduit through which states receive federal funding.
Cross-Agency Committees/Councils
Most states have a complex network of agencies that own pieces of the road network in the state. Having a committee or council focused on coordinating TAM policies, pooling resources for tools and methods, and sharing lessons learned can increase the efficient delivery of transportation to customers. This approach can work for geographic regions that cross state boundaries.
General Public
DOTs work with the general public during the planning, programming, and project delivery process. The general public represents the customer that the DOT is ultimately serving with its transportation products and services.
Michigan DOT
One way to coordinate and collaborate across external agencies is to establish a statewide council. Michigan’s Transportation Asset Management Council (TAMC) coordinates TAM at the statewide level. It consists of 10 voting members appointed by the state transportation commission. The transportation asset management council shall include two members from the County Road Association of Michigan, two members from the Michigan Municipal League, two members from the state planning and development regions, one member from the Michigan Townships Association, one member from the Michigan Association of Counties, and two members from the Michigan Department of Transportation. (https://www.michigan.gov/tamc).
In addition, Michigan formed the Michigan Infrastructure Council to: coordinate work beyond transportation assets such as water and communication assets; develop the statewide asset management database, and facilitate the data collection strategy for assets (https://www.michigan.gov/mic/).
Stakeholder Engagement
Stakeholder engagement is another mechanism for coordination. External stakeholders can be partners the agency works with to deliver TAM benefits, and they can also be customers who use the transportation system. Keeping stakeholders informed and engaging them to understand TAM can lead to their support for funding initiatives and their understanding of tough decisions where services may be cut.
Communities of Practice
Communities of Practice (COP) can be used to coordinate with external stakeholders and partners. For example, these communities could be organized across the various asset owners within a region or state to achieve a comprehensive view of TAM. This is a good way to meet MAP-21 requirements and communicate a view of the NHS.
TIP
Public-Private Partnership (P3) Concessionaires are entities that are much more common in international settings. They are not used extensively in the US. When they are involved, it’s important that the performance measures that are being applied to them match the TAM policies and procedures.
New Zealand Transport Agency
Many non-United States organizations have integrated asset management not only within internal organization processes, but also in frameworks that integrate external expertise to assist in infrastructure management. The New Zealand Transport Agency clearly establishes the roles and responsibilities of agency stakeholders and documents the annual transportation planning processes and management practices it employs. This helps the agency manage and deliver the road network, add transparency, and allow resources (other levels of government, consultants, contractors, and other stakeholders including the public) to participate in the process. In this way, it integrates internal and external coordination between stakeholders in the asset management process.
Colorado DOT
The CDOT TAM and Performance Management unit works very closely with the Colorado Transportation Commission, which represents all of the geographic regions in Colorado. Each member of the commission is appointed by the governor and confirmed by the state senate. The commission meetings are open to the public so that all customers of the state’s transportation system are welcome to attend. This promotes participation and transparency between the DOT and its customers. The meeting agenda and materials are available on a website that CDOT manages (https://www.codot.gov/about/transportation-commission/). In the past, the Commission had a designated TAM subcommittee, but due to the priority of TAM, it is now an integral part of the full Commission’s regular business and no longer a subcommittee.
Communication 3.2.3
Strong communication helps TAM implementation programs progress with momentum and helps maintain awareness among all stakeholders. This includes the production and delivery of strong communication products that highlight TAM performance and benefits. An agency should consider a variety of tactics to communicate effectively on all fronts.
Formal and Informal Communications
Agencies with well-planned communication strategies tend to employ a range of techniques to successfully advance TAM awareness and knowledge-sharing. These techniques can be categorized broadly into two groups, formal and informal communications, with distinct characteristics.
Formal communication often provides the stimulus for informal communication. Communication strategies for TAM programs that embed aspects of both types of communication tend to be more successful. Understanding the relative importance of both communication types is important in promoting awareness and knowledge about TAM within an organization.
Utah DOT
When meeting with legislators, the UDOT CEO uses the agency’s Strategic Directions Dashboard on a tablet device to communicate TAM-related information. He is able to quickly respond to questions and show information in a way that is easy to understand. The dashboard shows how UDOT is investing funds allocated by the Utah State Legislature. UDOT has taken advantage of the latest in online technology to provide a live, data- and performance-driven report that is constantly updated to reflect how they are reaching their strategic goals.
Communications Mechanisms
TAM Webinar #37 - Communicating the TAMP and Stakeholder Engagement
Audience-Centric Communication
Holistic communication is about understanding and structuring communication to achieve the best results. This is not always an easy proposition, as effectively communicating a message can be described as changing another person’s perception of an idea. One of the keys to successfully getting desired communication results is knowing the target audience and providing the right communication mechanism.
TAM Communications
Mechanisms
There is a broad range of communication mechanisms available for use, and selecting the right one will increase the likelihood of success. Once the audience is identified it is worthwhile to consider the communication style that the audience would best respond to (verbal, experiential, visual or written), what media or social media platforms they have access to, and whether an interactive environment is appropriate.
TIP
The content of your communication can be just as important as the person delivering the message. Consider how the audience will respond to the messengers selected to deliver the TAM communication.
Table 3.4 - Comparing Formal and Informal Communication
| Basis for Comparison | Formal Communication | Informal Communication |
|---|---|---|
| Meaning | Communication done through predefined channels set by the organization. TAM programs commonly use formal channels for cyclical reporting of performance, or engagement strategies to advance improvement projects. | The interchange of communication stretches in all directions and is uncontrolled. TAM programs commonly create change that manifests informal communication as people are experiencing the change. If managed carefully, it can help advance buy-in and increase the authenticity of program merits. |
| Otherwise known as | Official communication | Grapevine communication |
| Advantages | Timely and systematic flow of information. TAM communication strategies help agencies identify the message, timing and dissemination aspects of formal communication. | Efficient because the information can flow quickly and focus will be personal to the individuals. TAM program champions and advocates need to monitor informal communication and provide feedback to help refine messaging in official channels. |
| Disadvantages | More expensive and challenging to communicate personally to individuals and ensure understanding. More agencies have existing communication resources that can be leveraged. However, some consideration of targeted messaging to TAM stakeholders may require adjustments to existing channels. | Difficult to maintain secrecy and stop misinterpretation. Transparency and consistency in messaging about the TAM programs’ expected benefits and expected implementation timings helps avoid these disadvantages. Should establish feedback mechanisms where there is anticipated risk of resistance to the TAM program. |
| Evidence | Generally written with recorded distribution. This can be useful as a historical timeline, as improvement is tracked over time. TAM implementations take time to make gains. Also good to have a record of past communication that reveals incremental improvement that is not apparent unless assessed over a longer time horizon. | Often no documented evidence of communication. Anonymity can be an advantage to receiving honest feedback about how the TAM program needs to adjust to advance improvement initiatives. Necessary to monitor informal channels to gain insights unavailable in formal channels. |
| TAM Example | TAMP, Data Reporting, Performance Reporting, Program Updates. | Peer-to-peer interactions discussion about progress, informal discussion driven by increased awareness and training. |
TIP
Agencies can choose both formal and informal communication based on the situation Select the best approach for your agency based on your culture and context.
TAM Webinar #25 - TAM Communication
Table 3.5 - Overview of TAM Communication Mechanisms
| Mechanism | Considerations (Pro: +, Con: -) | Internal TAM Examples | External TAM Examples |
|---|---|---|---|
| Reports | + Opportunity to provide detailed information the reader can digest in their own time + Formal communication that is a statement of a position at a defined time. - Can be hard to get feedback | TAMP Annual State of the Infrastructure Report |
|
| Websites, Social media, and Push/Interactive notifications | + Highly interactive + Reaches many people quickly - Feedback is “public” and takes time to manage - Technology may not be accessible to all | Dashboard on internal metrics | Dashboard for performance reporting Consultation and feedback on service delivery |
| Brochures/ Post cards, Newsletters | + Enables simple messages to be clearly communicated + Internal newsletters can be used to inform and engage a broad audience - Can be expensive to produce (in physical form) - Not suitable for getting feedback | Quarterly updates on improvements/ achievements in TAM | Post cards on upcoming asset improvements |
| Presentations, Training | + Opportunity to interact and gather feedback + Opportunity for listeners to learn through experiencing - Requires significant time commitment from participants - Good for a few specific individuals, but challenging to influence more than a few | Formal training Focused status reporting to top management | Community meetings on upcoming asset improvements |
| Videos | + Enables simple messages to be clearly communicated + Can quickly share information to broad audience + Opportunity for leadership to be involved in reinforcing a message - Can be hard to get feedback - Can be time consuming to develop |
TIP
A well-crafted communications plan will empower individuals or units within the agency to communicate. While this may require establishing some standards, limits, or constraints, the focus of the plan should be on providing tools and guidance to promote effective communication.
Region of Waterloo (Ontario)
To assist in the implementation of a new Work Management and Decision Support System, the Region Water Services Division considered decision-making and needs across the organization, and communicated asset management system needs to the Division based around the people that would use the system. The Region created targeted communication tools that reinforced the vision of how asset management might impact people within their various roles in the organization.
By involving people in their current roles as examples, the tools reinforced how asset management frameworks are integrated within their existing work processes and what roles they play within the asset management process. They also highlighted the benefits of the change and how it would impact individuals personally across the organization. As the asset management system evolves through continuous improvement, so too does the need to find effective methods of communication and engagement.
Ohio DOT
Taking Care of What We Have: A message that defines the benefits that TAM brings through tangible examples that are linked to the DOT objectives. Ultimately this inspires confidence in the approach and the TAM decisions being made.
Video: https://youtu.be/B6jZJQBvpc0
Georgia DOT
The Georgia DOT TAMP, published in 2014, included a communication plan to promote awareness of TAM and communicate the benefits of TAM practices. The communication plan highlights the goals and target audiences of communication and includes the key messages that are intended to be conveyed through various means. The main element of the communication plan is a table that lists the audience, communication strategies, and timeframe for the particular strategy. For example, in the near term the agency wants to have one-on-one meetings with members of the State Transportation Board regarding TAM priorities in their respective districts. Finally, the communication plan also contains brief measurement tools to gauge the reach and effectiveness of the communication efforts.
VTrans
Formal and informal communication can travel both upwards and downwards within an organization. Those responsible for TAM at VTrans proactively manage communication where it is practical to do so. When seeking to inform or influence senior leadership, VTrans’ TAM program conveys not only the opportunities and impacts of funding decisions to decision-makers, but also provides context to foster informed choices. The TAM program builds support for the implementation, and elected officials and top management benefit from better context when TAM communication focuses on:
- Understanding current and future performance and how it affects state strategic priorities – How does asset performance influence agency objectives? For example, reducing the amount of bridges with an NBI rating of 1-3 needs to be related back to how freight movement, and economic indicators, can be improved.
- The impact of decisions – What will be achieved with additional/reduced funding or reduced restrictions on expenditure? With the use of life-cycle analysis and reporting of investment strategies, the TAM program can communicate the financial impact of different decision-making.
- The benefit of TAM – Report progress and how program successes are made relevant and advance agency objectives. These benefits are best articulated in terms that are understood by all throughout the organization, e.g. journey time savings/ reliability, and dollars saved. Communication about benefits also can confirm the benefit/implementation of previous decisions, and increase awareness of the success of “we did what we said we would”.
- Continual Improvement – What VTrans’ next TAM improvement will be and the benefit this will provide. Communication like this shows that the TAM program is heading in the right direction rather than continually being told to investigate/consider changes that may distract from strategic pursuits.
VTrans focuses on communication that reinforces confidence in TAM decision-making, to bolster stakeholder belief that the additional dollar invested will be spent in the right place at the right time. The agency also hired a communications consultant to help them develop engaging graphics to communicate critical and complex asset management principles into common, “every-day” storylines and language, transforming their AM approach and their TAMP into a product message that is easy to understand and digest.
Understanding the Organization 3.3.2
Transportation agencies must implement changes when adopting new asset management practices at the strategic, tactical and operational levels. TAM programs commonly focus on the changes required and less on how to successfully implement the change. Understanding the potential challenges and learning how to use the agency’s support mechanisms are essential to advancing TAM improvements within the agency.
Building a TAM Organization
Agency leadership and TAM program man¬agement have extra roles to play as communicators, advocates, mentors and change agents. They may require extra tools to help them fulfill their roles, and even to cope with the TAM initiated changes.
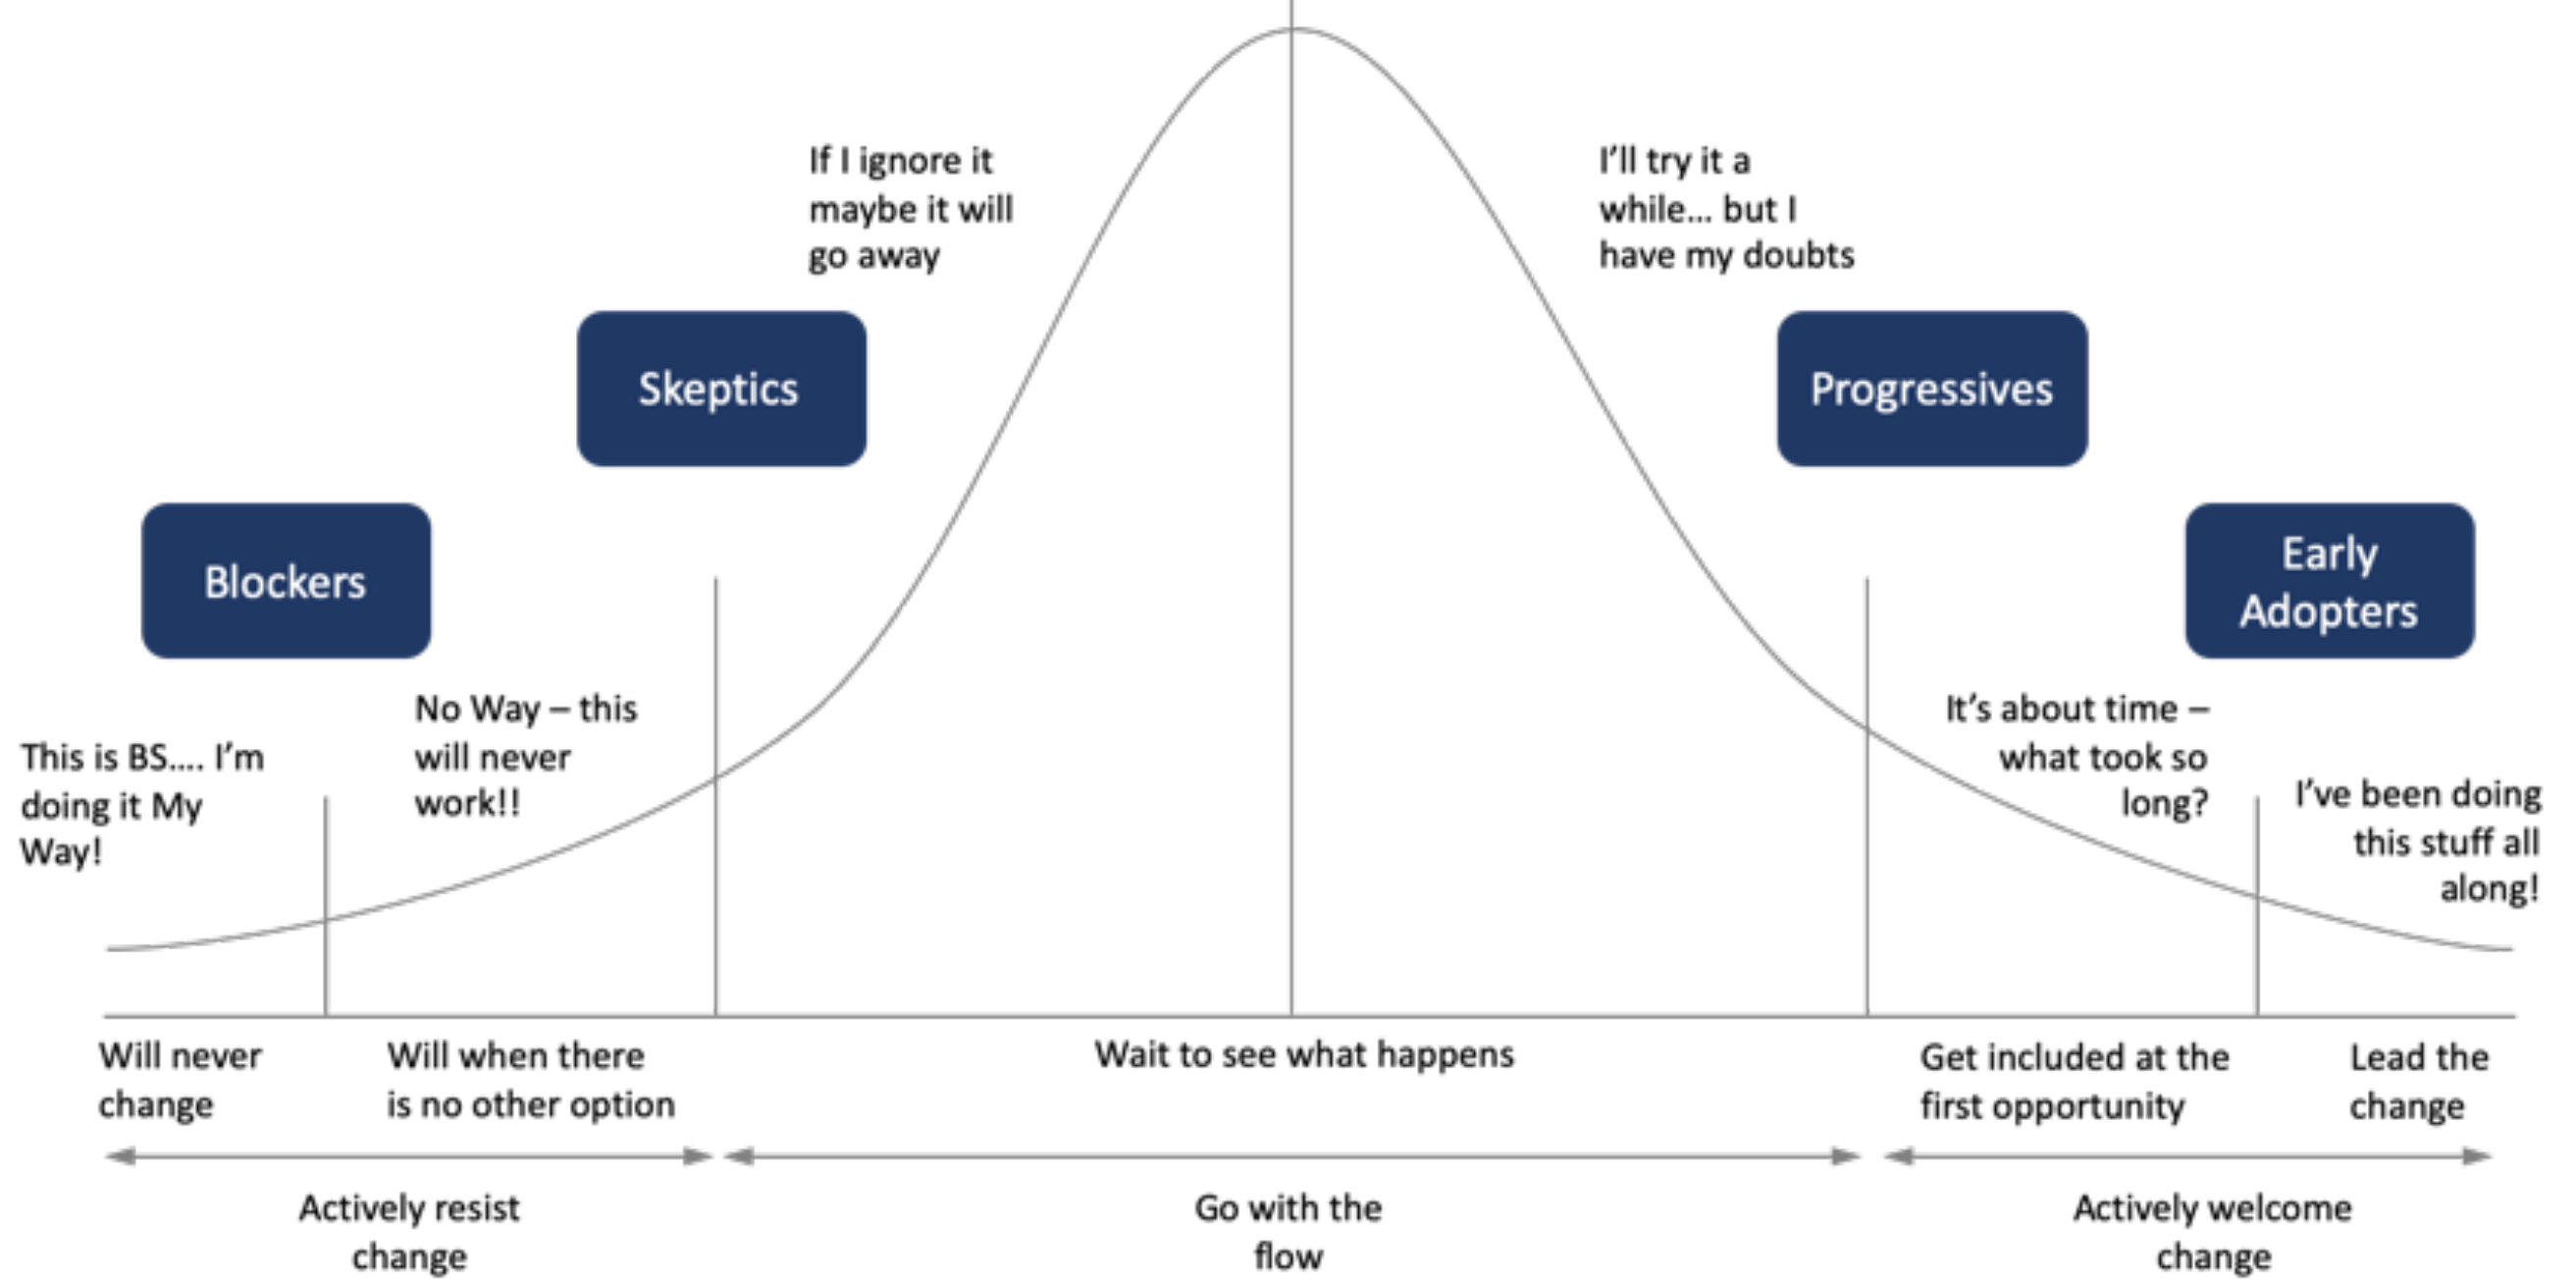
People tend to have similar reactions to any change that will challenge the status quo. Those in favor of the TAM program changes, or those more adaptable to change, may more quickly move through the process of transitioning to new and improved ways of doing things. Figure 3.2, An individual’s response when presented with change, illustrates the range of receptivity to change and how to understand it so that it can be planned for.
TIP
Implementing TAM or improving TAM business processes involves changing the way the agency conducts business. It involves people, processes, and/or technology. TAM improvement is a change process so it should involve change management techniques.
Managers need to be equipped to advance more quickly so they can fulfill their support role successfully, even while they themselves are experiencing the effects of the changes the asset management program is implementing.
Figure 3.2 An individual’s response when presented with change
Managers need to be equipped to advance more quickly so they can fulfill their support role successfully, even while they themselves are experiencing the effects of the changes the asset management program is implementing.
Asset Management Early Adopters
These are members of the organization who are already prepared to adopt asset management best practices, have been advocating for it in the past and are ready to see the change happen.
What They Need
- Communication channels that are targeted to manage expectations and minimize frustration
- Pilot projects that have good asset data, and can better model and inform tactical and strategic decision-making
- Opportunities to showcase early wins in the TAM transition
Asset Management Progressives
Asset management progressives are predis¬posed to see TAM as a change for the better. They see asset management as a good idea, are willing participants in the change, but need to understand the objectives and what the future will look like.
What They Need
- Communication channels that report on progress and highlight expected future improvements
- Training and reinforcement that emphasizes how they can help implement the change and how their own role may change
Asset Management Skeptics
Skeptics are predisposed to see TAM as a change for the worse. They are wary of proposed changes, and feel existing processes are effective and do not need to be “fixed.” Messaging targeted to (or delivered by) Progressives will alienate this group and increase resistance.
What They Need
- Much more detail on how the TAM Program will be implemented and why the change is necessary
- Process mapping and other group activities that highlight where problems exist
- Once they are convinced that change is required, they will benefit from training
Asset Management Blockers
TAM Blockers are strongly attached to existing processes and will resist change. These individuals will take the longest amount of time to adjust. Some may never be able to make the change, and may choose to leave the agency if the change is implemented.
What They Need
- Understanding of the root cause of their resistance, which may be related to a loss of control, status within the agency, or loyalty to past managers or staff
- Communication targeted to help them realize that TAM Program improvements within the agency are necessary.
- Activities or celebrations that recognize and acknowledge the foundational aspects of past good work over the agency’s history
New Brunswick DTI
Despite a long history and legacy of existing practices and a strong internal institutional resistance to change, New Brunswick Department of Transportation and Infrastructure (NB DTI) implemented Lean Six Sigma to better document existing practices and identify where improvements could be implemented for savings or service improvement. This helped advance and effect change. Over time, the program included increased efficiency, cost savings, refined procurement methods, and application of asset management decision-making to pavements, bridges, culverts, facilities and other transportation infrastructure. The use of methodologies like Lean Six Sigma can aid agencies with a focus on change management.
Michigan DOT
When introducing a Maintenance Rating System, Michigan DOT (MDOT) started the change management process early in the project. Agency leadership was consistent and passionate throughout the project. The process was developed with involvement from individuals within each Region, including people in leadership as well as those on maintenance delivery teams. These discussions identified opportunities for consistency and enabled development of a system that represented actual performance and decision making.
The Maintenance Rating System was piloted within one Region that was most proactively seeking the information that the system provided. This enabled any kinks to be ironed out in the system and also developed individuals within MDOT who could train their peers in the system, results, analysis and opportunities for decision making. It also provided data that enabled the Regions to learn from the results, make a change in investment and improve the maintenance level of service delivered. The rating system was named the “Michigan Maintenance Rating System (MiMRS).”
During implementation MDOT identified a specific roles for coordinating and driving the system, and identified individuals within each Region that had shown interest in the system and competency in analytical assessment to be part of a user group to share knowledge and disseminate information. MDOT also shared the results and news stories internally to enable peer comparison and drive consistency. Leadership identified specific funding for projects developed based on the maintenance rating system results.
This process change was part of a broader MDOT approach to Performance Based Maintenance that included implementing a new inventory and maintenance management system. Performance Based Maintenance will enable MDOT to better understand their assets, the cost of maintenance and the cost to make improvements to asset functionality. The goal of Performance Based Maintenance at MDOT is to achieve a needs-based budgeting approach to non-winter maintenance and enable better decision by supervisors and management.
Designing Effective Reports and Visualizations 7.3.1
A wide variety of reports, maps, charts and infographics can be produced to convert raw data into actionable information. Designing effective reports and visualizations begins with a good understanding of who will be consuming the information, what their questions are, and what key messages the agency wants to communicate.
TAM Webinar #45 - TAM Communication and Visualization
Different types of information users for asset data and sample questions they may have are shown in Table 7.4. This can be used as a starting point for identifying what types of reports and visualizations should be created. Keep in mind that increasingly, reports and visualizations are not static – they include multiple options for filtering, sorting and navigating information.
Some reports/visualizations are primarily for analysis, exploration and insight; others are primarily for communication. Some may be designed for both purposes. Those designed for analysis should emphasize flexibility – with multiple options for viewing, filtering, sorting, and exporting to various formats. Those designed for communication should emphasize simplicity and clarity of message; and clean, aesthetically pleasing design. They should reflect what the agency wants people to learn or know.
All reports/visualizations should include information that helps the user to understand:
- the sources of the data being presented and the effective date for the data (e.g. what calendar year is represented)
- the assumptions used for any calculated items
- definitions of any acronyms or potentially unfamiliar terms
- who to contact for further information
A wide array of tools and techniques are available for reporting and visualization – tabular reports, maps, charts, dashboards, infographics, and combinations. GIS is an essential visualization tool with many applications and can be integral to information presentation. While some visualizations can be produced using standard office applications, many agencies use desktop publishing and business intelligence offerings. There are several general resources available on design of effective visualizations – see the reference list at the end of this chapter. Chapter 6 contains additional examples of data visualizations.
Table 7.4 Information Needs of Different Users
| User Type | Sample Questions | Types of Reports/Visualizations |
|---|---|---|
| Analyst | Are the asset locations in this new inventory valid? | Map showing asset locations Report listing asset locations outside of the ranges of valid route-milepoint/mileposts. |
| Analyst | Are the observed changes in asset condition from the last inspection reasonable? | Time series plot/grid of asset condition + intervening project/maintenance activities |
| Analyst | What is the expected service life for asset X? What are the key factors impacting service life? | Minimum, maximum, mean, median life for selected asset type – with breakdowns by subtype (e.g. concrete versus asphalt pavement), last treatment, geographic region, road class. Map of assets with low (e.g. 25th percentile) lives with available information on contributing factors (e.g. reported drainage issues, soil quality, materials, contractor, use of road salt, etc.) |
| Asset/Maintenance Manager | What is the state of my asset(s)? | Fact sheet showing inventory, condition distribu- tion, age distribution, value, performance projec- tions and targets (if applicable) |
| Asset/Maintenance Manager | Which assets should be considered for treatment? | Map and listing of assets showing condition information and (if available) assigned treatment need – overlaid with programmed work. Drill down to condition and work detail. |
| Asset/Maintenance Manager | What should I budget for preventive maintenance? | Report showing asset quantities, unit cost for preventive maintenance, planned maintenance interval, and average annual cost over 5 year period. Separate report to inform selection of a unit cost – historical cost per unit of work or historical labor/ equipment/materials utilization per unit of work. |
| Project Engineer | What assets are within the footprint of a project I am scoping? | Listing of assets and associated quantities for a defined location (route/from MP, to MP) |
| Project Engineer | Are there opportunities to coordinate work? | Map showing identified needs, proposed projects, programmed projects. |
| Executive | What have we been spending to maintain our assets? | Time series chart showing expenditures with breakdown by asset type, work type (maintenance versus capital), district/region. Display asset quantities and conditions on same time scale to compare expenditures against results. |
| Executive | What is our backlog of needs? | Chart showing current needs backlog for selected assets – with available breakdowns by district/ region, road class, asset type. Accompanying chart showing 5-10 year changes in backlog and projected backlog given revenue and funding allocation assumptions. |
| Executive | How do asset conditions compare across districts/regions? | Infographic showing asset condition (Good-Fair-Poor) bar charts superimposed on map of districts/regions. |
| Executive | How should we allocate our available funding across different assets/ projects? | Charts showing results of investment versus performance analysis Charts showing allocation and performance results of a prioritization exercise with drill down to prioritized project lists. |
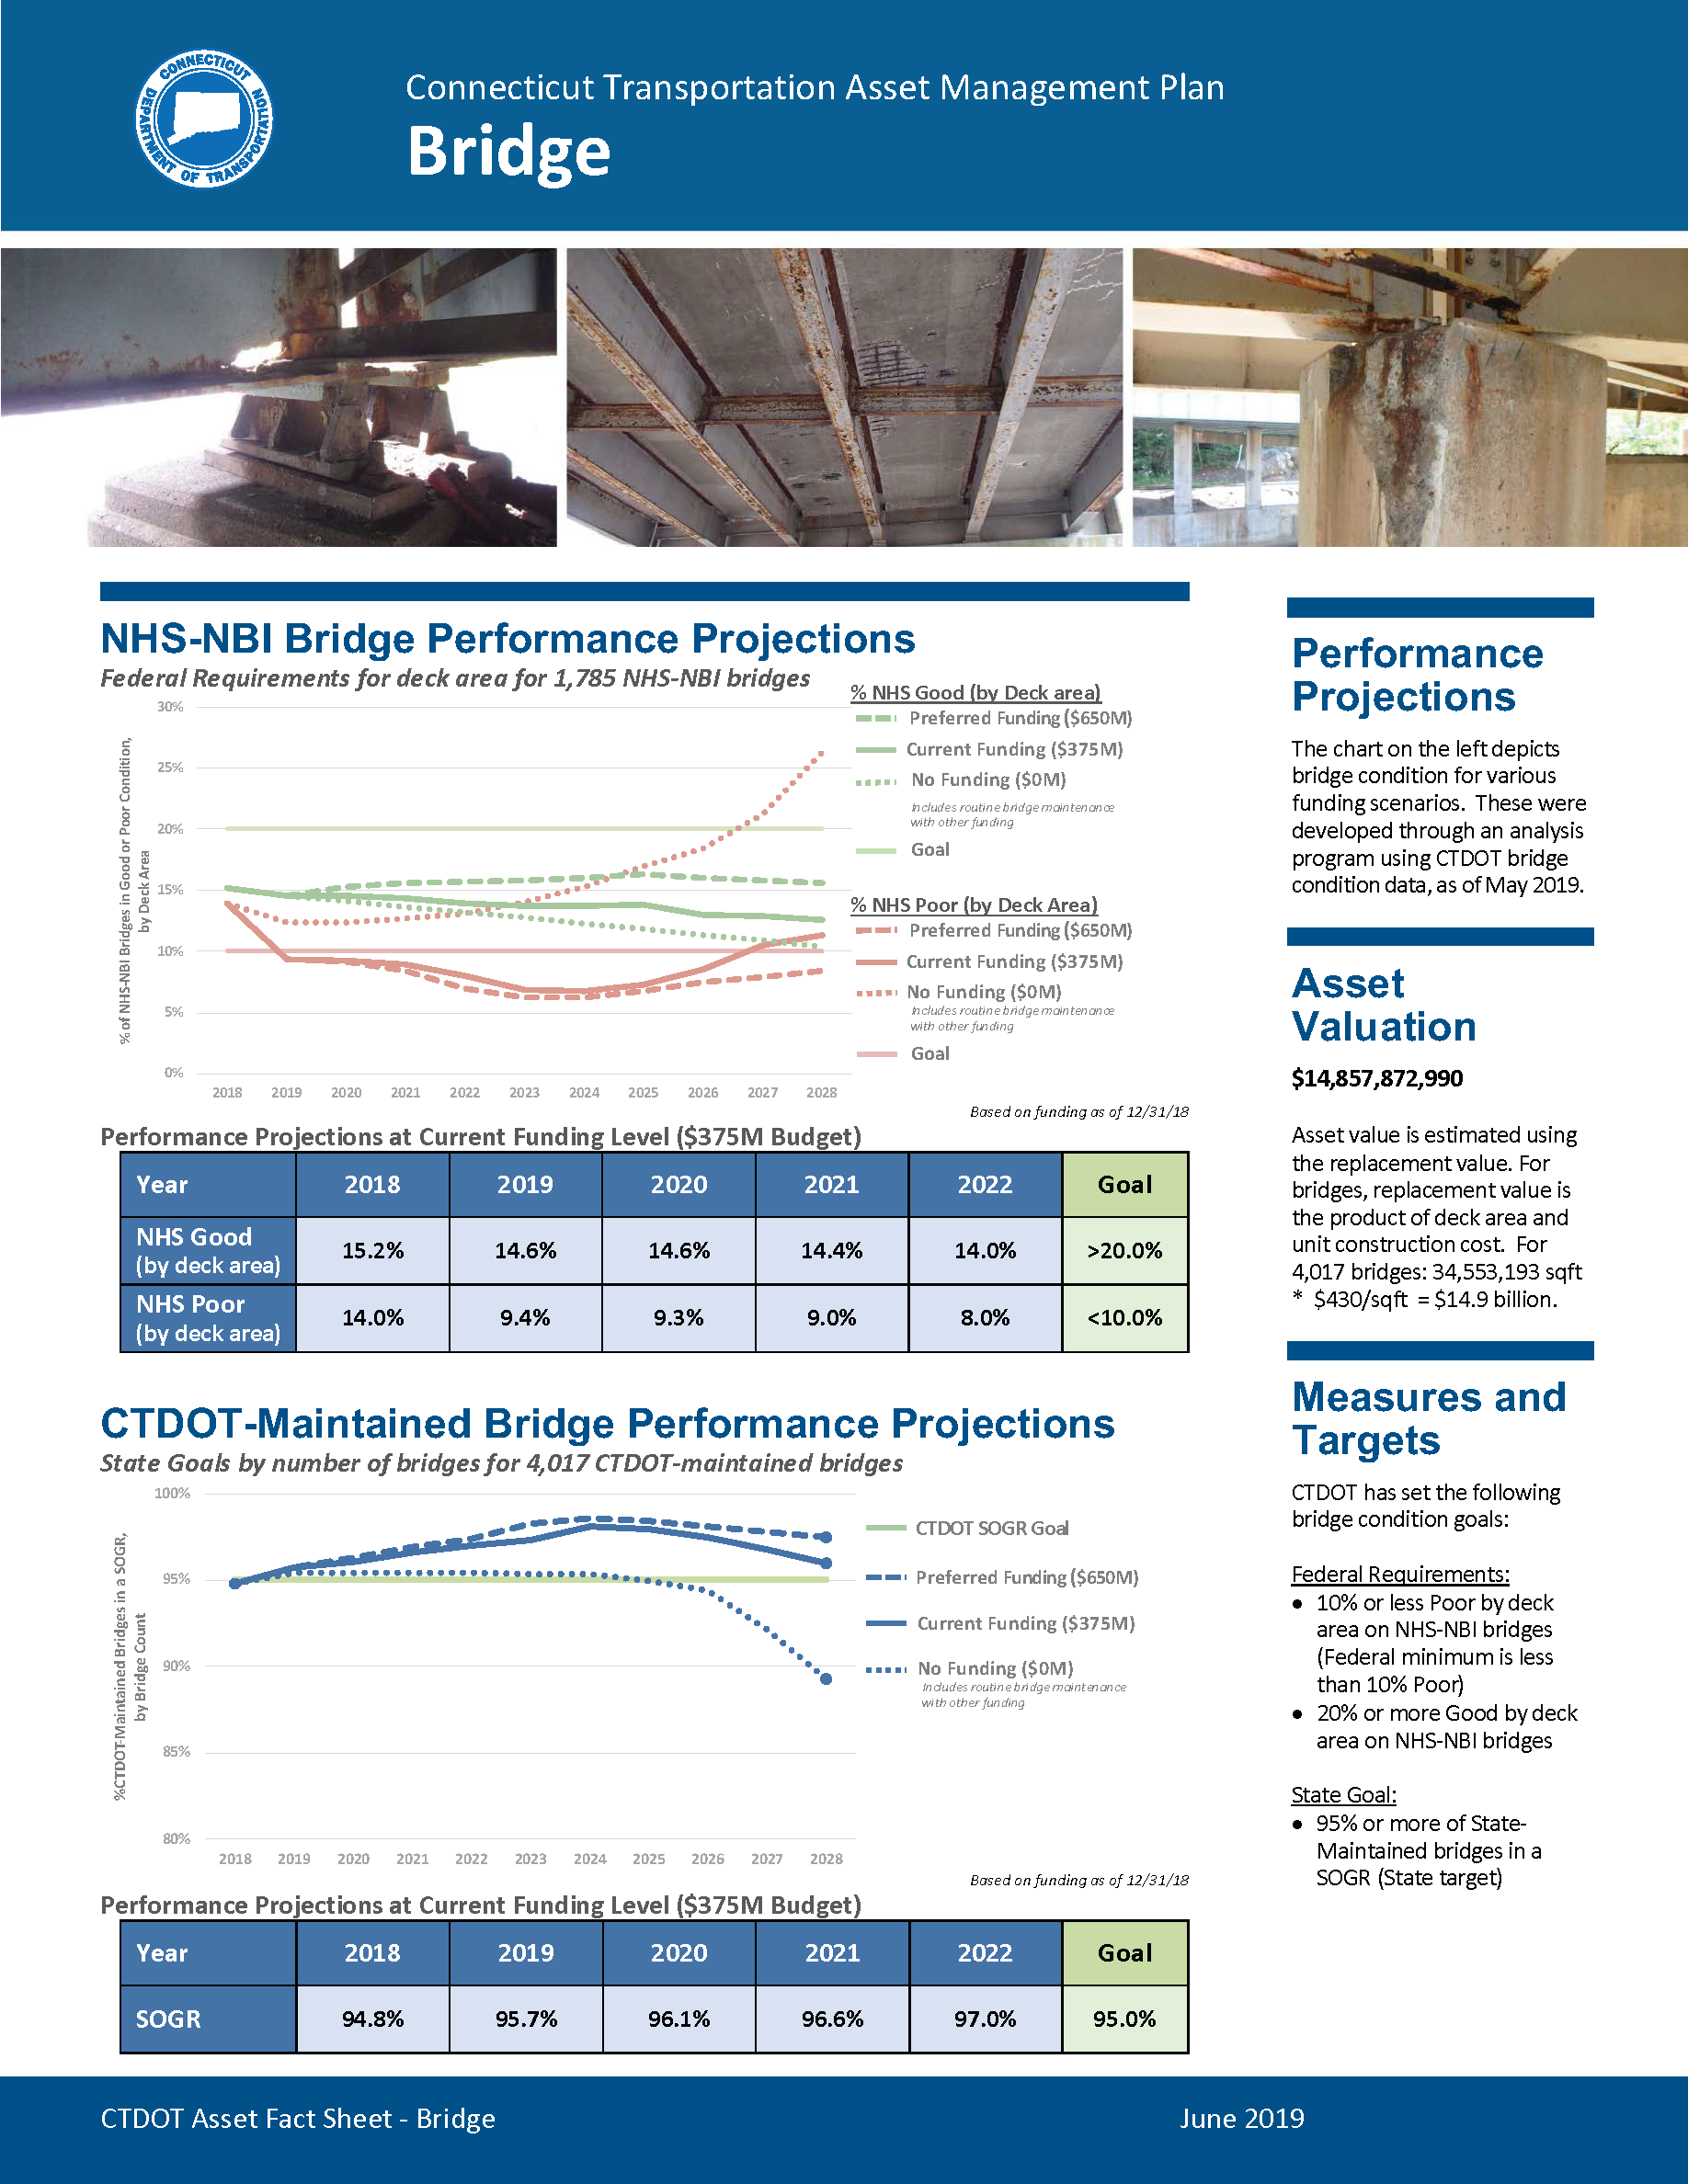
| Funding/Oversight Agency (State/Federal) | How does the current and projected asset condition compare to the established target? | Trend line showing current and projected conditions under different funding scenarios with separate line for target. |
| Funding/Oversight Agency (State/Federal) | How do the actual pavement and bridge program accomplishments compare to those that were planned? | Chart showing planned, actual, percent difference and explanation. |
| General Public | When will my street be paved? When will the bridge replacement project be completed? How is the DOT using its funding? | Map showing programmed projects with status/ schedule/funding information |
Connecticut DOT
To complement the Connecticut TAMP, Connecticut DOT (CTDOT) developed a series of asset Fact Sheets providing at-a-glance summaries of asset inventory and condition, State of Good Repair definitions, performance projections, targets and asset valuation for bridges, pavements, and five additional assets included in the TAMP. The asset Fact Sheets pair simplified graphs and other information displays with supporting contextual detail; a format that helps communicate CTDOT’s TAM approach to policy makers, executives, and other non-technical stakeholders.
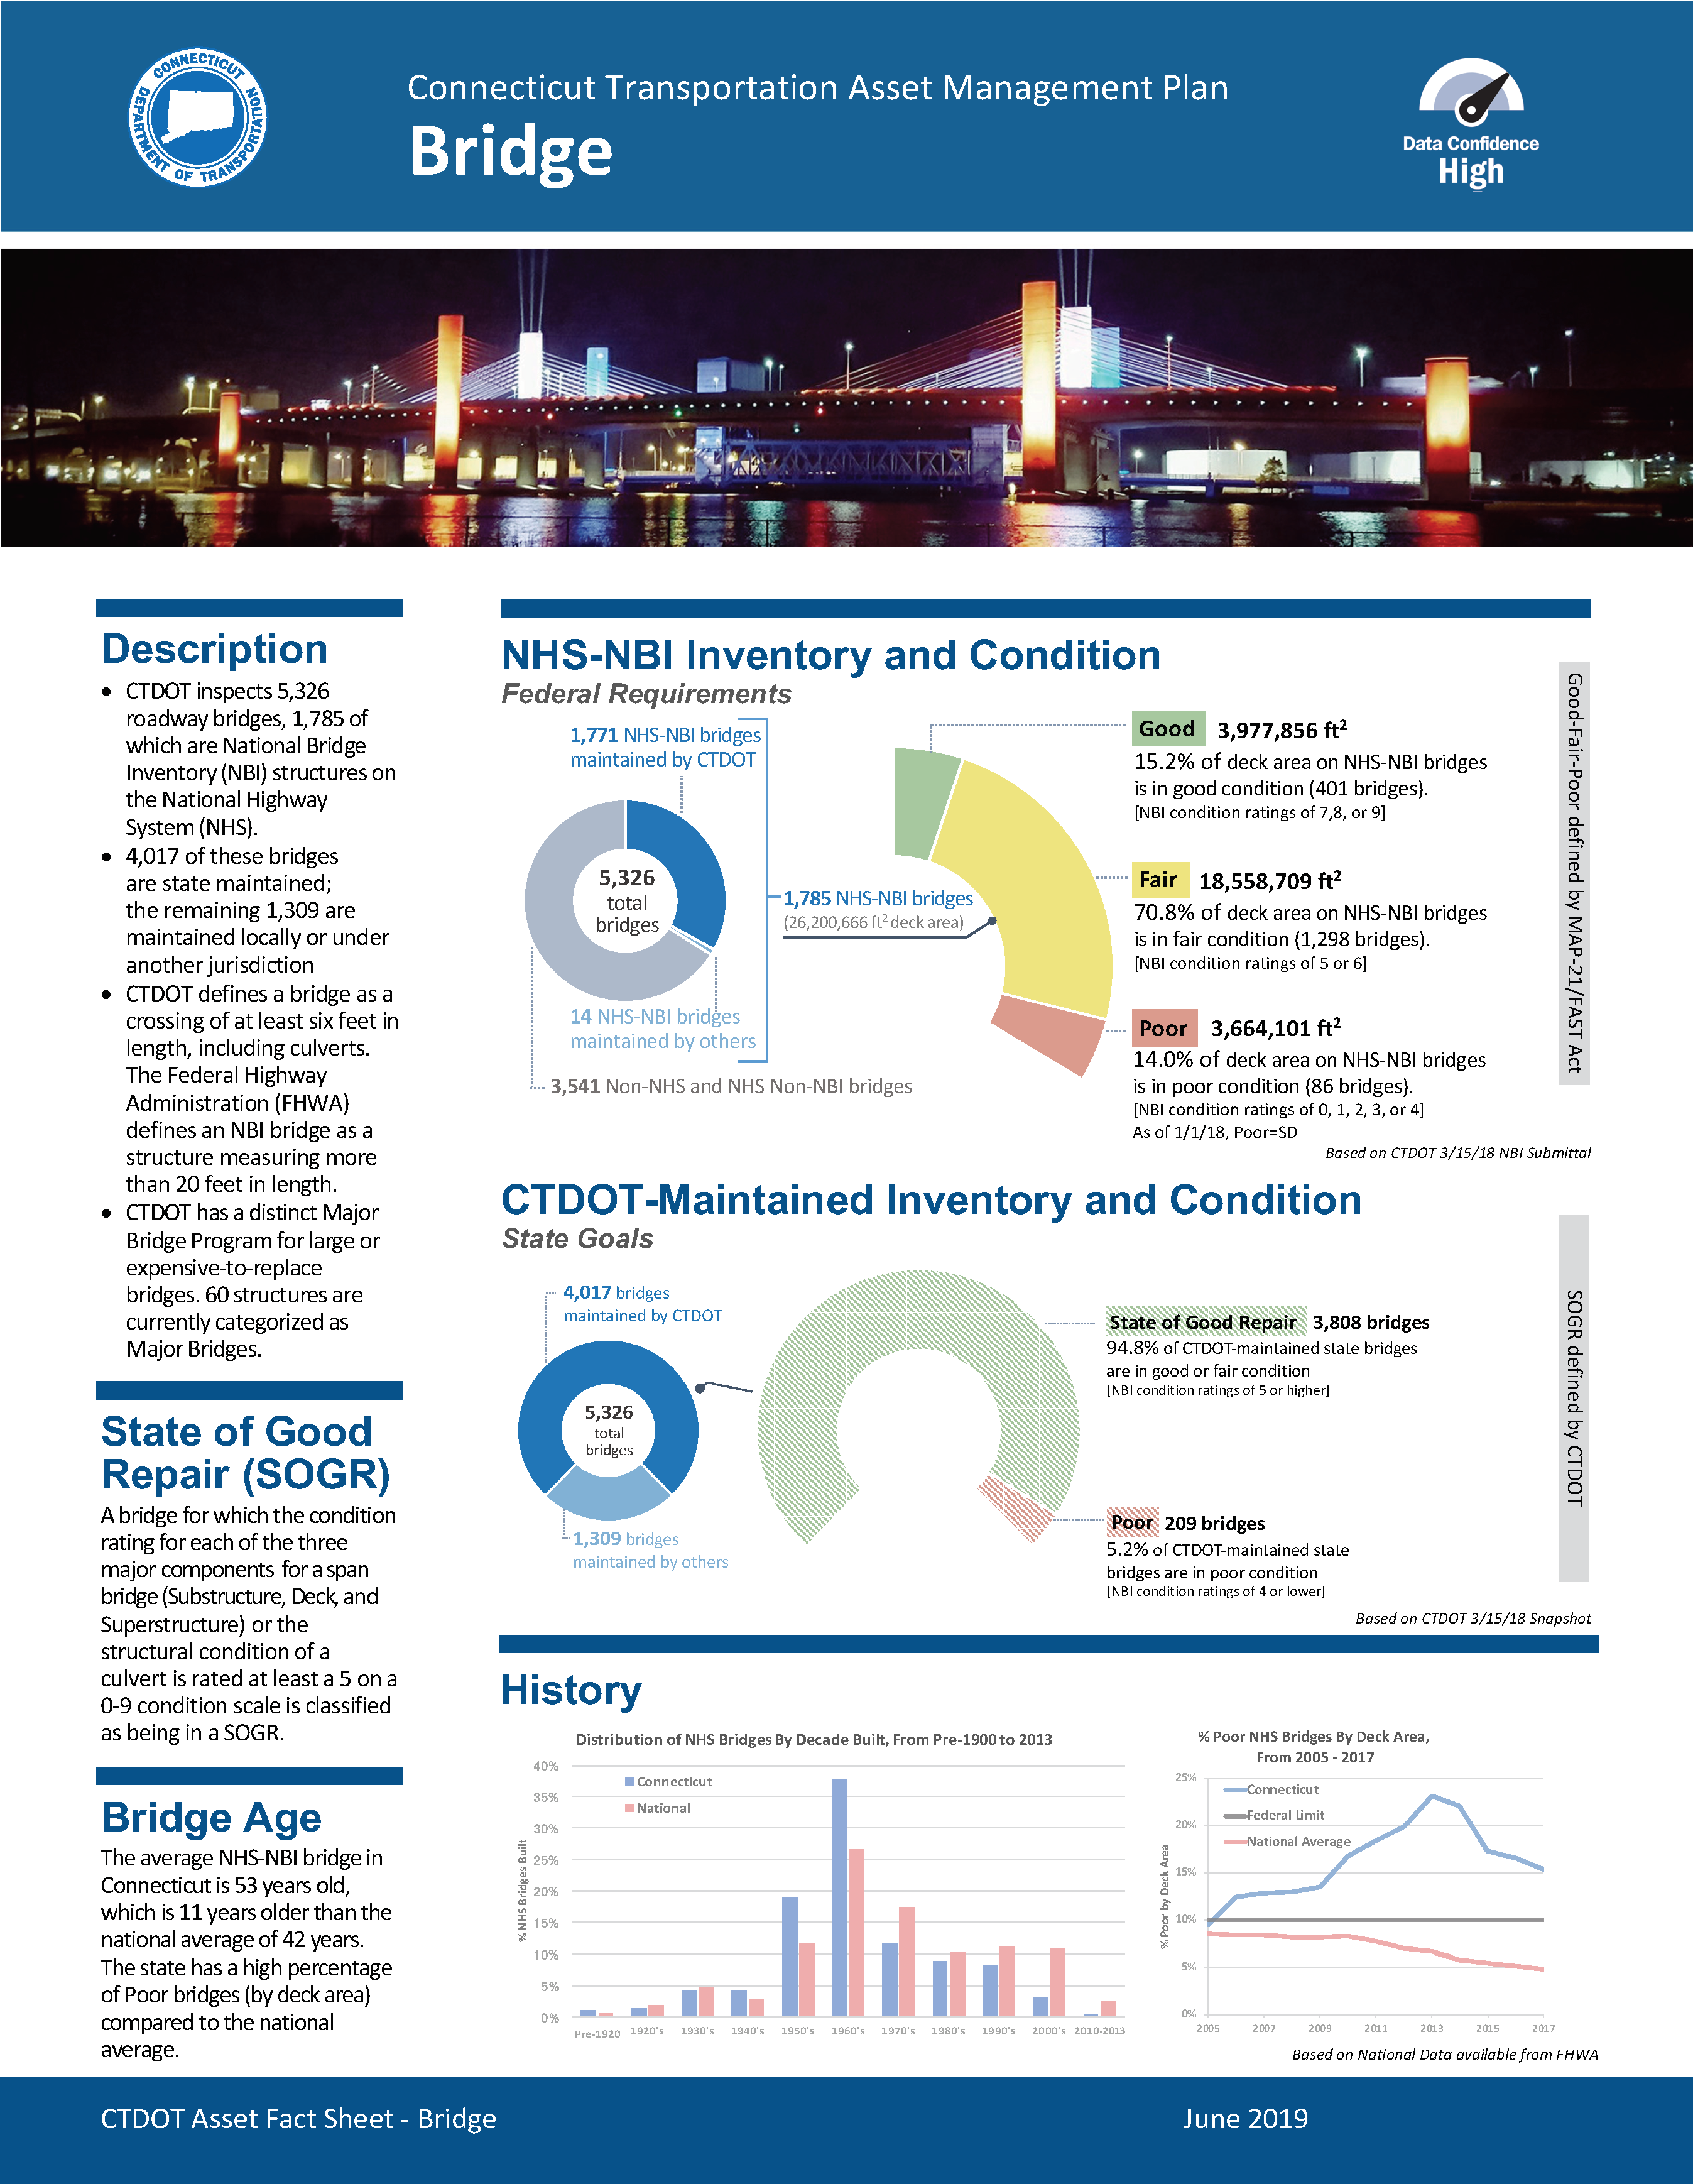
Source: Connecticut DOT. 2018. Asset Fact Sheet.
Data Sharing 7.3.2
There are many different ways to share information about assets, condition, performance, needs, and work. Agencies can select multiple distribution channels to serve both internal and external users.
As with the design of reports and visualizations, designing a data sharing strategy should begin with an understanding of the different audiences for data and their needs. A variety of options for data sharing are available that can be employed. Table 7.5 outlines some of these options and suggests some questions to consider in selecting an appropriate option.
It is helpful to establish guiding principles for data sharing in order to achieve a consistent agency approach that provides maximum benefits in a cost-effective manner. Possible principles include:
- By default, data should be shared unless it is sensitive, protected by law or if sharing it would pose unacceptable risks or cost burdens
- Self-service methods of data sharing should be used when there is a relatively large pool of data users and data limitations can be readily communicated via standard metadata
- Avoid proliferation of single purpose data sharing applications by adopting standard platforms where multiple data sets can be shared
- When it is necessary to share the same data set through multiple channels, the source data should be stored in a single location or a single data refresh process should be used to reflect updates
- The process of preparing data for sharing, reporting and visualization should be governed to ensure quality, ensure adequate documentation, and avoid inconsistency
Table 7.5 Data Sharing Options
| Data Sharing Option | Most appropriate for... | Considerations |
|---|---|---|
| On request | Internal or external data users | Use for uncommon, specialized requests requiring moderate to extensive effort to fulfill or where there is high potential for information misinterpretation or mis-use For common information needs, use other methods to reduce staff time spent on fulfilling information requests. |
| Direct access to specialized asset management system (e.g. for pavement, bridges, culverts, etc.) | Asset and maintenance specialists in the central office and field offices | Helpful features include: ability to provide view-only privileges and ability to provide filtered views of information (e.g. restrict to a single district) |
| Direct access to enterprise asset management system (with information about multiple assets) | Agency staff Partner agency staff (e.g. MPOs, localities) | For partner agency access, ability to provide access outside of the agency firewall is needed. |
| Enterprise GIS with spatial open data portal | Internal or external data users | It is best to design separate maps geared to specific user types May want to separate internal and external portals or restrict some specialized maps for internal use. |
| General open data portal | Internal or external data users | Consider using available federal and state-level open data portals May want to separate internal and external portals or restrict some specialized maps for internal use. |
| Data feeds/data services/Automated Programming Interfaces (APIs) | Internal or external data users | Most suitable for real time data sets, data sets that are frequently updated, and complex data sets where flexible querying options are needed. |
| Data warehouse/data mart | Agency staff | Use to create a cleansed and standardized data source for reporting/business intelligence. Particularly helpful when historical/time series data is required, and direct access to data from source systems is problematic due to data quality, consistency or performance concerns. Tabular data within the Data Warehouse can be joined with spatial data, as needed, within the Enterprise GIS. |
| Data lake | Agency data analysts/data scientists | Use to provide access to a heterogeneous collection of data including “big data” and unstructured data for research, modeling and analysis. |
| Content management system | Agency staff and partners (e.g. contractors) | Use to provide access to a curated collection of content including engineering design drawings, asset maintenance manuals, contracts, etc. |
| Common data environment (CDE) | Agency staff and partners (e.g. contractors) | Use to provide a shared information repository for a construction project. CDEs typically include document management, collaboration and workflow features. CDE is one of the key elements of BIM practice defined by the UK’s Construction Industry Council. |
DC DOT
Washington, DC has established four levels of data. By default, data is considered to be open and shareable.
- Level 0. Open (the default classification)
- Level 1. Public, Not Proactively Released (due to potential litigation risk or administrative
burden) - Level 2. For District Government Use (exempt from the Freedom of Information Act but not
confidential and of value within the agency) - Level 3. Confidential (sensitive or restricted from disclosure)
- Level 4. Restricted Confidential (unauthorized disclosure can result in major damage or injury)
VTrans
VTrans shares their data with the public through the VTransparency Public Information Portal. The goal of the portal is to “turn data into useful information for our customers” and to “create tools for getting answers to some of the questions we get most often”. The VTransparency Portal features different tools for viewing specific data. These tools include:
- Projects Map
- Road Conditions
- Plow Finder
- Weather Cams
- Maintenance Districts
- Crash Fatality Report
- Crash Query Tool
- Find a Project
- Daily Traffic
- Highway Closures
- Bridge Inspections
- Pavement Conditions
- Pavement Performance
- Maintenance Work
- Rail Asset Inventory
- Rail Bridge Inspections
- Rail Clearance
- Rail X-ing Inspections
The VTransparency Portal also links to the Vermont Open GeoData Portal. This provides GIS map layers related to the various tools for people interested in doing their own analysis of VTrans data. VTrans holds to the principle of making data available by default unless it is sensitive. The agency values transparency with the public and welcomes feedback on the tools they’ve developed. The VTransparency Portal can be accessed at https://vtrans.vermont.gov/vtransparency
Preparing Data for Sharing, Reporting and Visualization 7.3.3
Establishing a standard process to prepare data for sharing, reporting and visualization can make sure that data is publication-ready: quality checked, tested and documented.
A standard data preparation process should be used before moving data to any official reporting source – whether it is a data warehouse, a geodatabase, or a file uploaded to an open data portal.
A data preparation process might use the following checklist:
- Is the data derived from a designated authoritative source system?
- Have data quality checks been applied?
- Has metadata for the data set been prepared, including explanation of the data source, date of last update?
- Is an individual or business unit identified for data users to contact for further information?
- Is an individual or business unit identified for reporting database or system managers to contact regarding any issues that arise?
- Has metadata for the data elements included been prepared (data dictionary)?
- Has the metadata been reviewed for completeness and quality?
- Has a data owner or steward signed off on the data publication?
Ohio DOT
Data-driven decision making can be defined as:
“An approach to business governance or operations which values decisions supported with verifiable data. The success of the data-driven approach is reliant upon the quality of the data gathered and the effectiveness of its analysis and interpretation”
Practice Examples:
Michigan DOT
One way to coordinate and collaborate across external agencies is to establish a statewide council. Michigan’s Transportation Asset Man…
New Zealand Transport Agency
Many non-United States organizations have integrated asset management not only within internal organization processes, but also in framew…
Colorado DOT
Transportation Commission Engagement
The CDOT TAM and Performance Management unit works very closely with the Colorado Transportation Commission, which represents all of the …
Utah DOT
When meeting with legislators, the UDOT CEO uses the agency’s Strategic Directions Dashboard on a tablet device to communicate TAM-rela…
Region of Waterloo (Ontario)
Audience-Centric Communication
To assist in the implementation of a new Work Management and Decision Support System, the Region Water Services Division considered decis…
Ohio DOT
Taking Care of What We Have: A message that defines the benefits that TAM brings through tangible examples that are link…
Georgia DOT
The Georgia DOT TAMP, published in 2014, included a communication plan to promote awareness of TAM and communicate the benefits of TAM pr…
VTrans
Importance of Communication for TAM Programs
Formal and informal communication can travel both upwards and downwards within an organization. Those responsible for TAM at VTrans proac…
City of Ottawa
The Province of Ontario was one of the first jurisdictions in Canada to pass legislation that required all municipalities within the prov…

Washington DOT
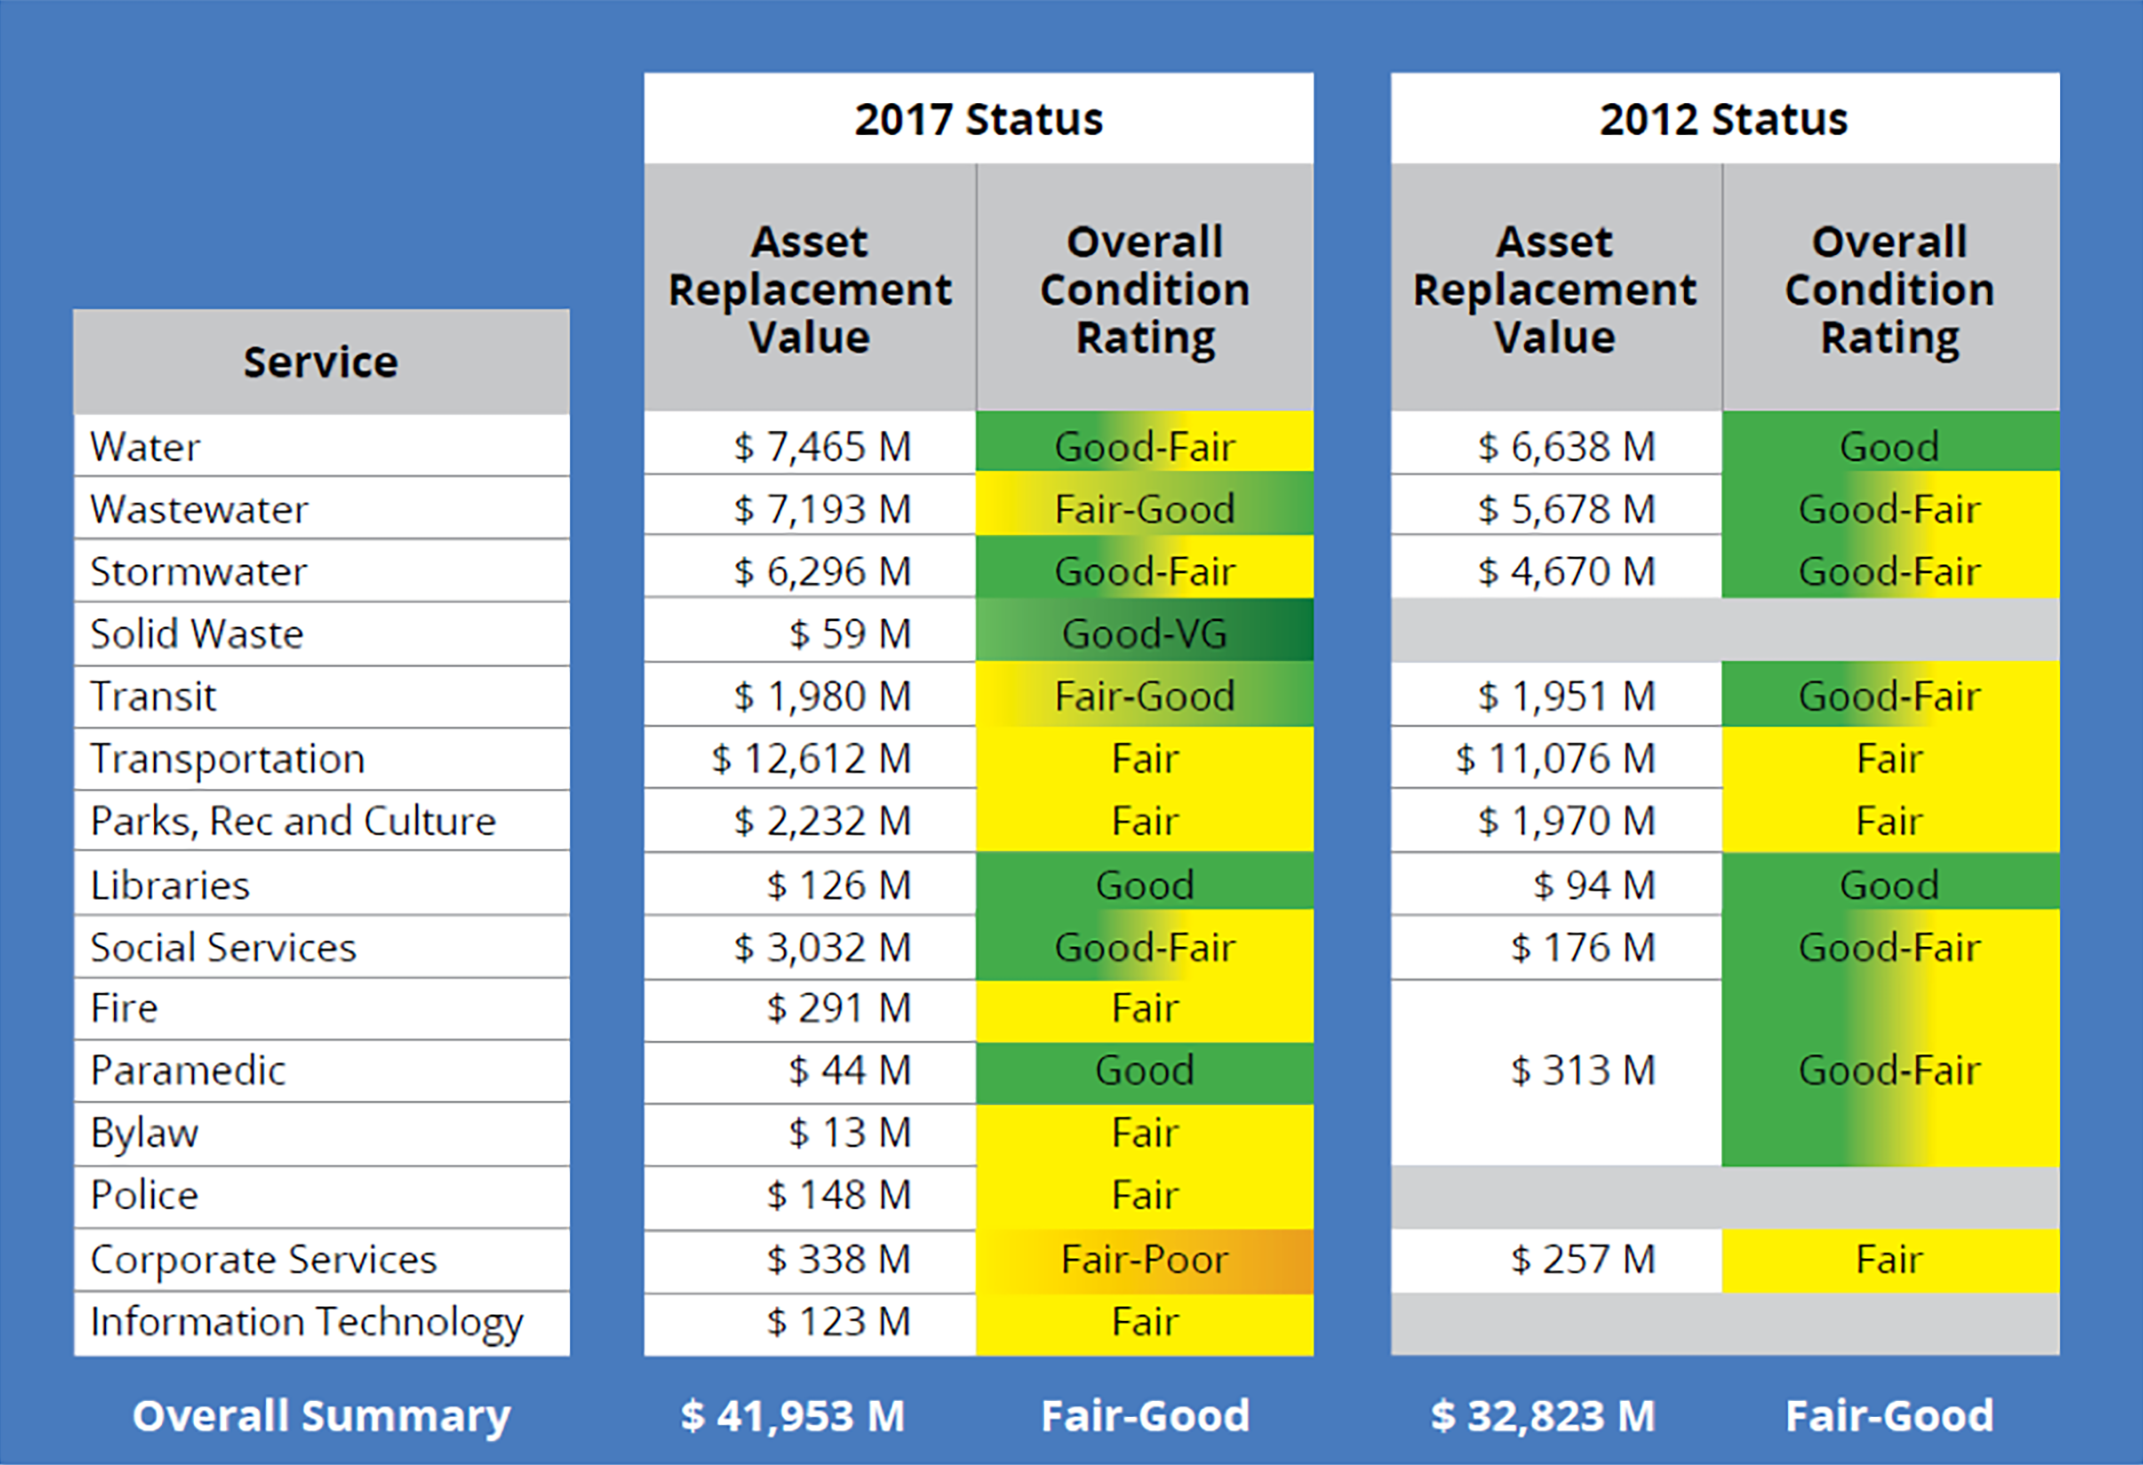
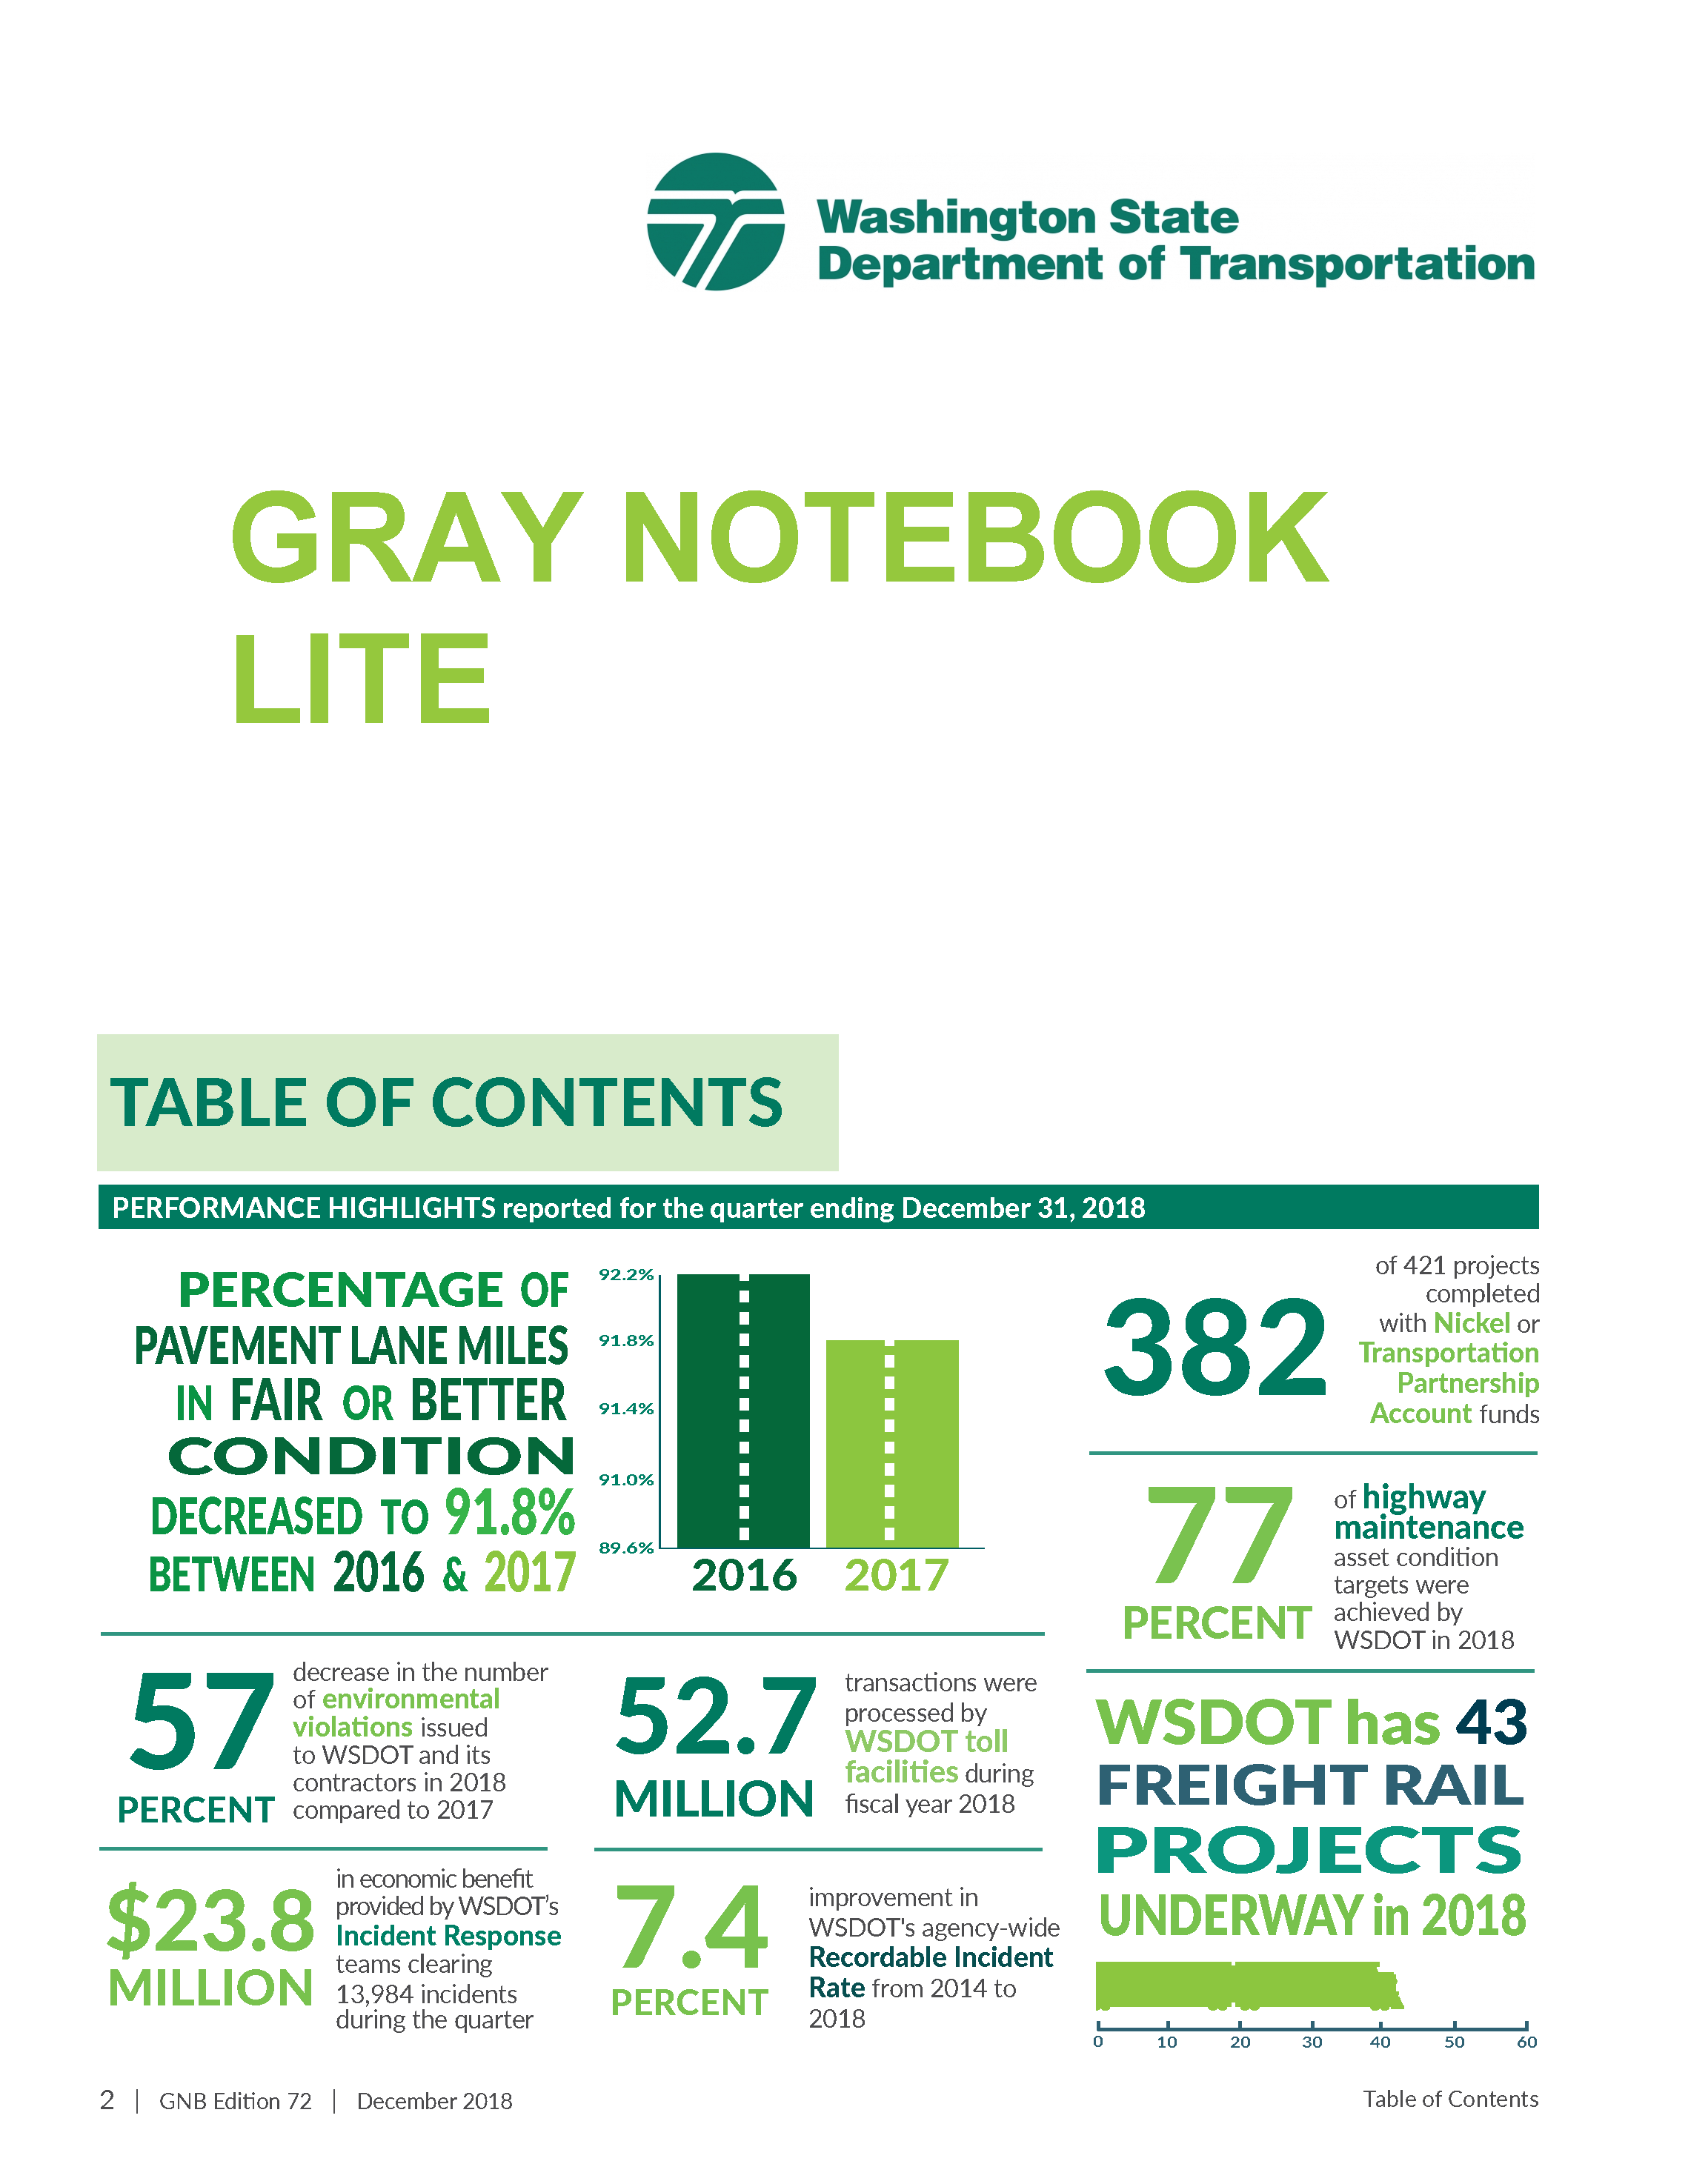
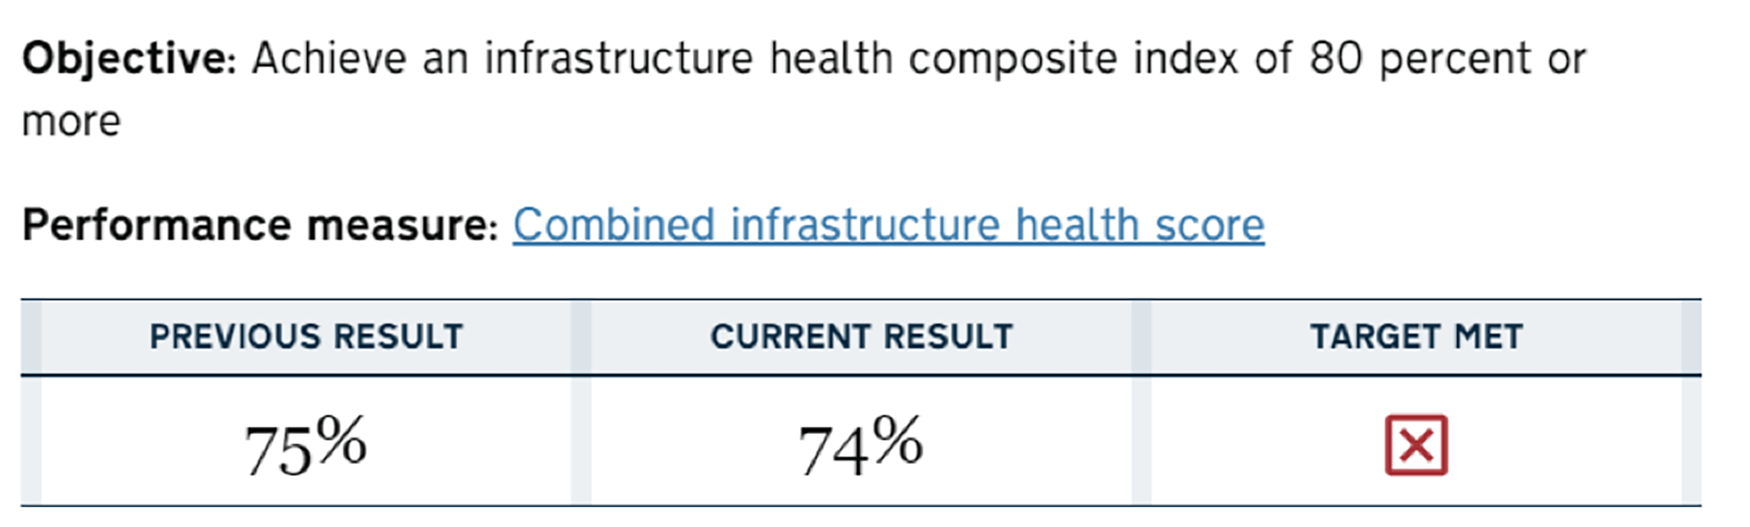
To support accountability, credibility, and transparency, the Washington State DOT publishes its quarterly performance report, referred t…

Virginia DOT
Performance dashboards are also a popular way to present progress, using color-coded indicators similar to those on the dash of an automo…
North Carolina DOT
The North Carolina DOT has an interactive Organizational Performance Scorecard that provides an online indicator of the Department’s su…
Practices:
Roles
- Roles and responsibilities associated with the Asset Management Framework and have been defined, and the organization has begun the transition to the planned management system approach.
- Senior leadership and some key staff involved in implementing asset management in the agency understand their role, and are accountable for ensuring asset management is embedded fully within the organization over time.
- Roles and responsibilities associated with the Asset Management Framework and its processes are defined in most departments.
- Key personnel in the organization including top management and other staff understand their role, and are accountable for ensuring asset management continuously improving across the organization.
- Roles and responsibilities associated with the asset management framework and its processes are clearly defined and are functioning effectively.
- Everyone in the organization, from top management, to field staff, understand their role, and who is accountable for ensuring asset management is embedded fully within the organization.
Competencies
- There is sporadic communication within the organization and externally to relevant stakeholders to help build support for the asset management framework and management systems.
- Staff have growing awareness, knowledge, and capabilities to perform their role in alignment to the asset management system.
- Attempts are made to implement change management strategies to improve and strengthen the asset management program.
- There is regular communication within the organization and externally by the agency that helps build support for the asset management framework and management systems.
- Key staff have an appropriate level of awareness, knowledge and capabilities to perform their role in implementing and improving the asset management system.
- Change management tactics are developed in response to resistance to implementing actions that strengthen the asset management program.
- There is consistent, aligned and supportive communication within the organization and externally to relevant stakeholders that helps build support for the asset management framework and management systems
- Staff have an appropriate level of awareness, knowledge and capabilities to perform their role in alignment to the asset management system.
- A well crafted change management strategy helps implement improvement actions that strengthen the asset management program.
Asset Data Sharing, Reporting and Visualization
- Information is available to most stakeholders and allow for improving decisions over time.
- Data and analysis presentation is improving with a plan for consistency across the agency.
- Information is available to most stakeholders and allow for informed, supported decisions
- Data and analysis presentation is improving and is targeted to key decision-makers, and consistent across the agency.
- Information is available to all stakeholders and allow for informed, supported decisions
- Data and analysis presentation is well crafted, easy to understand for the targeted audience, and consistent across the agency.
How To Guides:
Develop an Asset Management Policy
Establish a TAM Steering Committee
Develop a Communications Plan
Checklists:
Ingredients in an Implementation Plan
Preparing Data for Sharing, Reporting and Visualization
May 11, 2022 | Pipefy, Isabelle Salemme
Guide to process management. Describes best practices such as the Lean Six Sigma model, and explains how to create process maps (workflow diagrams).
External Link: https://www.pipefy.com/blog/process-mapping/
September 30, 2015 | Transportation Research Board
The objective of Communicating Performance Management—State DOTs Continuing to “Tell Their Story” is to provide a resource base for guiding state departments of transportation (DOT) performance management (PM) and communications professionals in communicating transportation system performance. The hope for this resource is to advance PM communications practices, particularly with respect to Moving Ahead for Progress in the 21st Century (MAP-21) reporting requirements.
External Link: http://onlinepubs.trb.org/onlinepubs/nchrp/docs/NCHRP20-24(93)B02_FR.pdf
January 31, 2017 | W3C
This document provides Best Practices related to the publication and usage of data on the Web designed to help support a self-sustaining ecosystem.
External Link: https://www.w3.org/TR/2017/REC-dwbp-20170131/
July 1, 2017 | Cambridge Systematics, Inc.
This website is intended as a resource for transportation professionals who want to use illustrations and visualizations to communicate their ideas to an audience.
External Link: https://vizguide.tpm-portal.com/
August 22, 2023 | Metropolitan Transportation Commission
Vital Signs is an interactive website by MTC and the Association of Bay Area Governments (ABAG) that offers data, visual representations of that data and written explanations about important trends in the Bay Area.
External Link: https://mtc.ca.gov/tools-resources/vital-signs
September 1, 2015 | Transportation Research Board
Successful Practices in GIS-Based Asset Management provides guidance for state transportation agencies on using geographic information system (GIS) technologies in transportation asset management (TAM).
External Link: https://nap.nationalacademies.org/catalog/22194/successful-practices-in-gis-based-asset-management
September 1, 2001 | Graphics Press LLC
Guide to statistical graphics, with emphasis on its use as a statistical method and applications in data analysis and mapping - includes chapters on aesthetics and the methodology of preparing graphs and visual aids.
External Link: http://faculty.salisbury.edu/~jtanderson/teaching/cosc311/fa21/files/tufte.pdf
May 1, 2020 | FHWA
This case study highlights practices State departments of transportation (DOTs) deployed to communicate and engage internal and external stakeholders. These communication practices increased coordination within the DOTs and with important external partners such as the owners of assets on the National Highway System (NHS) and metropolitan planning organization (MPOs).
External Link: https://rosap.ntl.bts.gov/view/dot/50771
May 1, 2020 | FHWA
This case study highlights examples of how State departments of transportation (DOTs) explained their asset management practices, and the benefits from those practices.
External Link: https://rosap.ntl.bts.gov/view/dot/54454