Section 6.1
Monitoring Performance Measures
Performance measures are used by transportation agencies to align agency investment decisions with organizational objectives, such as asset condition or system reliability, and to monitor progress towards achieving agency goals. In TAM, asset performance is most commonly defined in terms of asset condition, but performance can also be represented by operational considerations, such as safety or traffic reliability.
6.1.1
Selecting and Using Performance Measures
This subsection discusses the importance of using performance data to make decisions. It highlights the role of performance measures and provides suggestions on selecting effective measures to meet agency needs. This section also introduces innovative new performance measures that agencies may consider in the future. A more detailed discussion of Transportation Performance Management can be found in Chapter 2.
Performance Management Framework
As discussed in Chapter 2, transportation agencies have embraced the use of performance data to drive investment decisions. A performance-based management approach enables agencies to select and deliver the most effective set of projects for achieving strategic objectives, while also improving internal and external transparency and accountability.
A typical performance management framework includes:
- A clear idea of the agency’s strategic objectives.
- The use of performance measures to assess performance.
- Methods to evaluate and monitor performance results.
- The evaluation of factors with capacity to improve long-term performance.
- The allocation of funding to achieve agency objectives.
- Ongoing processes to monitor and report progress.
A fundamental component of the framework is the use of performance measures to evaluate system performance and the importance of establishing business processes to evaluate, monitor, and use the data to influence agency decisions. These are achieved by aligning decisions at all levels of the organization with the agency’s strategic objectives and ensuring that the right performance measures are being used to drive decisions. This alignment helps to ensure that resource allocation decisions and the day-to-day activities of agency personnel support the agency’s priorities and the interests of external stakeholders.
The existence of a regular, ongoing processes to monitor and report results is critical to identifying and implementing improvements to system performance or to further the effectiveness of the performance management process. The continual monitoring and update of a performance management framework is reflected in Figure 6.1, which illustrates inputs to performance targets and how ongoing monitoring and adjustments are fed back into the framework to adjust future targets. The surveys conducted regularly to support a pavement, bridge or maintenance management system are examples of the types of performance monitoring activities fundamental to an effective performance management organization.
TPM Webinar #16 - Caltran's Performance Management Framework
Agencies with a performance management framework in place have benefited from:
- Maintaining a clear and unified focus for making agency decisions based on agency priorities, public input and available resources.
- Using available funding more effectively to preserve or improve system performance while lowering life cycle costs.
- Allocating available resources based on analysis of past performance and expected conditions to address areas most in need of attention.
- Having the data to confidently defend funding requests or explain the impact of reduced budgets.
- Building a transparent and accountable organization by communicating the basis for making resource decisions.
- Meeting legislative requirements.
Figure 6.1 Monitoring and Adjustment in the TPM Process

TIP
It is important to select performance measures that are meaningful to the agency and that can directly inform decisions. This may vary depending on the agency context, culture, and TAM maturity.
Arizona DOT
In 2001, during the development of a long-range transportation plan (LRTP), the Arizona DOT took a strategic approach to how investments should be made. Under the new approach, Arizona DOT established the following three investment categories:
- Preservation, including activities that preserve existing transportation infrastructure.
- Modernization, including improvements that upgrade the efficiency, functionality, and safety without adding capacity.
- Expansion, including improvements that add transportation capacity by adding new facilities or services.
To implement the new initiative, the Arizona DOT developed a report titled “Linking the Long-Range Transportation Plan and Construction Program” or "P2P Link” that applied financial constraints to the long-term vision. Through a collaborative process that involved a consultant, local and regional governments, and transit agencies, the Arizona DOT published an implementation plan for putting the P2P Link into practice. The resulting process includes scoring projects based on both a technical and policy score that are added together to determine a project’s ranking. The technical score is generated by the asset owner based on an analysis of the data while the policy score is determined based on each project’s contribution to LRTP goals and performance measures. The process helps to ensure that projects are ranked in accordance with the agency’s strategic objectives using only the most meaningful criteria in a transparent and defensible way.
Arizona DOT’s Link Between Strategic Objectives and Investment Decisions

Source: ADOT. 2014. Linking the Long-Range Plan and Construction Program P2P Link Methodologies & Implementation Plan.
https://azdot.gov/sites/default/files/2019/08/p2p-methodologies-implementation.pdf
Performance Measures
Performance measures are used within a performance management framework to allocate resources and provide feedback on the effectiveness of the activities in achieving overall objectives. Performance measures are indicators used for evaluating strategies and tracking progress. A performance measure can be an indication of asset condition, such as a pavement condition rating, or an indication of an operational characteristic, such as the annual number of fatalities on a facility.
The most effective performance measures drive decisions that are important to the success of the program. For example, maintenance departments may use performance measures that track actual expenditures to planned expenditures to ensure that available funding is directed towards the highest-priority items, as shown in the North Carolina DOT practice example.
It is also important that the measures drive the desired performance within an organization. For instance, a performance requirement that measures whether pavement or bridge designs are submitted on time might cause incomplete or incorrect submittals to meet a deadline, leading to an increase in construction modifications. A more effective measure might focus on a minimal number of design modifications during the construction phase of a project.
Effective performance measures should also primarily be outcome-based rather than output-based, meaning that they focus on the result or impact of an activity rather than the inputs that went into the activity. Outcome-based measures are generally preferred because they indicate the effect on the traveling public resulting from the actions taken, so they usually relate to user priorities such as the length of time for a road to be cleared after a snow event or the absence of litter and graffiti. They are developed based on a description of what an agency wants to achieve as a result of the actions undertaken. Outcome-based measures are commonly used for managing ancillary assets such as drainage assets and signs. For instance, the performance of drainage assets might be reported in terms of the percent of pipes/culverts greater than 50 percent filled or otherwise deficient and the performance of signs might be reported in terms of the percent of signs viewable at night.
Output-based measures, on the other hand, track the resources used to achieve the outcome, such as the number of hours of labor used or the number of light-bulbs changed in a month. While the data is important information for managing resources, it does not necessarily drive outcomes that would matter to the public. For instance, travelers on a highway are much more interested in knowing when the road will be cleared of snow than how much overtime went into the operation.
When possible, agencies should use performance measures that are leading measures rather than lagging measures to influence future decisions. A leading measure uses changes in performance to provide insights into potential changes that might influence a future decision one way or another. For example, knowledge that a ramp meter has exceeded the manufacturer’s suggested service life might drive a decision to replace that meter. Similarly, increases in equipment downtime might indicate risks due to an aging fleet are growing or that planned operational activities will not be performed as planned. A lagging measure, on the other hand, looks back on the results of past investment strategies after the decisions have been made. Because a lagging measure is recorded after the fact, there is a delay (lag) in the agency’s ability to adjust its practices and improve performance. Bridge and pavement condition measures are examples of lagging measures because the reported conditions reflect the impact of decisions made several years in the past. Lagging measures are commonly used to evaluate a program’s effectiveness or to verify that actual investments achieved projected results.
In transportation, an agency might have a lagging measure for tracking complaints responded to within a 48-hour window. The measure provides an indication of the public’s satisfaction with the road network and is easy to monitor and report. However, if an agency really wants to effect change, it might develop leading measures to track the percent of complaints not worked on within a two-hour window or the percent of complaints that can’t be resolved by the initial point of contact and must be passed to someone else. Focusing on these types of measures could drive agency decisions to ensure complaints are being worked on quickly and are being assigned to the right people. General characteristics of effective performance measures are presented in Table 6.1.
TIP
Outcome-based measures better relate to performance characteristics noticed by the public and other stakeholders than output-based measures.
Ancillary Asset Management
Table 6.1 - Desired Performance Measure Characteristics
| Desired Characteristics | Rationale/Purpose |
|---|---|
| Measurable with available tools/data | May require no additional cost for data collection |
| Forecastable | Enables data-driven target setting based on future conditions |
| Clear to the public and lawmakers | Allows performance story-telling to customers and policymakers |
| Agency has influence over result | Measures agency activities rather than impact of external factors |
North Carolina DOT
The North Carolina DOT authorizes its divisions to determine how funding will be used for maintenance activities and uses performance data to assist with this activity. Each year, Division Engineers submit annual plans detailing what work will be accomplished; these plans are reviewed quarterly with the Chief Engineer to discuss actual versus planned work. Their accomplishments are also displayed in a dashboard for internal use, as shown in the following image. Public-facing dashboards are also available showing overall conditions and performance trends. The Division Engineers are also held accountable for their performance, since their planned and actual performance data are incorporated into their annual evaluations.
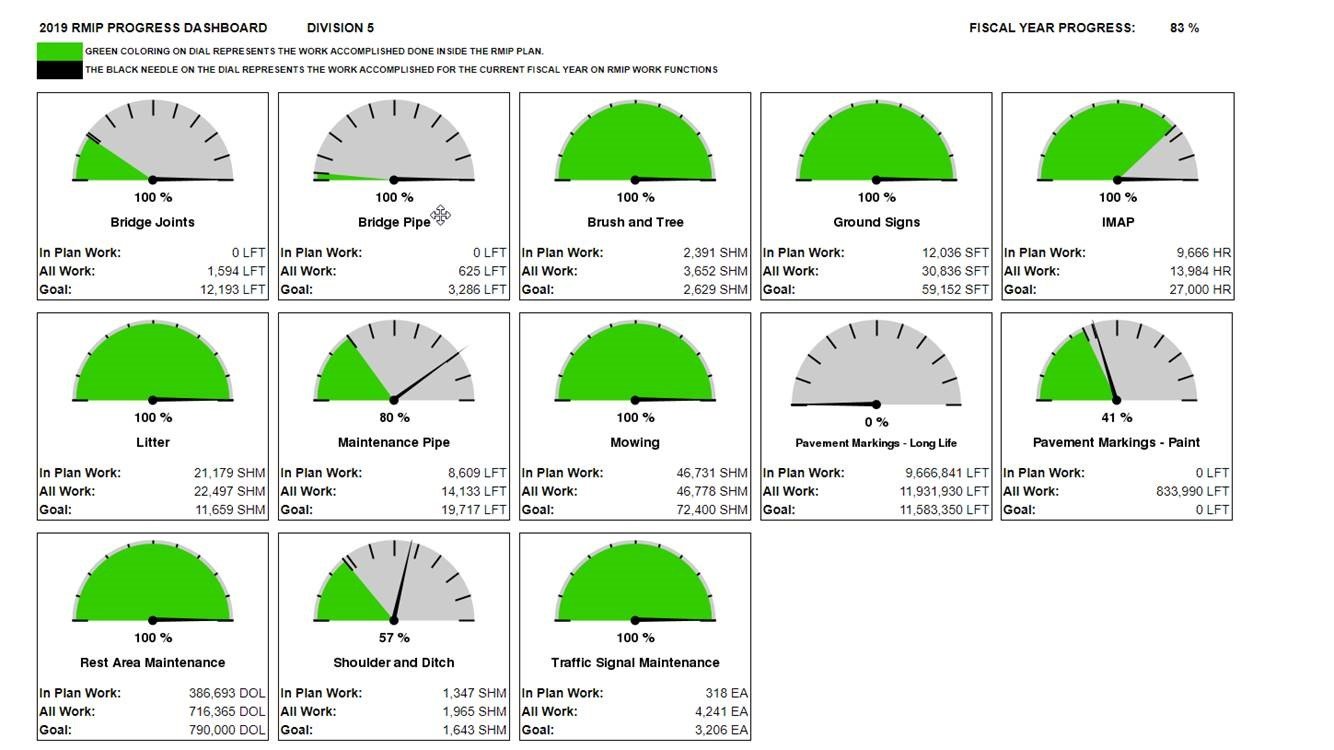
Source: Leading Management Practices in Determining Funding Levels for Maintenance and Preservation. Scan Team Report, NCHRP Project 20-68A, Scan 14-01, National Cooperative Highway Research Program, May 2016.
Use of Performance Measures
Performance measures are used to:
- Connect agency policies and objectives to investment decisions.
- Establish desired and targeted levels of service that consider past performance, current and future demand, stakeholder priorities, and anticipated funding.
- Align agency policies, investments, and day-to-day practices in a meaningful and easily understood manner.
- Prioritize investment needs.
- Monitor and report progress towards desired objectives to both internal and external stakeholders in a consistent, cost-effective, and transparent manner as illustrated in practice examples from the Washington State, North Carolina, and Virginia DOTs.
Washington DOT
The Washington DOT uses its Maintenance Accountability Process (MAP) to comprehensively manage maintenance budgets and to communicate the impacts of policy and budget to both internal and external stakeholders. Field condition surveys are conducted annually to assess the condition of 14 assets on the highway system such as signs and signals, ITS assets, tunnels, and highway lighting. For each asset, a level of service target is established, based on expected funding levels and importance of the asset to the agency’s strategic objectives. The targeted and actual performance is summarized on a statewide basis and presented to the legislature, media, internal stakeholders, and other DOTs in a format similar to what is shown in the figure (https://www.wsdot.wa.gov/NR/rdonlyres/8EC689DF-9894-43A8-AA0F-92F49AC374F5/0/MAPservicelevelreport.pdf). In 2018, Washington State DOT achieved 77 percent of its highway maintenance targets. Targets that were not achieved are shown as red bullseyes and areas where the targets were exceeded include a checkmark with the bullseye. The results illustrate where additional investment is needed on a statewide basis and provides a basis for setting maintenance priorities during the year.
Targeted and Actual Performance Results Used to Set Maintenance Priorities
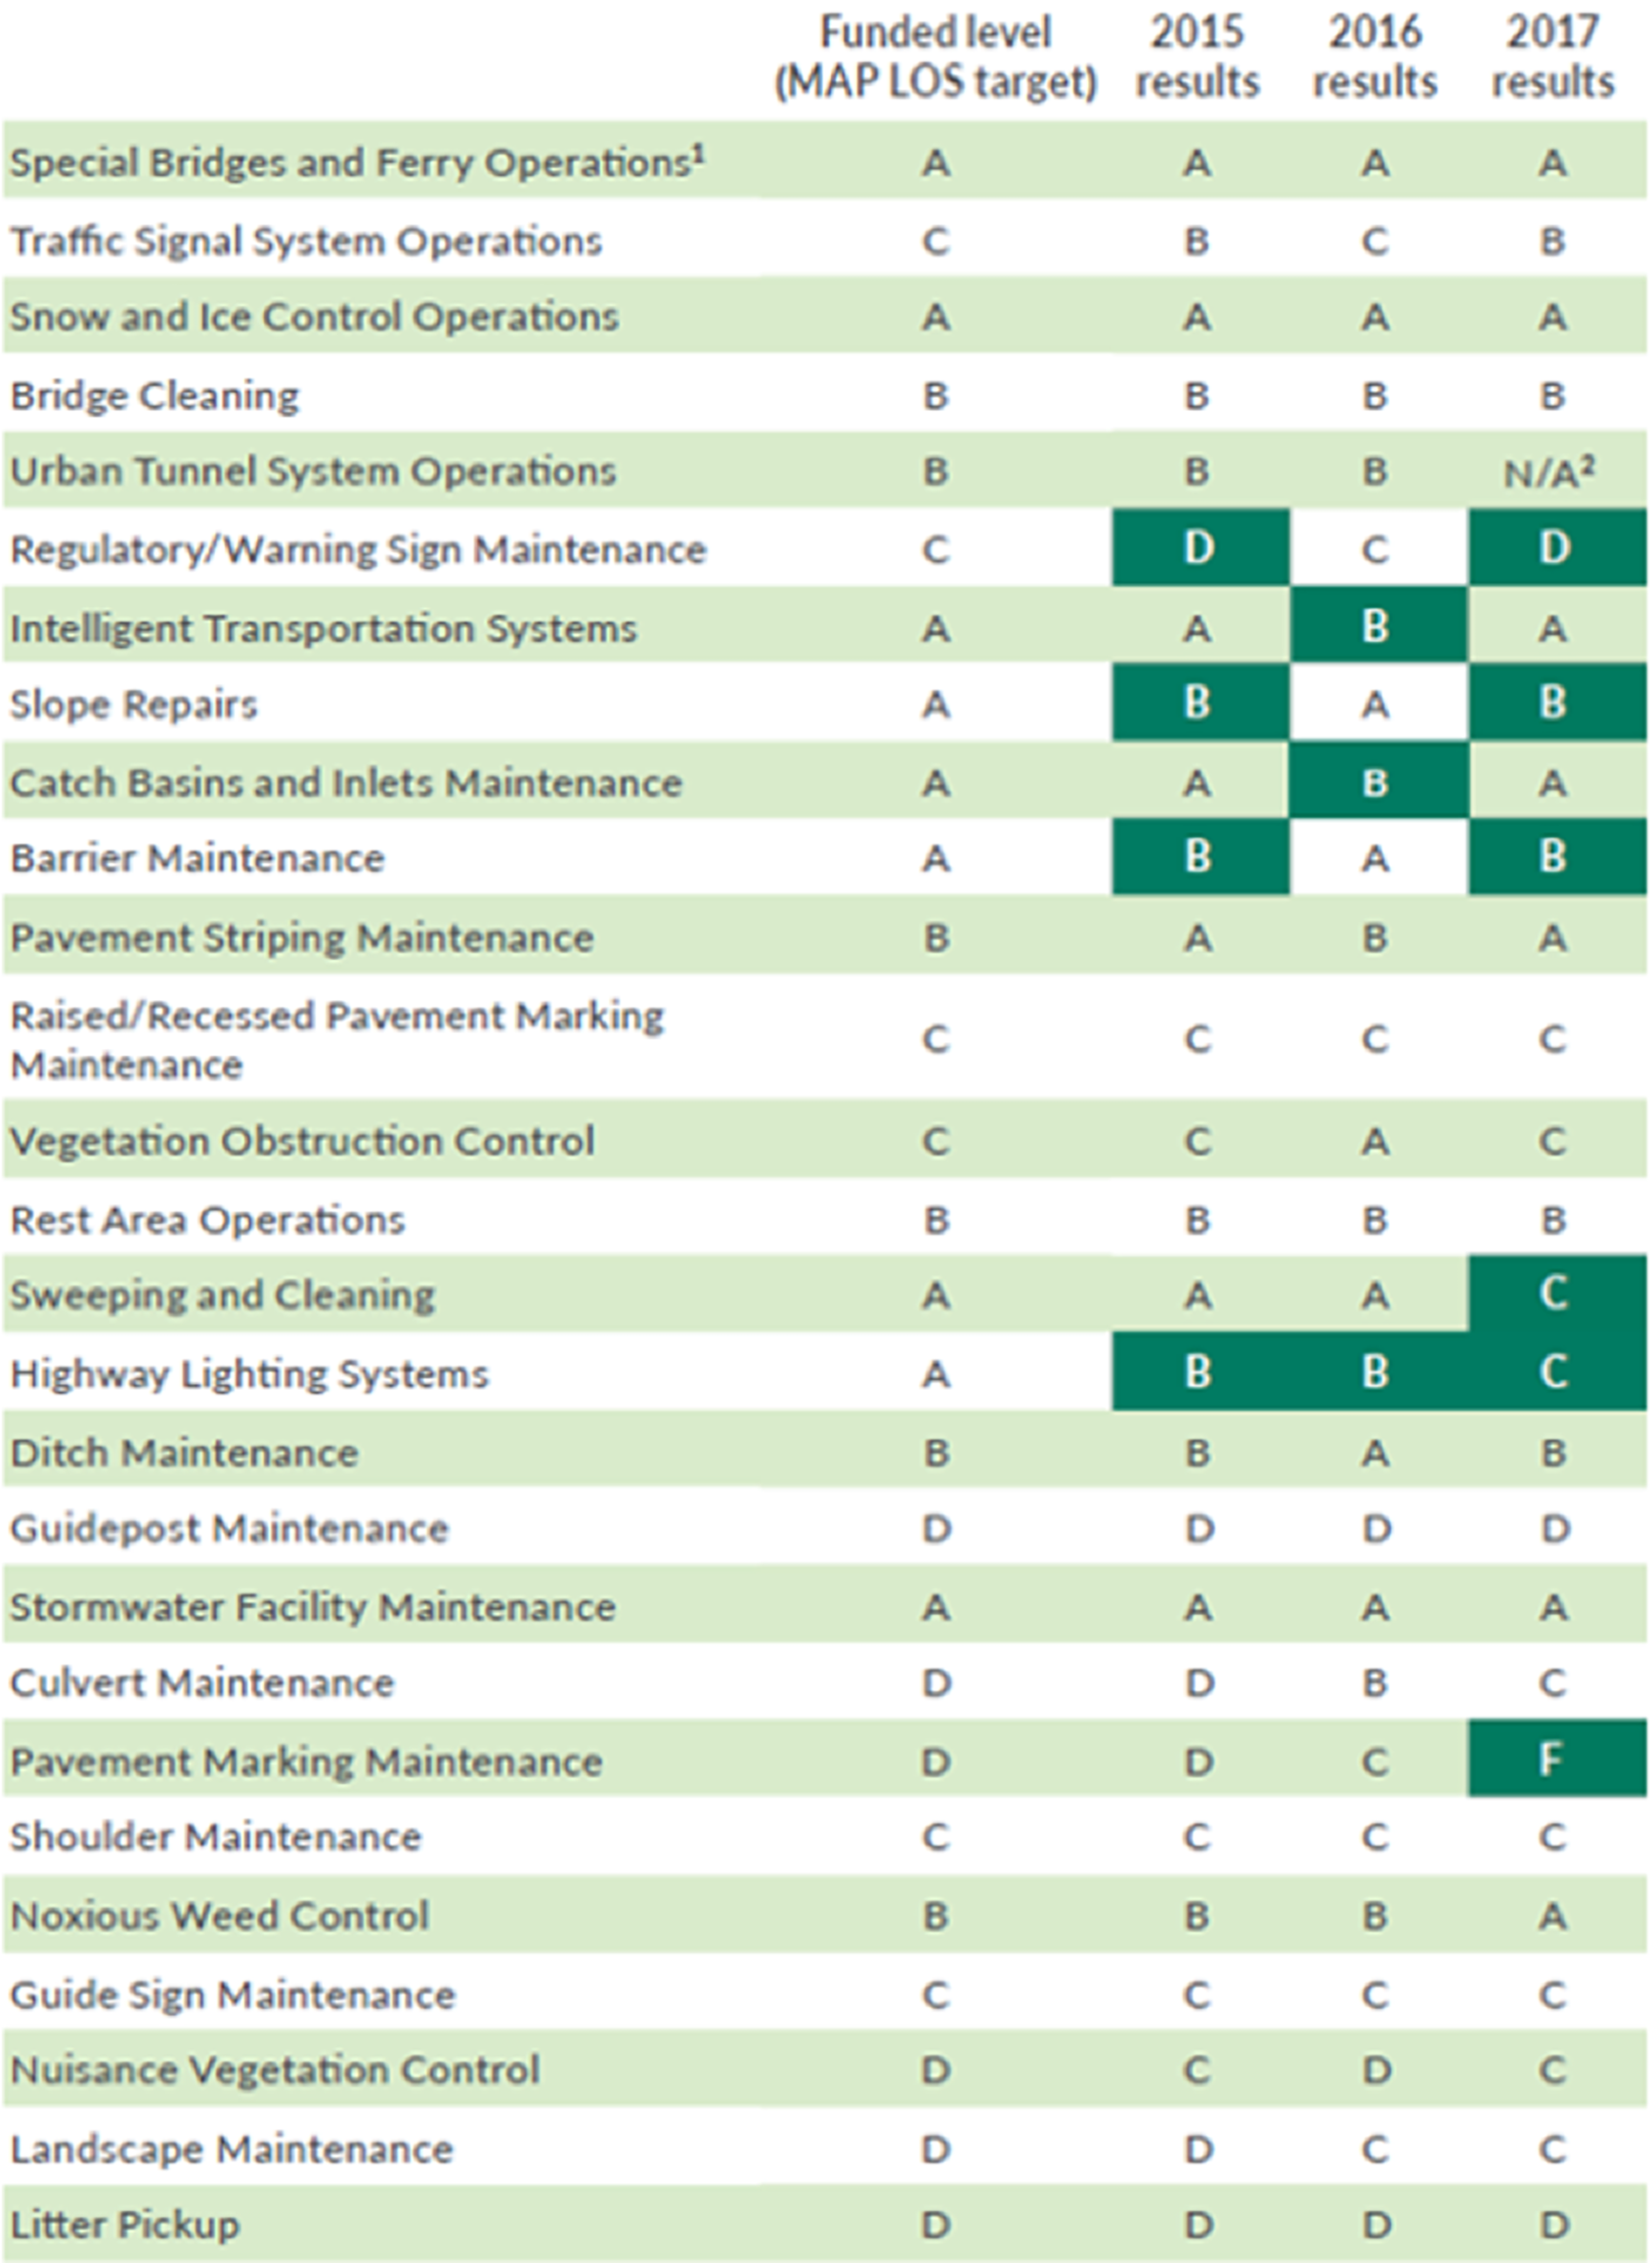
Source: WSDOT. 2017. Multimodal Asset Performance Report. Washington State DOT. https://wsdot.wa.gov/publications/fulltext/graynotebook/Multimodal/AssetPerformanceReport_2017.pdf
Washington DOT
To support accountability, credibility, and transparency, the Washington State DOT publishes its quarterly performance report, referred to as The Gray Notebook. Each edition of the Gray Notebook presents updates on multimodal systems' and programs' key functions and analysis of performance in strategic goal areas based on information reported to the Performance Management and Strategic Management offices of the Transportation Safety and Systems Analysis Division. Washington State DOT also publishes its Gray Notebook Lite, which highlights key metrics referenced in the Gray Notebook in a format for quick reading. Examples from each of these documents are presented in the figures.
The Gray Notebook and the Gray Notebook Lite

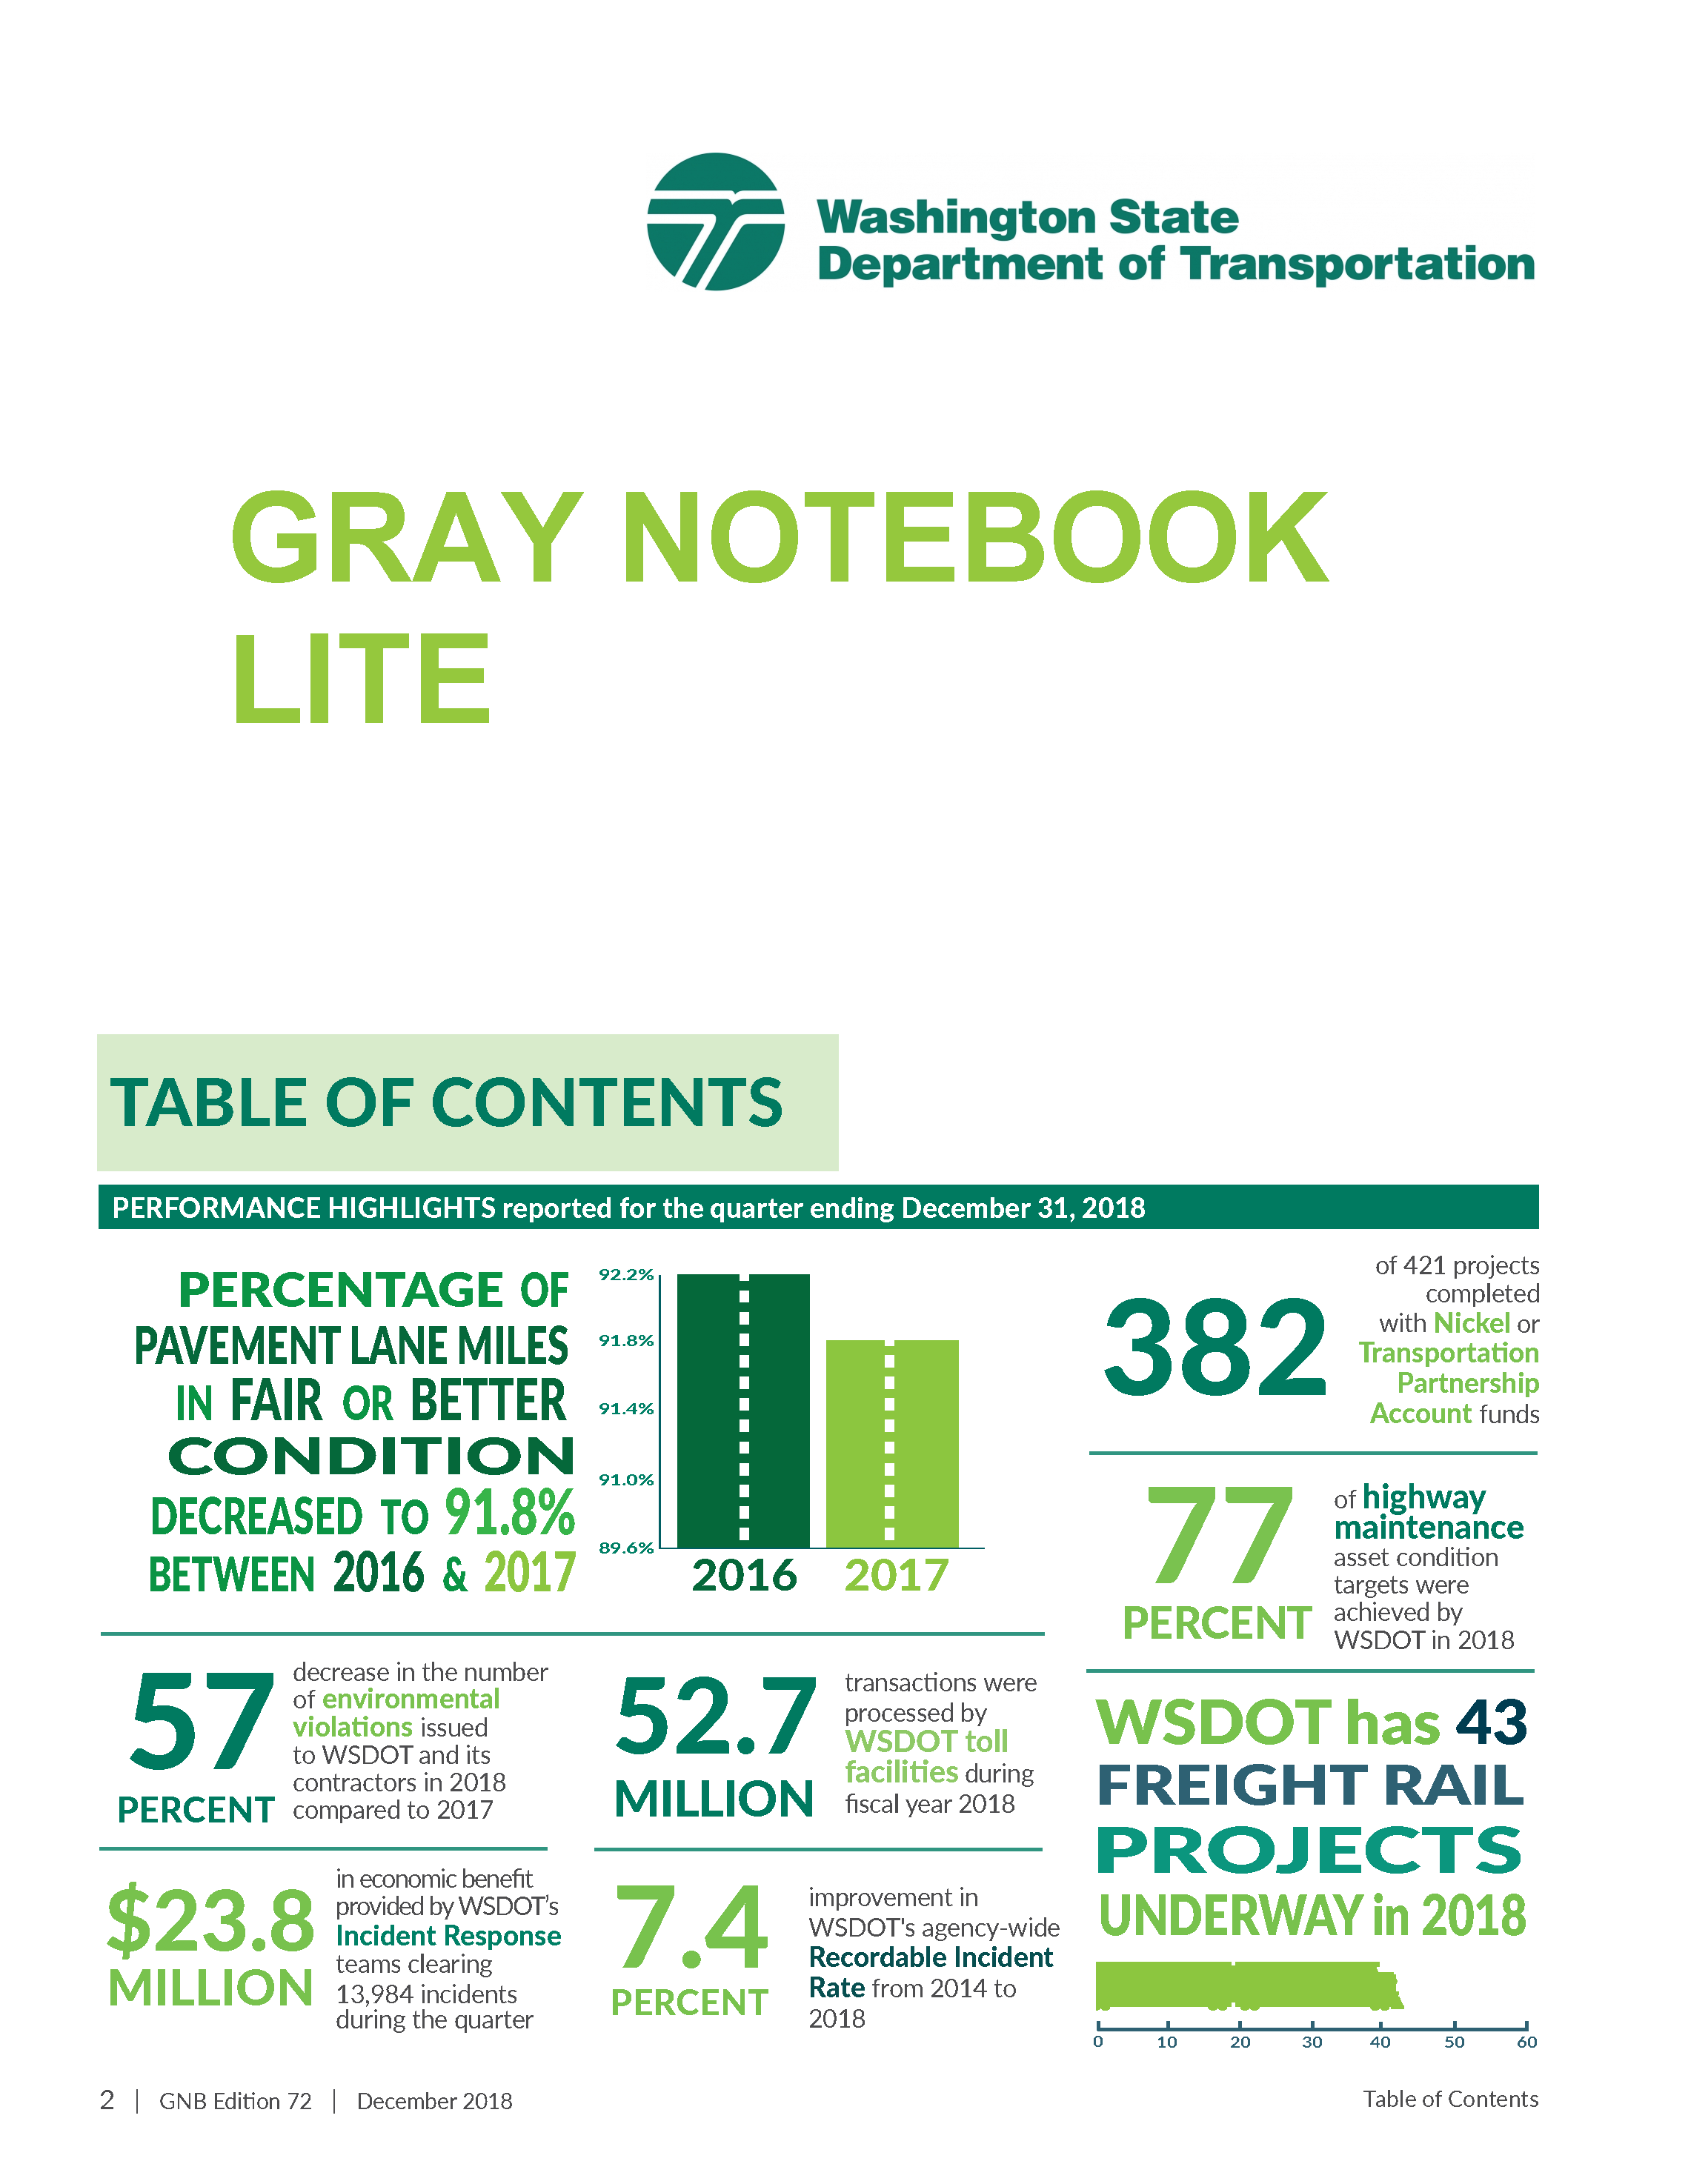
Source: WSDOT. 2019. https://wsdot.wa.gov/about/accountability/gray-notebook
Virginia DOT
Performance dashboards are also a popular way to present progress, using color-coded indicators similar to those on the dash of an automobile. An example of the interactive dashboard available from the Virginia DOT is shown in the figure. The screen reports performance in seven areas (performance, safety, condition, finance, management, projects, and citizen survey results) and the needles indicate whether the performance is within targeted ranges. Hyperlinks are available in each area if a user wants to explore historical trends or explore performance objectives in more detail.
Virginia DOT's Performance Dashboard

Source: Virginia DOT. 2019. http://dashboard.virginiadot.org/
Future Directions in Performance Measures
As agencies advance the maturity of their practices and move towards investment decisions across assets and modes (as discussed in Chapter 5), there is increasing interest in the use of leading measures and asset performance measures that can be used in concert with asset condition measures.
Asset management plans document the processes and investment strategies developed by an agency to manage its infrastructure assets. These asset management plans support an agency’s performance-based planning and programming processes for making long-term investment decisions and feed shorter-term project and treatment selection activities. Together, these activities ensure the investment decisions of an agency are aligned with performance objectives and goals.
Examples of innovative new performance measures include:
- Financial Measures – Internationally, financial performance measures have been used successfully to express whether the level of investment has been adequate to offset the rate of asset deterioration or depreciation. For example, the Queensland Department of Infrastructure and Planning uses an Asset Sustainability Ratio defined as the capital expenditure being made on asset renewals (e.g., improvements) divided by the depreciation expense (discussed further in Chapter 4). If the ratio is less than 100 percent, the level of investment is not adequately replacing the depreciation occurring each year. Queensland also uses an Asset Consumption Ratio comparing the current value of the depreciable assets to their replacement value in order to show the aged condition of the assets.
In the United States, some agencies are evaluating the use of an Asset Sustainability Index (ASI), which is the ratio of the budget allocated to address needed improvements identified by a pavement or bridge management system (FHWA. 2012. Asset Sustainability Index: A Proposed Measure for Long-Term Performance, Federal Highway Administration, Washington, D.C.). The ASI is a unitless measure that allows comparisons across asset classes and provides an overall assessment of the adequacy of an agency’s investment in its assets. Since it is unitless, an agency could individually calculate a Maintenance Sustainability Ratio, a Pavement Sustainability Ratio, and a Bridge Sustainability Ratio that are all combined into an overall ASI. One of the difficulties in calculating the ASI is defining the needed level of investment since needs are significantly impacted by targeted condition levels. Slight changes in targeted conditions can have a significant impact on the resulting ASI calculation.
- Life Cycle Measures - A life cycle performance measure is a relatively new leading measure, promoting the selection of sound, long-term strategies best able to maximize performance at the lowest possible cost. There are several life cycle performance measures under consideration, including the Remaining Service Interval (RSI), validated under an FHWA-sponsored research project. The RSI is based on identifying a structured sequence of the type and timing of various repair and replacement actions needed to achieve a desired LOS over a long timeframe at the minimum practicable cost. The results of the RSI evaluation may be used to generate a Life Cycle Impact Factor, summarizing the difference in life cycle costs associated with the various strategies being considered. Documentation from a pilot implementation of the RSI approach is available through the FHWA (https://www.fhwa.dot.gov/publications/research/infrastructure/pavements/21006/21006.pdf).
- Sustainability Measures – With an increased focus on identifying long-term sustainable solutions to transportation system needs, agencies may seek to develop new sustainability performance measures in order to properly indicate the impact a proposed solution may have on environmental conditions. The use of a recycling measure for gauging the amount of recycled material used in road construction is an example of this type of measure, as are measures for monitoring carbon dioxide emissions.
- Equity Measures -The increased emphasis on equity, inclusion, and diversity is impacting planning and investment decisions at several transportation agencies. As equity considerations are added, there has been some discussion related to the types of measurable performance measures that can be used without bias toward certain users or modes of transportation. In a case study prepared by the FHWA’s Transportation Asset Management Expert Task Group, a suggestion was made to further explore both quantitative and qualitative performance measures in this area.
TIP
Making performance measures publicly available through reports, scorecards, or dashboards increases transparency into agency operations, which can serve as motivation to improve staff’s desire to meet the standards established, thereby increasing the chance of success.
North Carolina DOT
The North Carolina DOT has an interactive Organizational Performance Scorecard that provides an online indicator of the Department’s success at meeting targets in the following six core goal areas:
- Make Transportation Safer.
- Provide Great Customer Service.
- Deliver and Maintain Infrastructure Effectively and Efficiently.
- Improve Reliability and Connectivity of Transportation Systems.
- Promote Economic Growth Through Better Use of Infrastructure.
- Make NCDOT a Great Place to Work.
An example of how the information is shown; it presents the target for an overall infrastructure health index and the most recent results. As shown by the red “x” in the box on the far right, NCDOT is not currently meeting its target of a health index of 80 percent or more.
North Carolina DOT’s Organizational Performance Scorecard Website – Excerpt
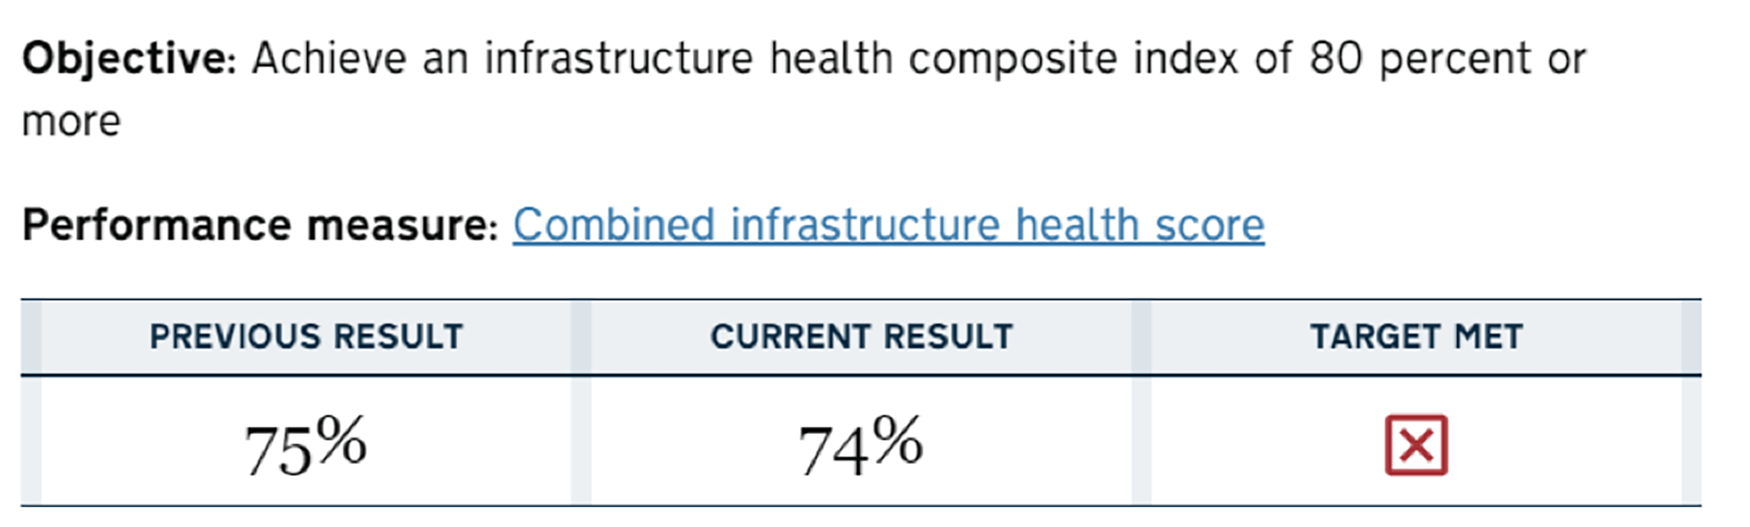
Source: NCDOT. 2019.https://www.ncdot.gov/about-us/our-mission/Performance/Pages/default.aspx
6.1.2
Evaluating the Effectiveness of Performance Measures
Because of the important role performance measures have in supporting performance-based decisions, agencies should use care in selecting measures that drive the right types of results. This section introduces several approaches to evaluate the effectiveness of an agency’s performance measures.
Assessment
TPM Webinar #17 - Agency Innovations and Improvements Blitz
In its handbook for agency executives, AASHTO suggests an assessment of performance measures should consider the following:
- Is the number of performance numbers reasonable? – An agency should retain performance measures addressing critical areas of importance that are maintainable with time. The Maryland and New Mexico DOTs have approximately 80 measures reviewed on a regular basis, but the Florida and Pennsylvania DOTs use approximately 15 to 20 measures to review strategic performance. Some agencies identify a small number (< 10) of KPIs selected from the pool of operational and tactical measures that best reflect an agency’s progress toward achieving its overall goals.
- Are the measures meaningful? – Some agencies choose only to use easily measured performance activities because the information is easy to obtain. However, other measures may do a better job of driving good decision making.
- Does the level of detail in data collection match the level of detail required to drive decisions? – Agencies should balance data availability with the analytic rigor used to make decisions. For instance, if pavement markings are replaced every year, it is not necessary to collect retro-reflectivity information annually. Similarly, collecting data on one lane of a two-lane highway may be enough for approximating the condition across the full width of the roadway.
- Do they support the right decisions? – The performance measures should drive decisions in support of strategic objectives. For example, a performance measure based on the amount of overtime incurred after a snow event is less effective than one able to monitor the number of hours until the roads are cleared.
- Are existing data sources reliable? – In most situations, existing data can provide the information needed for performance management, but it must be reliable and maintained regularly to be useful.
An assessment of performance measures can be important, since many organizations find that over time, the number of performance measures they are managing can become unwieldy.
Pennsylvania DOT
After using performance measures for years, the Pennsylvania DOT recognized that the number of measures being used had increased to a level that was difficult to manage. In 2011, the Pennsylvania DOT conducted an assessment of their performance measures using the following series of questions to guide their decisions as to which measures to keep, which to change, or which to delete:
- Who is using the measure?
- What exactly is being measured?
- Why is this particular measure needed?
- Whose performance is being measured?
- Is the performance goal defined?
- Does a similar measure already exist?
- Is the existing measure meeting the needs and intent or should it be modified?
If a measure was needed where no measure exists, the following additional questions were used:
- Does the measure affect continuous improvement?
- Is the data for the measure updated as frequently as needed? Should it be updated monthly, quarterly, or yearly?
- Is the measure easy to quantify?
- Is the measure easy to understand?
- Is it clear who owns the measure?
- Does the measure provide a means of comparison?
- Have unintended consequences been investigated?
- Can the unintended consequences be successfully mitigated?
The process has helped to ensure that the agency is focused on the right measures to drive desired results and behaviors. The analysis found several issues that could be addressed, including eliminating duplicate or overly complicated measures, modifying measures that were driving unintended consequences, and resolving data quality issues.
SMART Evaluation
As discussed earlier, performance measures are used to set desired or targeted levels of service. Targets may be short-term, such as the 2- and 4-year targets state DOTs are required to submit to FHWA, or they may be long-term targets, such as the desired State of Good Repair (SOGR) serving as the basis for an agency’s TAMP.
Performance targets are evaluated using the “SMART” method, which evaluates whether targets are:
- Specific. The performance is explicitly described.
- Measurable. Progress towards the target can be monitored in a consistent manner.
- Achievable. The target considers past performance, expected changes in demand, available resources and other considerations that make it realistic.
- Relevant (also referenced as results-oriented). The target should be meaningful to the agency and drive the right outcomes.
- Time-related (also referenced as timely or time-bound). There is a stated timeframe for achieving the target.
Nevada DOT
The Nevada DOT recognized that although performance measures were being reported regularly, they were not driving agency policies or decisions. The assessment evaluated the performance measures being used in each of the five key performance areas shown in the figure as well as the organizational culture to support performance management.
The study recommended improvements to emphasize the importance of messaging in order to advance the agency’s performance management culture, extend the performance culture beyond the headquarters office to field staff, and develop job performance plans emphasizing accountability at the division, office and unit levels. The study also recommended the periodic review of performance measures to ensure their continued relevance to agency business processes.
Nevada DOT’s five key performance areas and measures
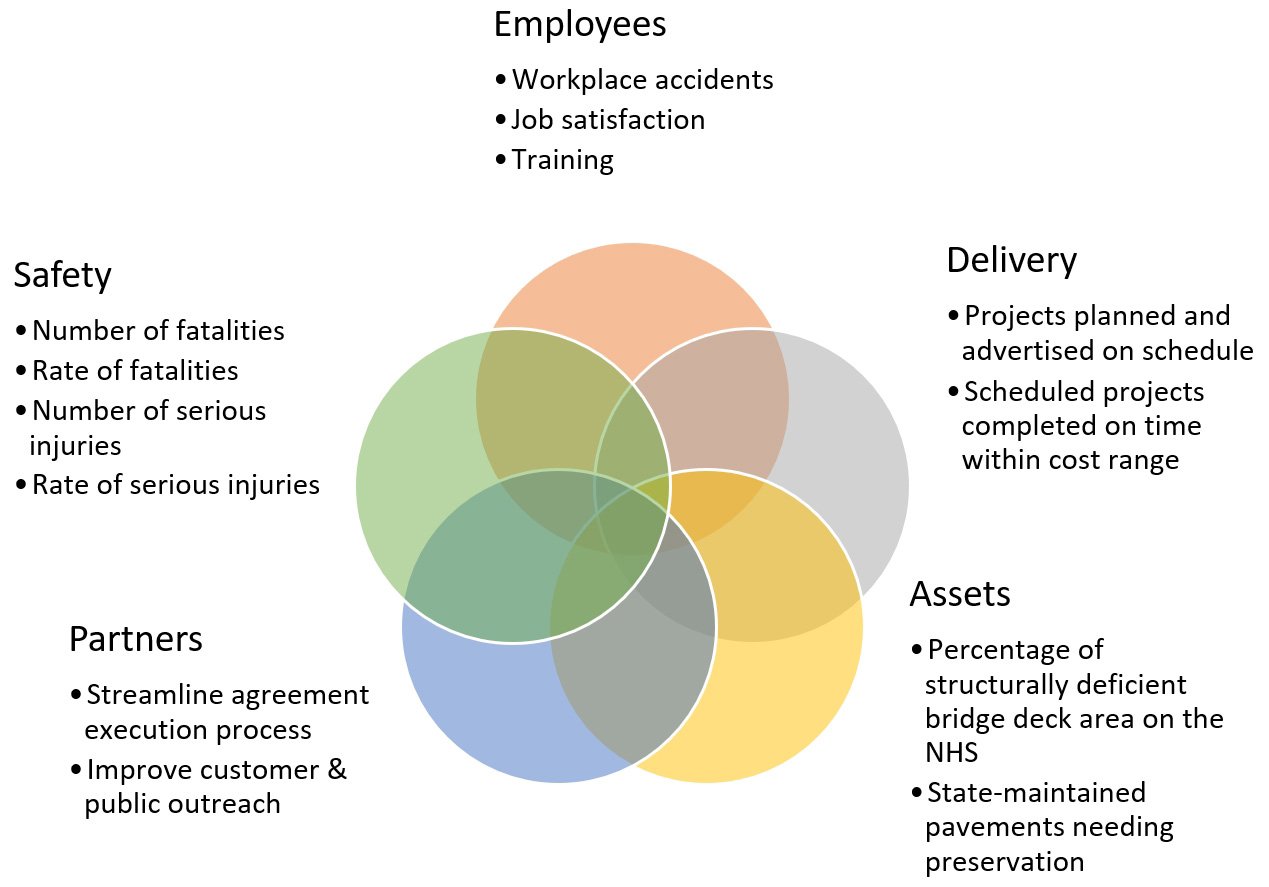
Source: Nevada DOT. 2017. Adapting a Culture for Performance Management at the Nevada Department of Transportation.
Benchmarking
In simple terms, benchmarking is a process of comparing performance and practice among similar organizations as part of an agency’s continuous improvement activities. Benchmarking provides an opportunity to learn about approaches used by high-performing organizations to uncover noteworthy practices, inform target-setting activities, or to foster innovation and improvement within an agency. Benchmarking should focus on improvement and lessons learned rather than as a way to penalize underperformers.
As mentioned in Chapter 1, AASHTO has developed a comparative benchmarking tool for enabling state DOTs to compare performance outcomes and practices with peer agencies as part of their continuous improvement activities (http://benchmarking.tpm-portal.com/). This includes a peer selection tool, so agencies can compare practices to peers with similar characteristics. It also features a performance comparison tool with a number of chart options enabling agencies to compare results. For instance, an agency may elect to compare pavement smoothness characteristics with a neighboring state. There is also a portal to facilitate the exchange of practices among registered DOT users through a Notable Practice Narrative.
An example from the AASHTO TPM Portal showing a comparison of bridge deck percentage determined to be structurally deficient is shown in Figure 6.2. Similar comparisons are available for safety, environmental, and non-motorized (bicycle and pedestrian) performance measures. For transit agencies, Transit Cooperative Research Program (TCRP) Report 141, A Methodology for Performance Measurement and Peer Comparison in the Public Transportation Agency, provides specific guidance for comparing performance with other agencies.
Figure 6.2 Example Performance Comparison from the AASHTO TPM Portal
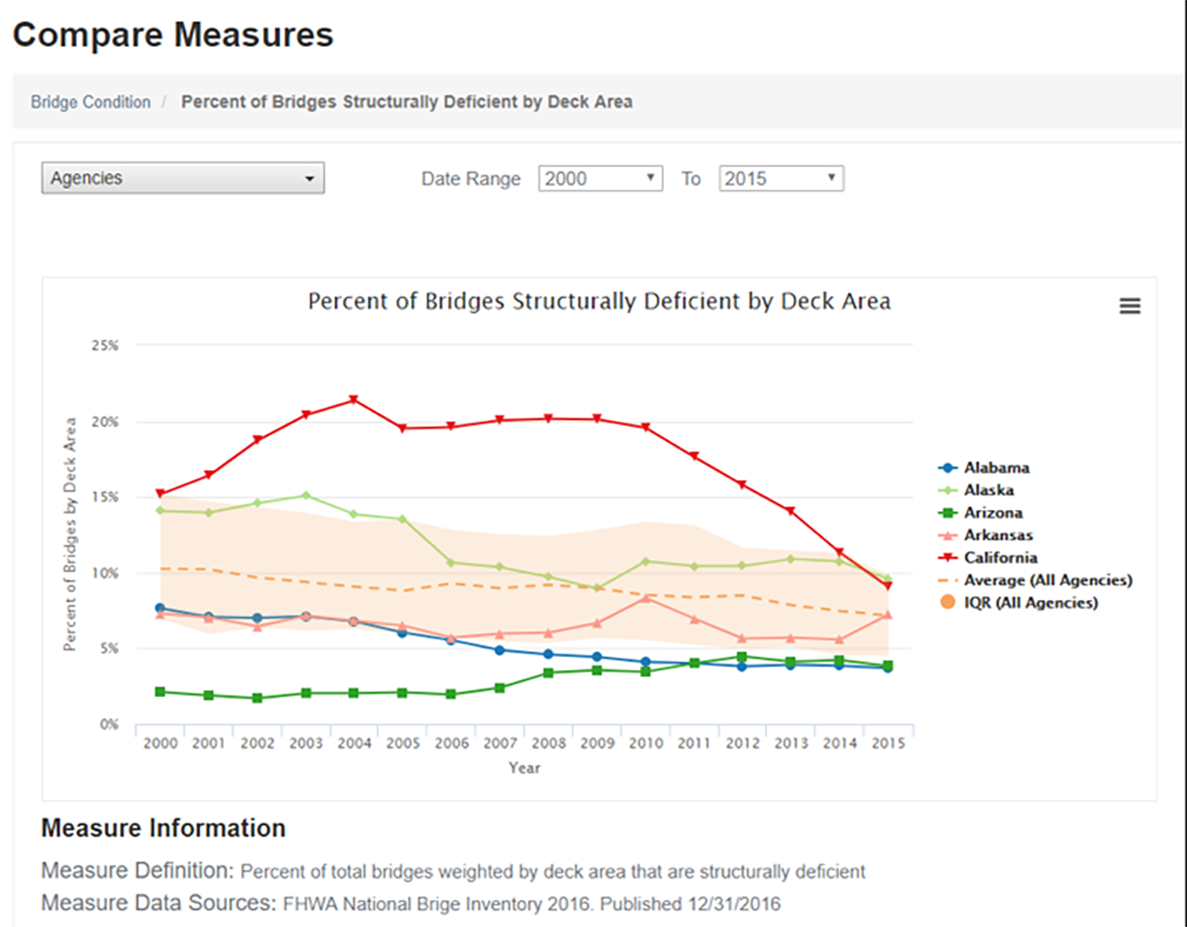
Source: TPM Portal. 2019. http://benchmarking.tpm-portal.com/compare/bridge-condition/deficient-bridges
Audits
Internationally, ISO standards include the conduct of periodic internal audits to help an agency evaluate whether its asset management program and components meet the agency’s needs, adhere to best practices and are being used to support decisions. In addition, agencies use auditing for service providers to confirm contract compliance in situations where road network maintenance and management activities have been outsourced.
TIP
The AASHTO TPM Benchmarking Tool (http://benchmarking.tpm-portal.com/) was designed to assist state DOTs with benchmarking TPM data, providing a data source and comparison tools.
6.1.3
Target Setting Methods
This subsection outlines methods for setting transportation performance targets, focusing on safety, infrastructure condition, reliability, and traffic congestion. It introduces quantitative target-setting approaches, such as policy-based methods, historical trends, probabilistic approaches, statistical models, and summarizes their ease of application, technical robustness, ease of communication, and support for agency policies. The guide also offers suggestions for selecting an appropriate target-setting approach.
Introduction
NCHRP Research Project 23-07, Guide to Effective Methods for Setting Transportation Performance Targets, presents several approaches for setting performance targets to support a TPM framework. It focuses on target setting for the national measures that are required under federal TPM requirements, including:
- Safety measures: Number of fatalities, rate of fatalities, number of serious injuries, rate of serious injuries, number of nonmotorized fatalities and nonmotorized serious injuries.
- Infrastructure condition measures: Percentage of the Interstate system pavements in good and poor condition, percentage of the non-Interstate NHS pavements in good and poor condition, and percentage of the NHS bridges in good and poor condition.
- Reliability (travel time and freight) measures: Percentage of person miles traveled on the Interstate and Non-Interstate NHS that is reliable and truck travel time reliability index.
- Congestion measures: Annual hours of peak hour excessive delay per capita and percentage of non-single-occupancy vehicle travel.
- Target setting for nonrequired measures, such as accessibility, greenhouse gas emissions, active transportation, transit ridership, and customer satisfaction are included in the final section of the guide.
TPM Webinar #12 - Target Setting
Target Setting Approaches
The guide recognizes that transportation agencies take different approaches to target setting. Some may prioritize setting realistic targets based on fiscal constraints. Other agencies may set aspirational (or fiscally unconstrained) or conservative targets.
Regardless of the approach to target setting, the guide recognizes that both quantitative and qualitative approaches may be considered. In some instances, qualitative approaches that are heavily influenced by politics or agency leadership may be appropriate. An annual target to reduce fatalities to address a long-term Vision Zero goal is an example of a qualitative target. Other approaches may use statistics or probabilities to define a quantitative target. The use of travel demand forecasts to set a mobility target illustrates the use of a quantitative approach to target setting. A combination of qualitative and quantitative approaches may also be used to set effective targets.
The following five quantitative methods for setting targets are presented in detail within the guide (Grant, M., et.al. 2023A):
- Policy-based approaches, such as establishing a maximum rate of change (e.g., annual increase of at least 2 percent).
- Historical trends (e.g., set a value based on a 5-year trend).
- Probabilistic and risk-based approaches that consider performance variability (e.g., performance based on the likelihood of increased storm frequency and intensity).
- Statistical models (e.g., rates of deterioration based on regression models).
- Other tools and models (e.g., output from a bridge or pavement management system).
When selecting the appropriate method for target setting, the guide offers the following tips (Grant, M., et al. 2023A):
- Understand the complexity of the methods - some methods require sophisticated data that may not be readily available and may result in marginal improvements in the target's effectiveness.
- Consider combining methods - by using several approaches, an agency has the benefit of considering the results from multiple methods in setting the final target.
The Guide (NCHRP Report 1035) presents several target-setting methods for each of the Federal performance measure categories along with a summary of their ease of use, robustness, ease of communication, and support for agency policies. A high-level synopsis of the information presented in the Guide is presented in the following table.
Table 6.2 - Features associated with different target-setting approaches (based on Grant, M., et.al. 2023A)
| Federal Performance Measure Category | Target Setting Approach | Description | Ease of Application | Technical Robustness | Ease of Communication | Allows for Policy Preference |
|---|---|---|---|---|---|---|
| Safety | Targeted Reduction | Defined decrease from baseline regardless of past trends | H | L | H | H |
| Safety | Time-Series Trend | Based solely on historical performance data | H | M | H | L |
| Safety | Trend Plus Other Factors | Adjustments made to results from other approaches | H | L | M | H |
| Safety | Multivariable Statistical Model | Statistical analysis considering multiple variables | L | H | M | L |
| Infrastructure Condition | Target Based on Change in Condition | Consensus decision | H | None | L | H |
| Infrastructure Condition | Time-Series Trend | Based solely on historical performance data | H | L | M | M |
| Infrastructure Condition | Time-Series Trend Plus Future Funding | Historical trends extrapolated into the future | H | L | M | M |
| Infrastructure Condition | Asset Management System | Condition forecasts based on expected funds | L | H | M | M |
| Infrastructure Condition | Scenario Analysis | Management system analysis of multiple scenarios | L | H | M | M |
| Reliability | Building off the Baseline with Assumptions | Qualitative approach to adjusting baseline values | H | L | H | M |
| Reliability | Time-Series Trend Analysis | Based solely on historical performance data | H | M | M | M |
| Reliability | Trend Plus Other Factors | Adjustments made to results from other approaches | H | M | M | M |
| Reliability | Performance Risk Analysis | Statistical analysis of variations due to risks | M | H | M | M |
| Reliability | Segment Risk Analysis | Analysis of individual segments to determine those that shift between reliable and unreliable | L | H | M | M |
| Reliability | Multivariable Statistical Model | Statistical analysis considering multiple variables | L | H | L | L |
| Traffic Congestion | Building off the Baseline with Assumptions | Qualitative approach to adjusting baseline values | H | L | H | H |
| Traffic Congestion | Time-Series Trend Analysis | Based solely on historical performance data | M | M | M | M |
| Traffic Congestion | Trend Plus Other Factors | Adjustments made to results from other approaches | M | M | H | H |
| Traffic Congestion | Travel Forecasting Model | Model used to estimate excessive delay for the base year and forecasted year | H | M | M | L |
| Traffic Congestion | Policy Based | Model based on regional policy goals | H | L | H | H |
Features Summary (L=Low, M=Medium, H=High)
New Jersey DOT
NCHRP Web-Only Document 358, which is a supplemental report to the Guide to Effective Methods for Setting Transportation Performance Targets, provides examples documenting how target-setting methods are being used by various transportation agencies. One of the examples illustrates how the New Jersey DOT piloted the use of a scenario analysis approach for setting its pavement infrastructure condition targets. An important consideration in the use of this approach was the availability of a pavement management system (PMS) capable of forecasting future pavement conditions. However, the New Jersey DOT had not established prediction models for the Federal cracking metric, so methods were developed to correlate forecasted conditions from existing models to the Federally-required cracking metric. Correlations were developed using three years of condition data collected in accordance with both the agency’s legacy Condition Status rating and the Federal measures in 0.1-mi segment lengths. Using both sets of data, correlations were developed based on the likelihood that a pavement section rated “Good” using the agency’s CS rating would also be classified as a “Good” pavement using the Federal definitions. The correlations found that 88.43 percent of the segments were rated “Good” based on both approaches (Grant, M., et.al. 2023B). A similar approach was used to correlate “Poor” conditions, but the analysis showed more variability in correlating segments at this condition level. To address the variability, New Jersey DOT decided to use 3-year averages to establish the final correlations, which are presented below (Grant, M., et.al. 2023B).
Table 6.A - Correlation between NJDOT CS and Federally-mandated condition ratings (Grant, M., et.al. 2023B)
| Federal Good | Federal Fair | Federal Poor | |
|---|---|---|---|
| NJDOT Good | 87.5% | 13.78% | 0.00% |
| NJDOT | 23.74% | 76.25% | 0.01% |
| NJDOT | 6.36% | 86.02% | 7.62% |
The correlations were applied to the predicted conditions generated by the PMS to determine the expected conditions using the Federally-mandated performance measures. Several scenarios were generated, allowing the NJDOT to use the results to set realistic Federal targets.
Addressing Disruptions to Performance in Target Setting
It is inevitable that agencies will face events that disrupt what might be expected to be typical performance. Sometimes these events alter performance for a short period of time before performance returns to typical patterns. In other situations, the event may alter performance for a long period of time, as the changes associated with working from home following the COVID-19 pandemic have had on traffic patterns, congestion, and safety. The guide provides examples illustrating times when an agency might choose to include or exclude the disruption or use the disruption to alter previous performance patterns.
Arizona DOT
In 2001, during the development of a long-range transportation plan (LRTP), the Arizona DOT took a strategic approach to how investments should be made. Under the new approach, Arizona DOT established the following three investment categories:
- Preservation, including activities that preserve existing transportation infrastructure.
- Modernization, including improvements that upgrade the efficiency, functionality, and safety without adding capacity.
- Expansion, including improvements that add transportation capacity by adding new facilities or services.
To implement the new initiative, the Arizona DOT developed a report titled “Linking the Long-Range Transportation Plan and Construction Program” or "P2P Link” that applied financial constraints to the long-term vision. Through a collaborative process that involved a consultant, local and regional governments, and transit agencies, the Arizona DOT published an implementation plan for putting the P2P Link into practice. The resulting process includes scoring projects based on both a technical and policy score that are added together to determine a project’s ranking. The technical score is generated by the asset owner based on an analysis of the data while the policy score is determined based on each project’s contribution to LRTP goals and performance measures. The process helps to ensure that projects are ranked in accordance with the agency’s strategic objectives using only the most meaningful criteria in a transparent and defensible way.
Arizona DOT’s Link Between Strategic Objectives and Investment Decisions
Source: ADOT. 2014. Linking the Long-Range Plan and Construction Program P2P Link Methodologies & Implementation Plan.
https://azdot.gov/sites/default/files/2019/08/p2p-methodologies-implementation.pdf
North Carolina DOT
The North Carolina DOT authorizes its divisions to determine how funding will be used for maintenance activities and uses performance data to assist with this activity. Each year, Division Engineers submit annual plans detailing what work will be accomplished; these plans are reviewed quarterly with the Chief Engineer to discuss actual versus planned work. Their accomplishments are also displayed in a dashboard for internal use, as shown in the following image. Public-facing dashboards are also available showing overall conditions and performance trends. The Division Engineers are also held accountable for their performance, since their planned and actual performance data are incorporated into their annual evaluations.
Source: Leading Management Practices in Determining Funding Levels for Maintenance and Preservation. Scan Team Report, NCHRP Project 20-68A, Scan 14-01, National Cooperative Highway Research Program, May 2016.
Washington DOT
The Washington DOT uses its Maintenance Accountability Process (MAP) to comprehensively manage maintenance budgets and to communicate the impacts of policy and budget to both internal and external stakeholders. Field condition surveys are conducted annually to assess the condition of 14 assets on the highway system such as signs and signals, ITS assets, tunnels, and highway lighting. For each asset, a level of service target is established, based on expected funding levels and importance of the asset to the agency’s strategic objectives. The targeted and actual performance is summarized on a statewide basis and presented to the legislature, media, internal stakeholders, and other DOTs in a format similar to what is shown in the figure (https://www.wsdot.wa.gov/NR/rdonlyres/8EC689DF-9894-43A8-AA0F-92F49AC374F5/0/MAPservicelevelreport.pdf). In 2018, Washington State DOT achieved 77 percent of its highway maintenance targets. Targets that were not achieved are shown as red bullseyes and areas where the targets were exceeded include a checkmark with the bullseye. The results illustrate where additional investment is needed on a statewide basis and provides a basis for setting maintenance priorities during the year.
Targeted and Actual Performance Results Used to Set Maintenance Priorities
Source: WSDOT. 2017. Multimodal Asset Performance Report. Washington State DOT. https://wsdot.wa.gov/publications/fulltext/graynotebook/Multimodal/AssetPerformanceReport_2017.pdf
Washington DOT
To support accountability, credibility, and transparency, the Washington State DOT publishes its quarterly performance report, referred to as The Gray Notebook. Each edition of the Gray Notebook presents updates on multimodal systems' and programs' key functions and analysis of performance in strategic goal areas based on information reported to the Performance Management and Strategic Management offices of the Transportation Safety and Systems Analysis Division. Washington State DOT also publishes its Gray Notebook Lite, which highlights key metrics referenced in the Gray Notebook in a format for quick reading. Examples from each of these documents are presented in the figures.
The Gray Notebook and the Gray Notebook Lite
Source: WSDOT. 2019. https://wsdot.wa.gov/about/accountability/gray-notebook
Virginia DOT
Performance dashboards are also a popular way to present progress, using color-coded indicators similar to those on the dash of an automobile. An example of the interactive dashboard available from the Virginia DOT is shown in the figure. The screen reports performance in seven areas (performance, safety, condition, finance, management, projects, and citizen survey results) and the needles indicate whether the performance is within targeted ranges. Hyperlinks are available in each area if a user wants to explore historical trends or explore performance objectives in more detail.
Virginia DOT's Performance Dashboard
Source: Virginia DOT. 2019. http://dashboard.virginiadot.org/
North Carolina DOT
The North Carolina DOT has an interactive Organizational Performance Scorecard that provides an online indicator of the Department’s success at meeting targets in the following six core goal areas:
- Make Transportation Safer.
- Provide Great Customer Service.
- Deliver and Maintain Infrastructure Effectively and Efficiently.
- Improve Reliability and Connectivity of Transportation Systems.
- Promote Economic Growth Through Better Use of Infrastructure.
- Make NCDOT a Great Place to Work.
An example of how the information is shown; it presents the target for an overall infrastructure health index and the most recent results. As shown by the red “x” in the box on the far right, NCDOT is not currently meeting its target of a health index of 80 percent or more.
North Carolina DOT’s Organizational Performance Scorecard Website – Excerpt
Source: NCDOT. 2019.https://www.ncdot.gov/about-us/our-mission/Performance/Pages/default.aspx
Pennsylvania DOT
After using performance measures for years, the Pennsylvania DOT recognized that the number of measures being used had increased to a level that was difficult to manage. In 2011, the Pennsylvania DOT conducted an assessment of their performance measures using the following series of questions to guide their decisions as to which measures to keep, which to change, or which to delete:
- Who is using the measure?
- What exactly is being measured?
- Why is this particular measure needed?
- Whose performance is being measured?
- Is the performance goal defined?
- Does a similar measure already exist?
- Is the existing measure meeting the needs and intent or should it be modified?
If a measure was needed where no measure exists, the following additional questions were used:
- Does the measure affect continuous improvement?
- Is the data for the measure updated as frequently as needed? Should it be updated monthly, quarterly, or yearly?
- Is the measure easy to quantify?
- Is the measure easy to understand?
- Is it clear who owns the measure?
- Does the measure provide a means of comparison?
- Have unintended consequences been investigated?
- Can the unintended consequences be successfully mitigated?
The process has helped to ensure that the agency is focused on the right measures to drive desired results and behaviors. The analysis found several issues that could be addressed, including eliminating duplicate or overly complicated measures, modifying measures that were driving unintended consequences, and resolving data quality issues.
Nevada DOT
The Nevada DOT recognized that although performance measures were being reported regularly, they were not driving agency policies or decisions. The assessment evaluated the performance measures being used in each of the five key performance areas shown in the figure as well as the organizational culture to support performance management.
The study recommended improvements to emphasize the importance of messaging in order to advance the agency’s performance management culture, extend the performance culture beyond the headquarters office to field staff, and develop job performance plans emphasizing accountability at the division, office and unit levels. The study also recommended the periodic review of performance measures to ensure their continued relevance to agency business processes.
Nevada DOT’s five key performance areas and measures
Source: Nevada DOT. 2017. Adapting a Culture for Performance Management at the Nevada Department of Transportation.
New Jersey DOT
NCHRP Web-Only Document 358, which is a supplemental report to the Guide to Effective Methods for Setting Transportation Performance Targets, provides examples documenting how target-setting methods are being used by various transportation agencies. One of the examples illustrates how the New Jersey DOT piloted the use of a scenario analysis approach for setting its pavement infrastructure condition targets. An important consideration in the use of this approach was the availability of a pavement management system (PMS) capable of forecasting future pavement conditions. However, the New Jersey DOT had not established prediction models for the Federal cracking metric, so methods were developed to correlate forecasted conditions from existing models to the Federally-required cracking metric. Correlations were developed using three years of condition data collected in accordance with both the agency’s legacy Condition Status rating and the Federal measures in 0.1-mi segment lengths. Using both sets of data, correlations were developed based on the likelihood that a pavement section rated “Good” using the agency’s CS rating would also be classified as a “Good” pavement using the Federal definitions. The correlations found that 88.43 percent of the segments were rated “Good” based on both approaches (Grant, M., et.al. 2023B). A similar approach was used to correlate “Poor” conditions, but the analysis showed more variability in correlating segments at this condition level. To address the variability, New Jersey DOT decided to use 3-year averages to establish the final correlations, which are presented below (Grant, M., et.al. 2023B).
Table 6.A - Correlation between NJDOT CS and Federally-mandated condition ratings (Grant, M., et.al. 2023B)
| Federal Good | Federal Fair | Federal Poor | |
|---|---|---|---|
| NJDOT Good | 87.5% | 13.78% | 0.00% |
| NJDOT | 23.74% | 76.25% | 0.01% |
| NJDOT | 6.36% | 86.02% | 7.62% |
The correlations were applied to the predicted conditions generated by the PMS to determine the expected conditions using the Federally-mandated performance measures. Several scenarios were generated, allowing the NJDOT to use the results to set realistic Federal targets.