Topic: Maintenance and Preservation
Maintenance and Preservation
This page features information on maintaining and preserving assets. Whether you are defining condition and performance measures or monitoring the state of your assets, you will find what you need here.
Overview:
Maintenance and preservation activities serve vital roles in supporting the lifecycle management of infrastructure assets. Preservation activities are performed to prevent or address asset deterioration, extending the functional life of the asset. Maintenance encompasses a wide range of activities that are delivered at every stage of an asset’s life cycle. Some maintenance activities prevent, delay, or correct deterioration or damage to assets. Other maintenance activities are done to ensure assets perform as they were designed.
Neither maintenance nor preservation activities enhance the capacity, strength, or performance of an asset beyond its original design. These actions, nonetheless, significantly enhance the overall performance or condition of the transportation facility. The spectrum of maintenance and preservation activities encompasses strategic planning, the establishment of performance metrics, regular monitoring of asset conditions, data collection and documentation, data storage and management, and the delivery of work.
Key Concepts:
Asset condition measures are fundamental components of transportation asset management. While the specific metric used to assess the condition of each asset can vary greatly, they support common functions within asset management analysis and decision making. Condition measures serve as crucial determinants of an asset's remaining useful service life, performance capabilities, and maintenance needs. They are used to predict when an asset may require maintenance, rehabilitation, repair, renewal, or replacement, enabling agencies to allocate resources efficiently and minimize costly downtime. Moreover, asset condition plays a pivotal role in assessing operational risks associated with asset failure, optimizing maintenance schedules, ensuring regulatory compliance, and evaluating long-term asset strategies, all of which are essential for effective and cost-efficient transportation asset management practices.
Transportation infrastructure deterioration refers to the decline in the physical condition or functionality of transportation assets, such as roads, bridges, railways, and airports, over time due to exposure to factors such as weather, traffic, environmental stressors, and natural wear and tear. It encompasses the deterioration of structural components, surface quality, safety features, and overall operational efficiency.
Life cycle management is a strategic investment approach that carefully considers options such as maintenance, renewal, repair, or replacement throughout an asset's operational lifespan, with the primary goals of optimizing the asset's service life while minimizing risks and costs. This approach relies on data related to asset condition, available treatment alternatives, cost analyses, deterioration patterns, replacement schedules, and other pertinent factors to assess the trade-offs among various investment strategies to optimize the type and timing of treatments.
Life cycle management encompasses various approaches tailored to different types of assets. Each approach caters to specific asset types and their unique maintenance needs.
- Condition-based management revolves around assessing an asset's condition to predict and preempt failures.
- Interval-based (i.e., cyclical) management is typically applied to operational assets like striping, signs, and guardrails, where condition assessments may be impractical. It relies on time intervals or manufacturer-recommended lifespans to determine when to perform interventions.
- Reactive management defers actions until an asset reaches an unacceptable condition, often reserved for low-value or redundant assets. Defining minimum condition thresholds and ensuring timely response mechanisms are essential for this approach, which is used for assets like fences, lighting, and impact attenuators.
- Lastly, some strategies use risk assessments as direct measures to set objectives, make decisions, or gauge progress, particularly when an asset's condition doesn't directly reflect its performance level, and the broader impact on system performance needs consideration. This approach is prevalent in managing geotechnical assets like slopes.
Maintenance Level of Service (MLOS) is a framework used by transportation agencies to systematically assess and manage the condition and performance of diverse assets and features, such as roadways, bridges, drainage systems, vegetation, and more. The framework allows agencies to compare disparate assessments of condition (e.g., height of turn, pieces of litter present, or sign visibility) on a common scale, by associating each measure to a common scale. Typically, the common scale is a letter-grade rating. This uniform grading system ensures consistency in rating performance across various services and geographic regions and facilitates effective communication with stakeholders through visual representations. MLOS can operate on an outcome-based approach, focusing on maintenance results rather than just budgetary and planning inputs, allowing agencies to predict achievable service levels based on budgetary decisions and adjust maintenance priorities and budgets annually to meet evolving system needs and stakeholder expectations.
Reliability centered maintenance (RCM) is a systematic approach used to select the most suitable maintenance strategies for complex assets based on safety, operational efficiency, and economic considerations. By analyzing assets from an RCM perspective, agencies can enhance cost-effectiveness, reliability, asset longevity, and risk understanding. Using RCM the asset owner determines the overall approach for establishing the appropriate timing of maintenance treatments, e.g., condition-based, cyclical, or reactive. RCM defines a comprehensive maintenance regimen by preserving critical functions through cost-effective tasks while addressing dominant failure causes.
Implementation Considerations:
- Formulate well-defined agency policies and objectives, rooted in strategic planning informed by historical insights, expert assessments, and established agency protocols.
- Establish practices for collecting, managing, and safeguarding asset inventory and condition data.
- Use RCM to establish a lifecycle approach for each asset class.
- Develop specific criteria to assess and report the condition of each asset class.
- Use historical data to develop performance models and expectations to facilitate forecasting and scenario analysis.
Related Subsections:
Defining Life Cycle Management 4.1.1
Through life cycle management, agencies employ data on asset condition, treatment options, costs, deterioration rates, replacement cycles, and other factors to determine the most cost-effective, long-term strategies for managing assets throughout their lives.
All transportation infrastructure assets have a life cycle, which includes several stages from initial construction to removal or replacement (see figure 4.1). Life cycle management is an investment approach that considers maintenance, renewal, replacement, or repair options through an asset’s service life with the intent to maximize the benefit provided by the asset at the minimum practicable cost. It employs data on asset condition, treatment options, costs, deterioration rates, replacement cycles, and other factors to evaluate trade-offs between possible investment strategies and treatment timings. Effective life cycle management requires knowledge of the agency’s strategic priorities and an understanding of the performance criteria driving investment decisions, so the right management strategy can be identified and implemented for each asset class. Aligning asset management measures with agency priorities ensures the investments made to extend asset service life provide the maximum impact to the agency’s long-term goals.
Figure 4.1 illustrates a variety of interventions that occur over an asset life cycle. The larger circles represented in the figure are service life altering, and represent a capital investment in infrastructure. Capital investments provide significant life extension, and may alter or enhance the operational nature of the asset, e.g. expand capacity, without fully replacing the asset. Maintenance (reactive, interval based and routine) activities are required throughout the life cycle to ensure the asset achieves its service life.Preservation treatments restore condition or performance to achieve service life, and may extend service life as well, but do not significantly alter the operational nature of the asset. Some agencies may capitalize investment in these preservation activities; however, regardless of the timing and character of the selected interventions, all of them are part of the life cycle management process. More (lower cost) maintenance interventions can offset the number and cost of the larger (and more costly) interventions. Balancing the right intervention, at the right time, can greatly reduce the overall investment needed for infrastructure to be reliably available for providing service.
Figure 4.1 Stage of an Asset Life Cycle
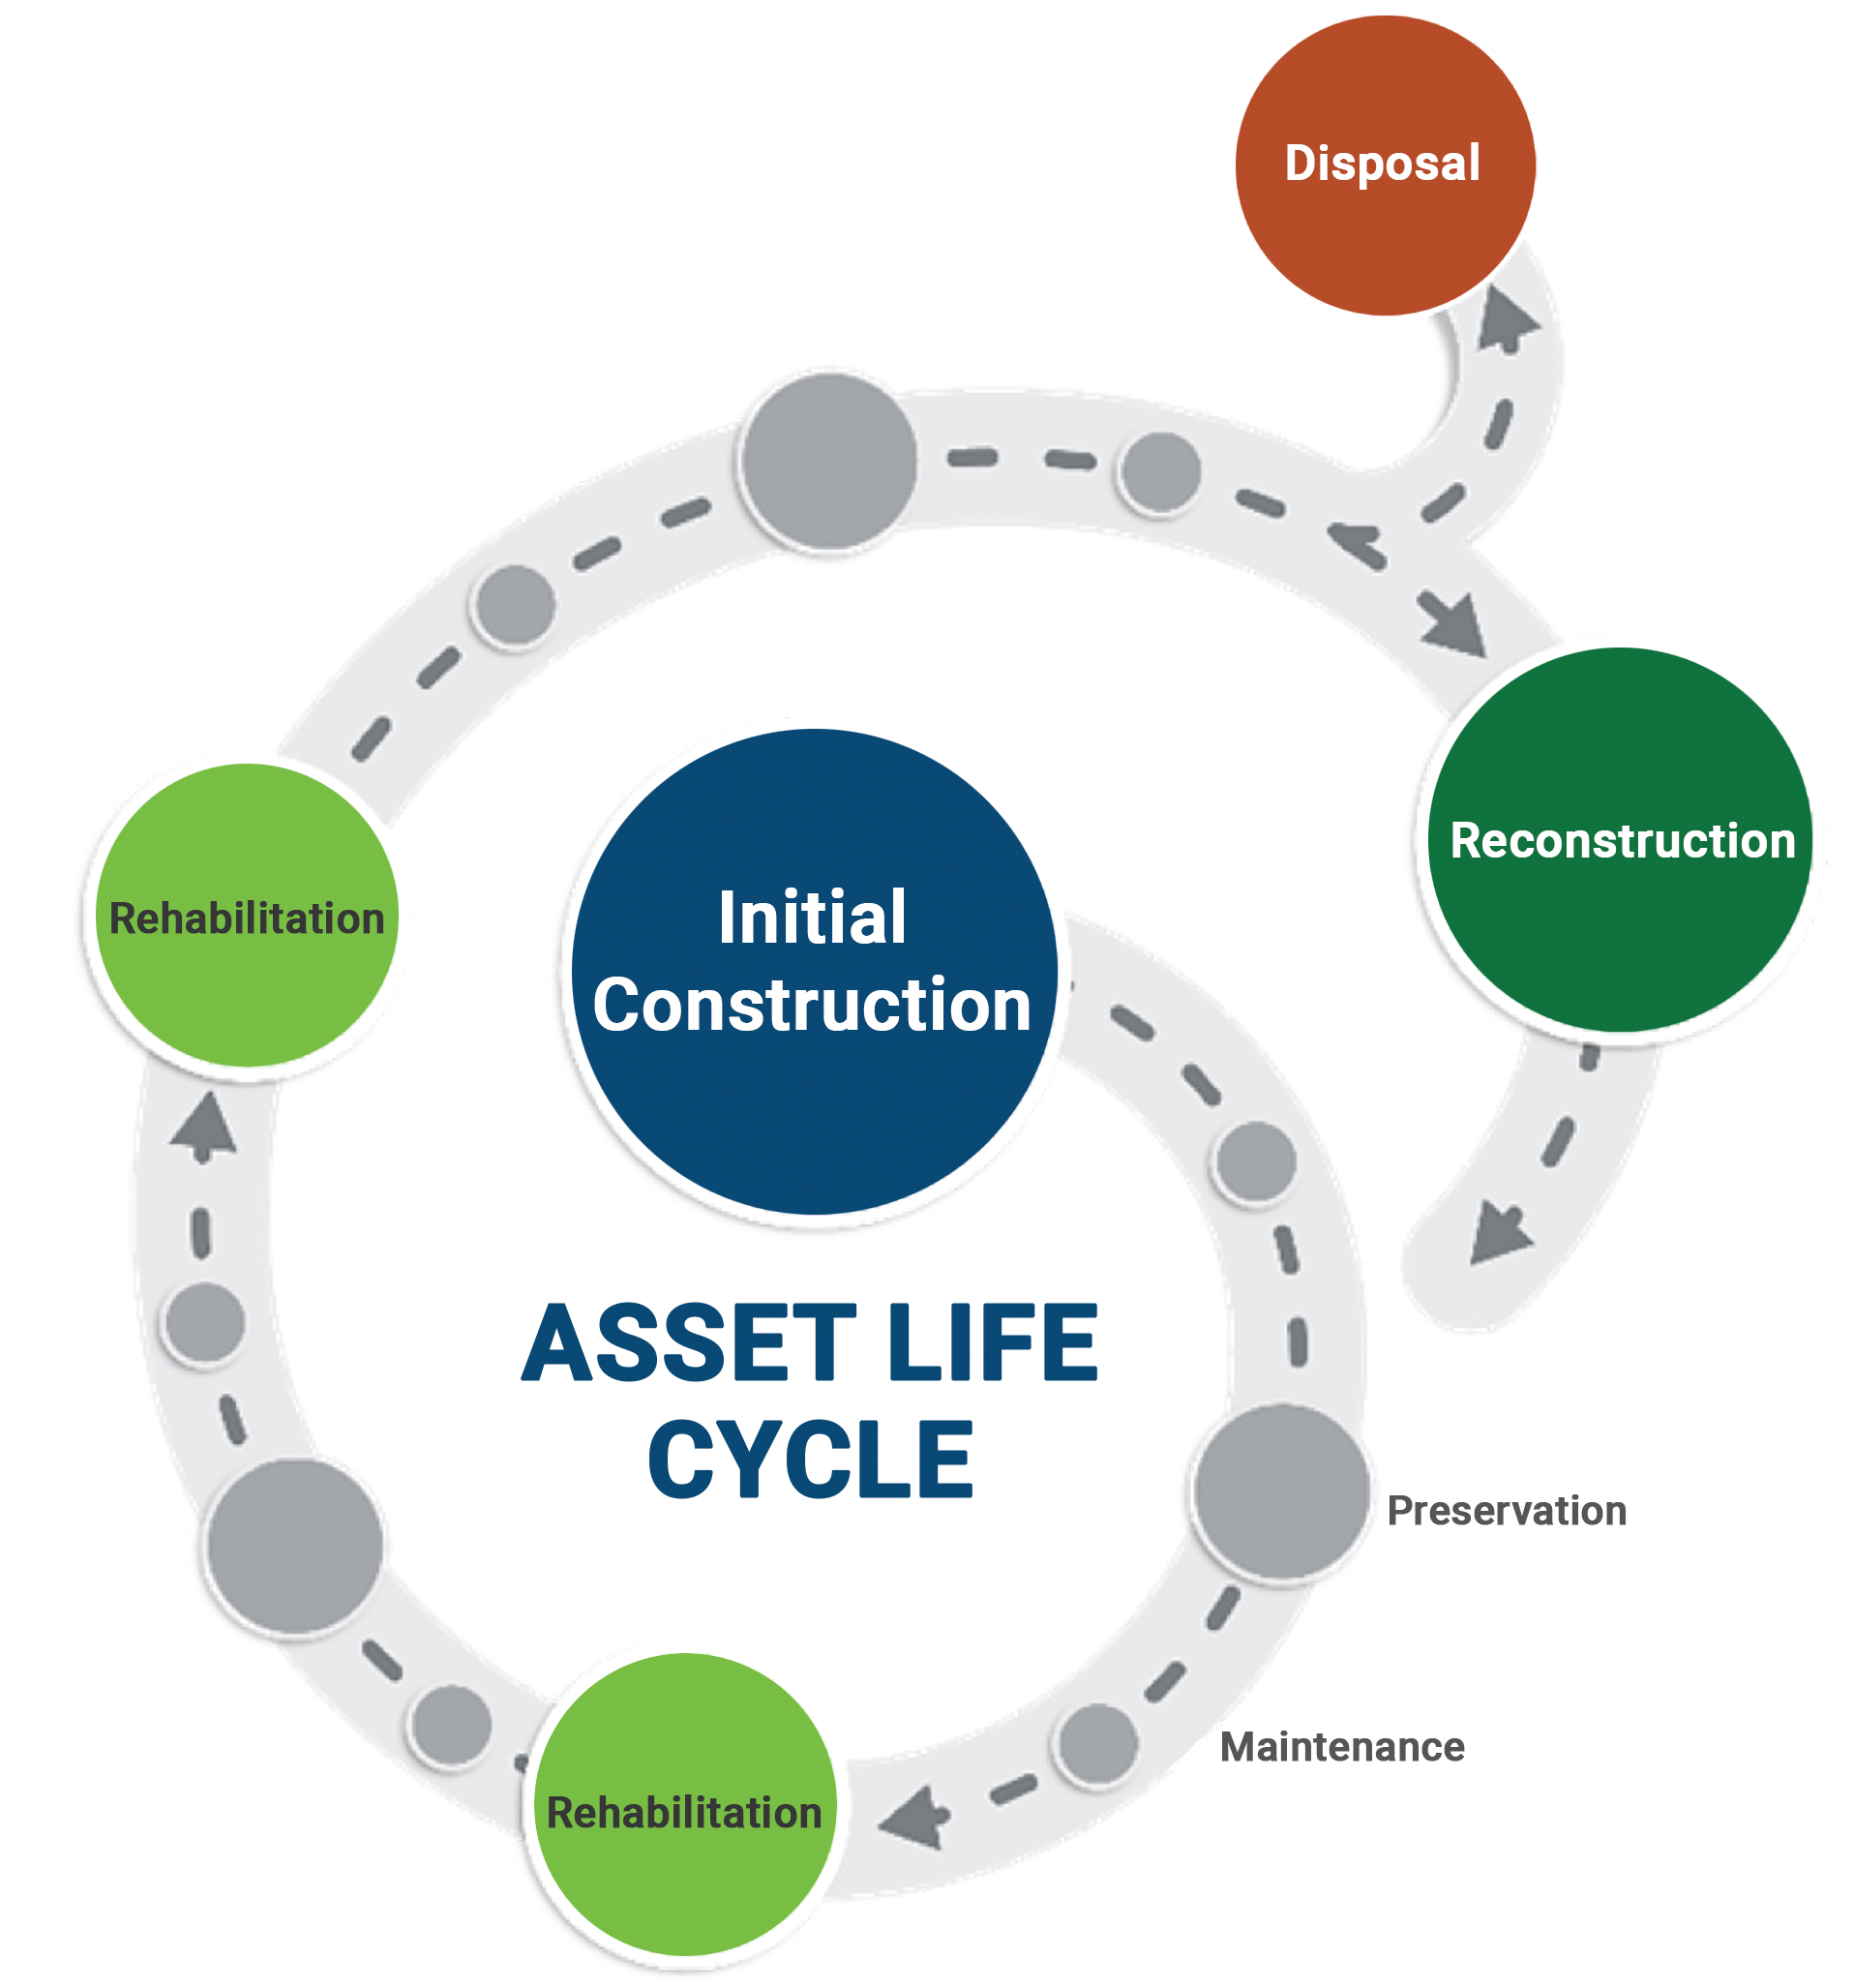
Source: Applied Pavement Technology, Inc. 2017
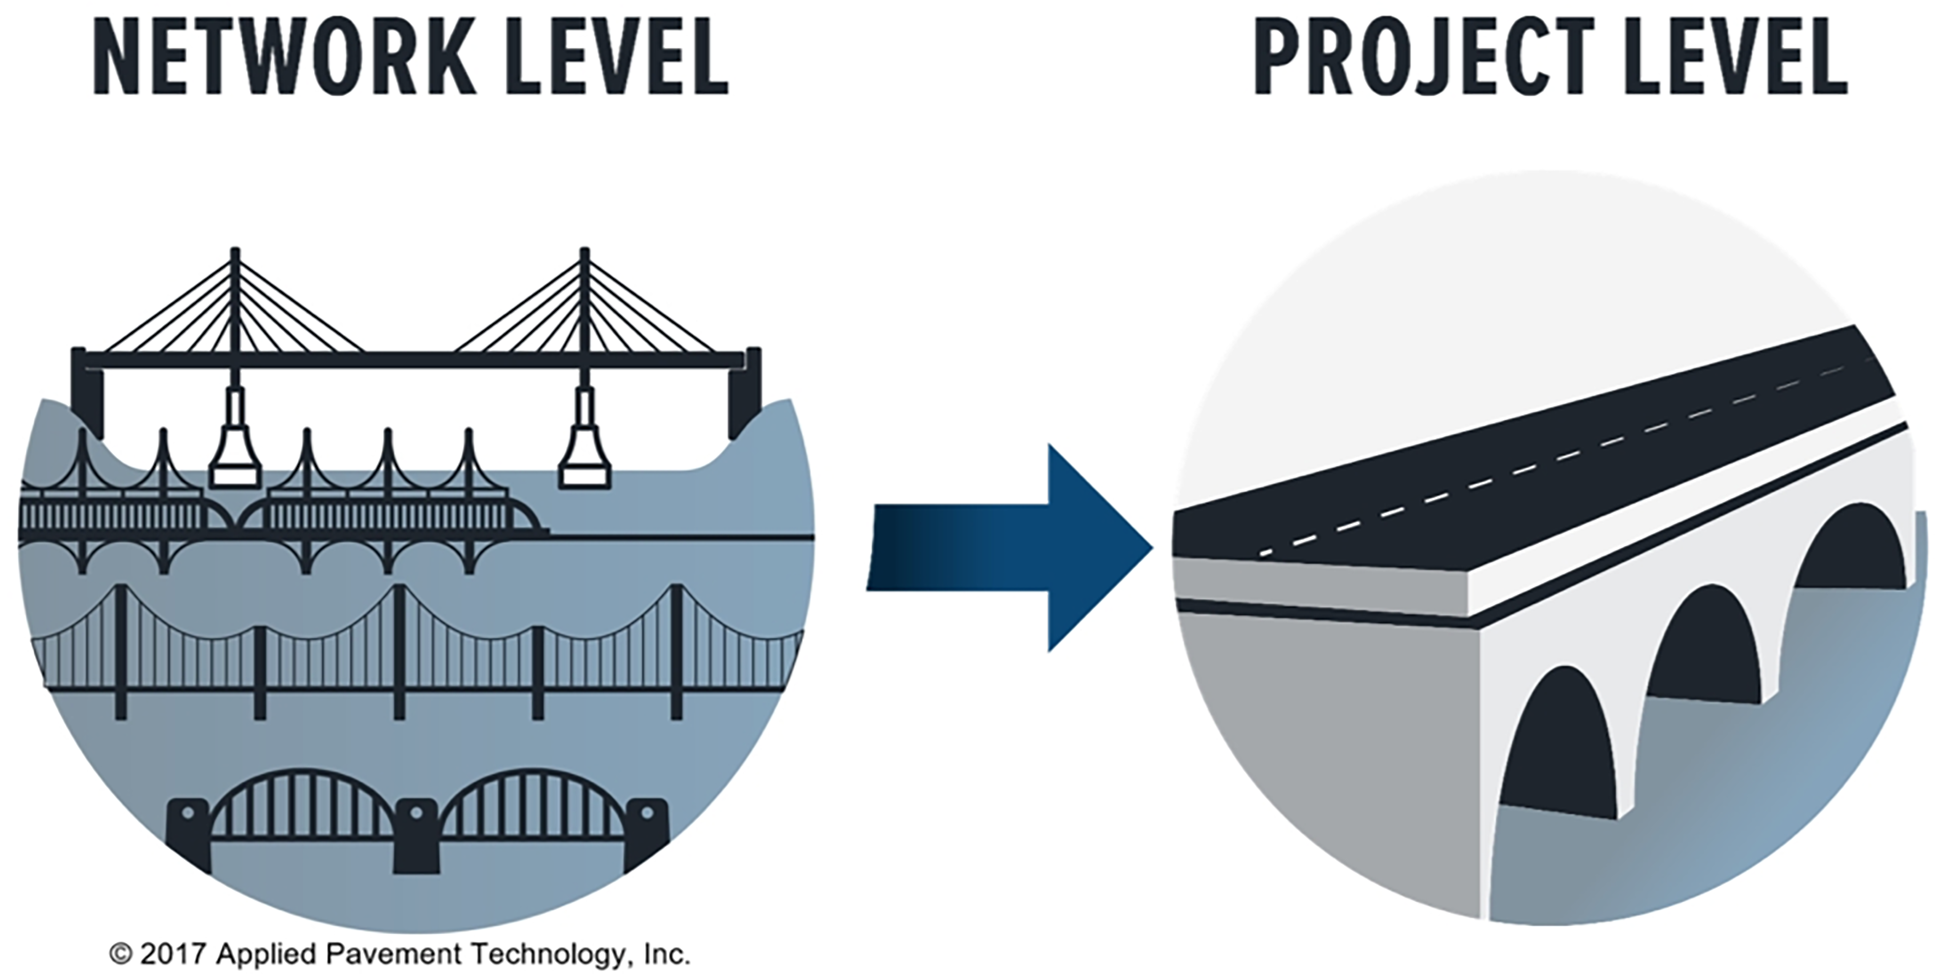
Life cycle management can be used at both network level and at project level. At network-level, life cycle management considers the needs of an entire asset class, as well as the available funding, to determine the most appropriate life-cycle strategies. For example, analysis can establish the optimal proportions of overall investment that should be allocated to different types of interventions over the network, to minimize investment to achieve performance targets or an average condition level. At a project level, life cycle management is commonly used to develop asset-specific strategies. Project level life cycle plans provide input into the network level life cycle plans. Large bridges or other distinct network components are often planned and managed in this manner.
Life Cycle Cost Analysis (LCCA) is an engineering-economics approach that can be used to quantify the differential costs of alternative design approaches. Network level life cycle management, while a more wholistic process that manages every stage of an asset’s life, may employ LCCA or other forms of analysis to inform management decision-making. Figure 4.2 highlights some of the major differences between life cycle management and life cycle cost analysis. At the network level, LCCA can be used to understand how to best manage the network as it ages. At a project level, it is used to understand what are the most effective actions to be taken on the assets within the project scope at the time of project delivery. Both network level and project level analyses contain many aspects of engineering economic analysis, such as consideration of user benefits, user costs, and the time-value of money to identify alternatives that represent the lowest practicable life cycle cost over the analysis period to achieve the desired objectives.
Figure 4.2 Attributes of network level life cycle management and project level life cycle cost analysis
- High level.
- One asset class or subclass.
- Multiple locations.
- Looks at impacts of varied treatment timing.
- Considers future cost changes.
- Detailed.
- Multiple asset classes.
- Single location.
- Treatment timing fixed for all options.
- Uses discount rate.
Source: Applied Pavement Technology, Inc. 2017
Decision Making Context
Life cycle management is driven by the need for owners to provide consistent service to those that use the transportation system with the resources available. Infrastructure decision making can take place at several levels within an organization, and in each case, considers different but often interrelated factors. These are illustrated in table 4.1.
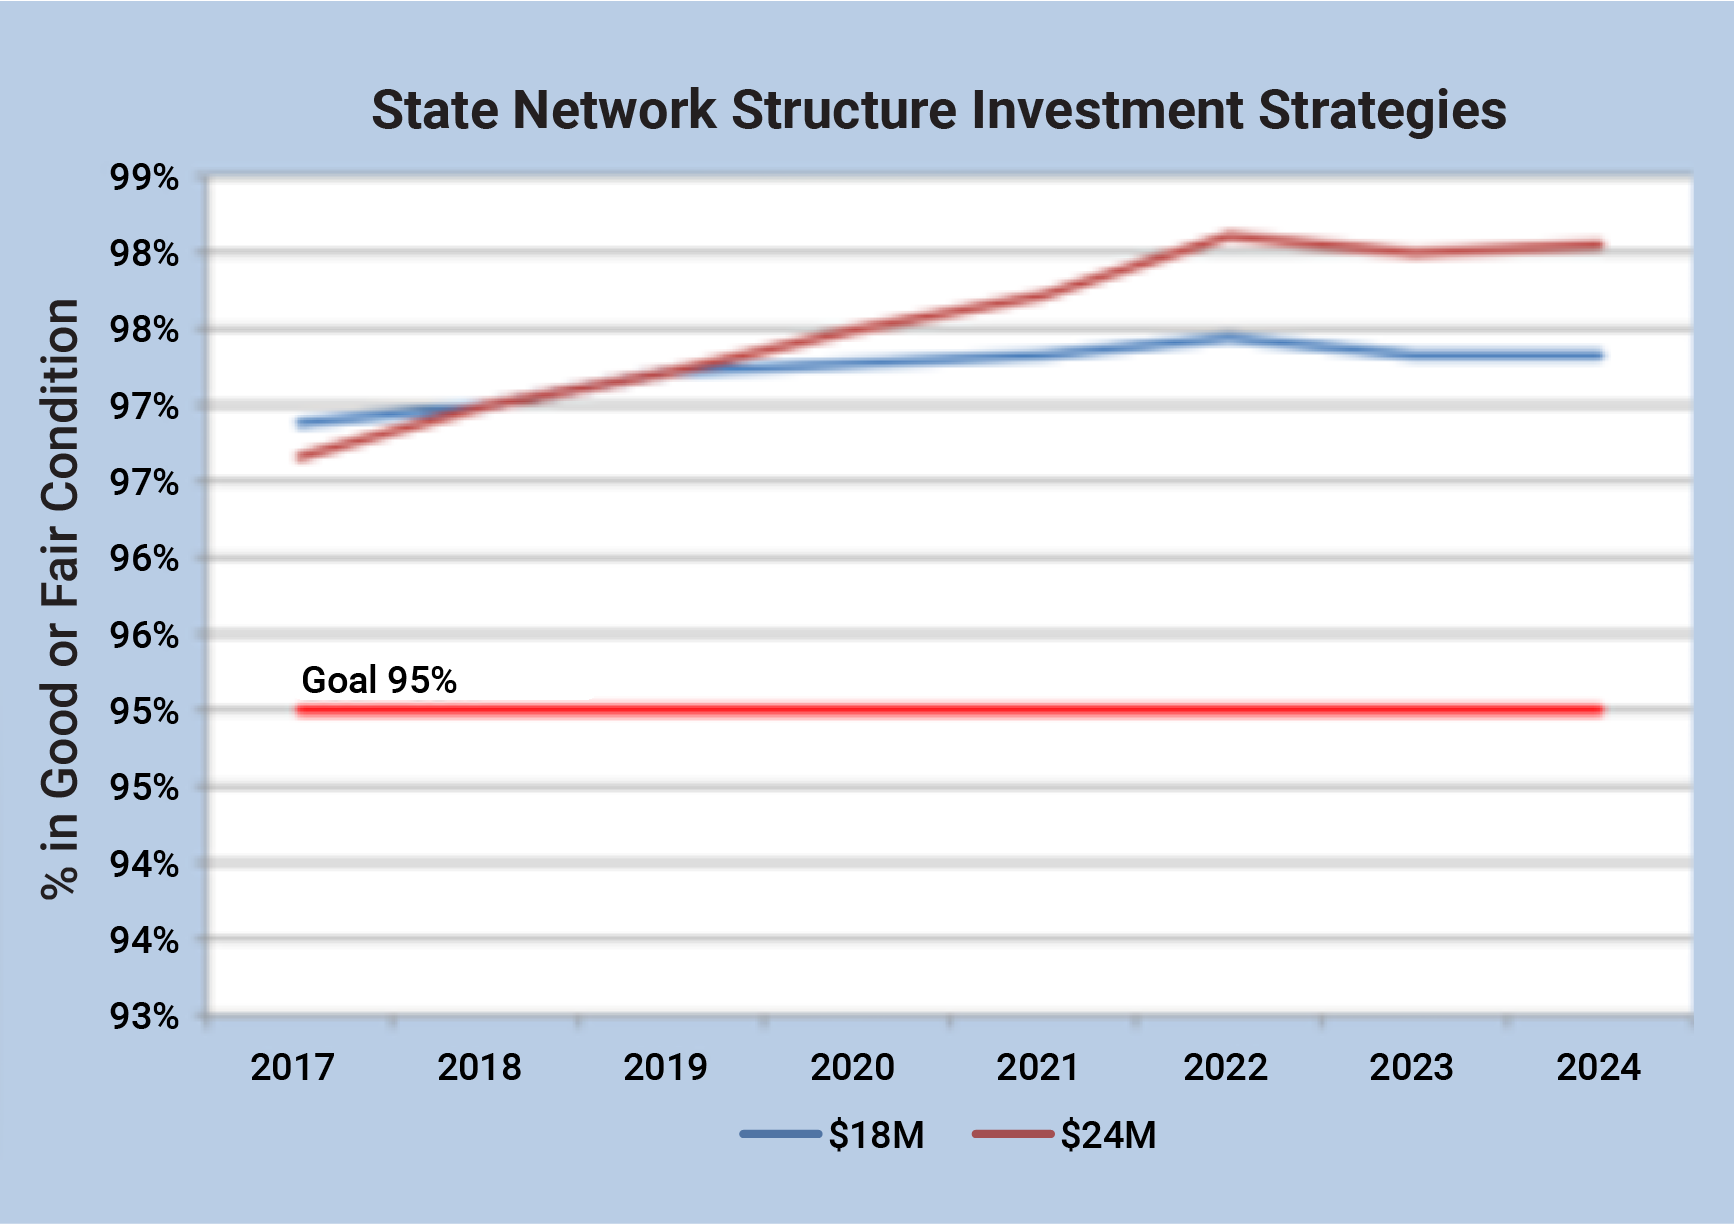
Figure 4.3 Analysis of KYTC Future Costs Under Two Strategies
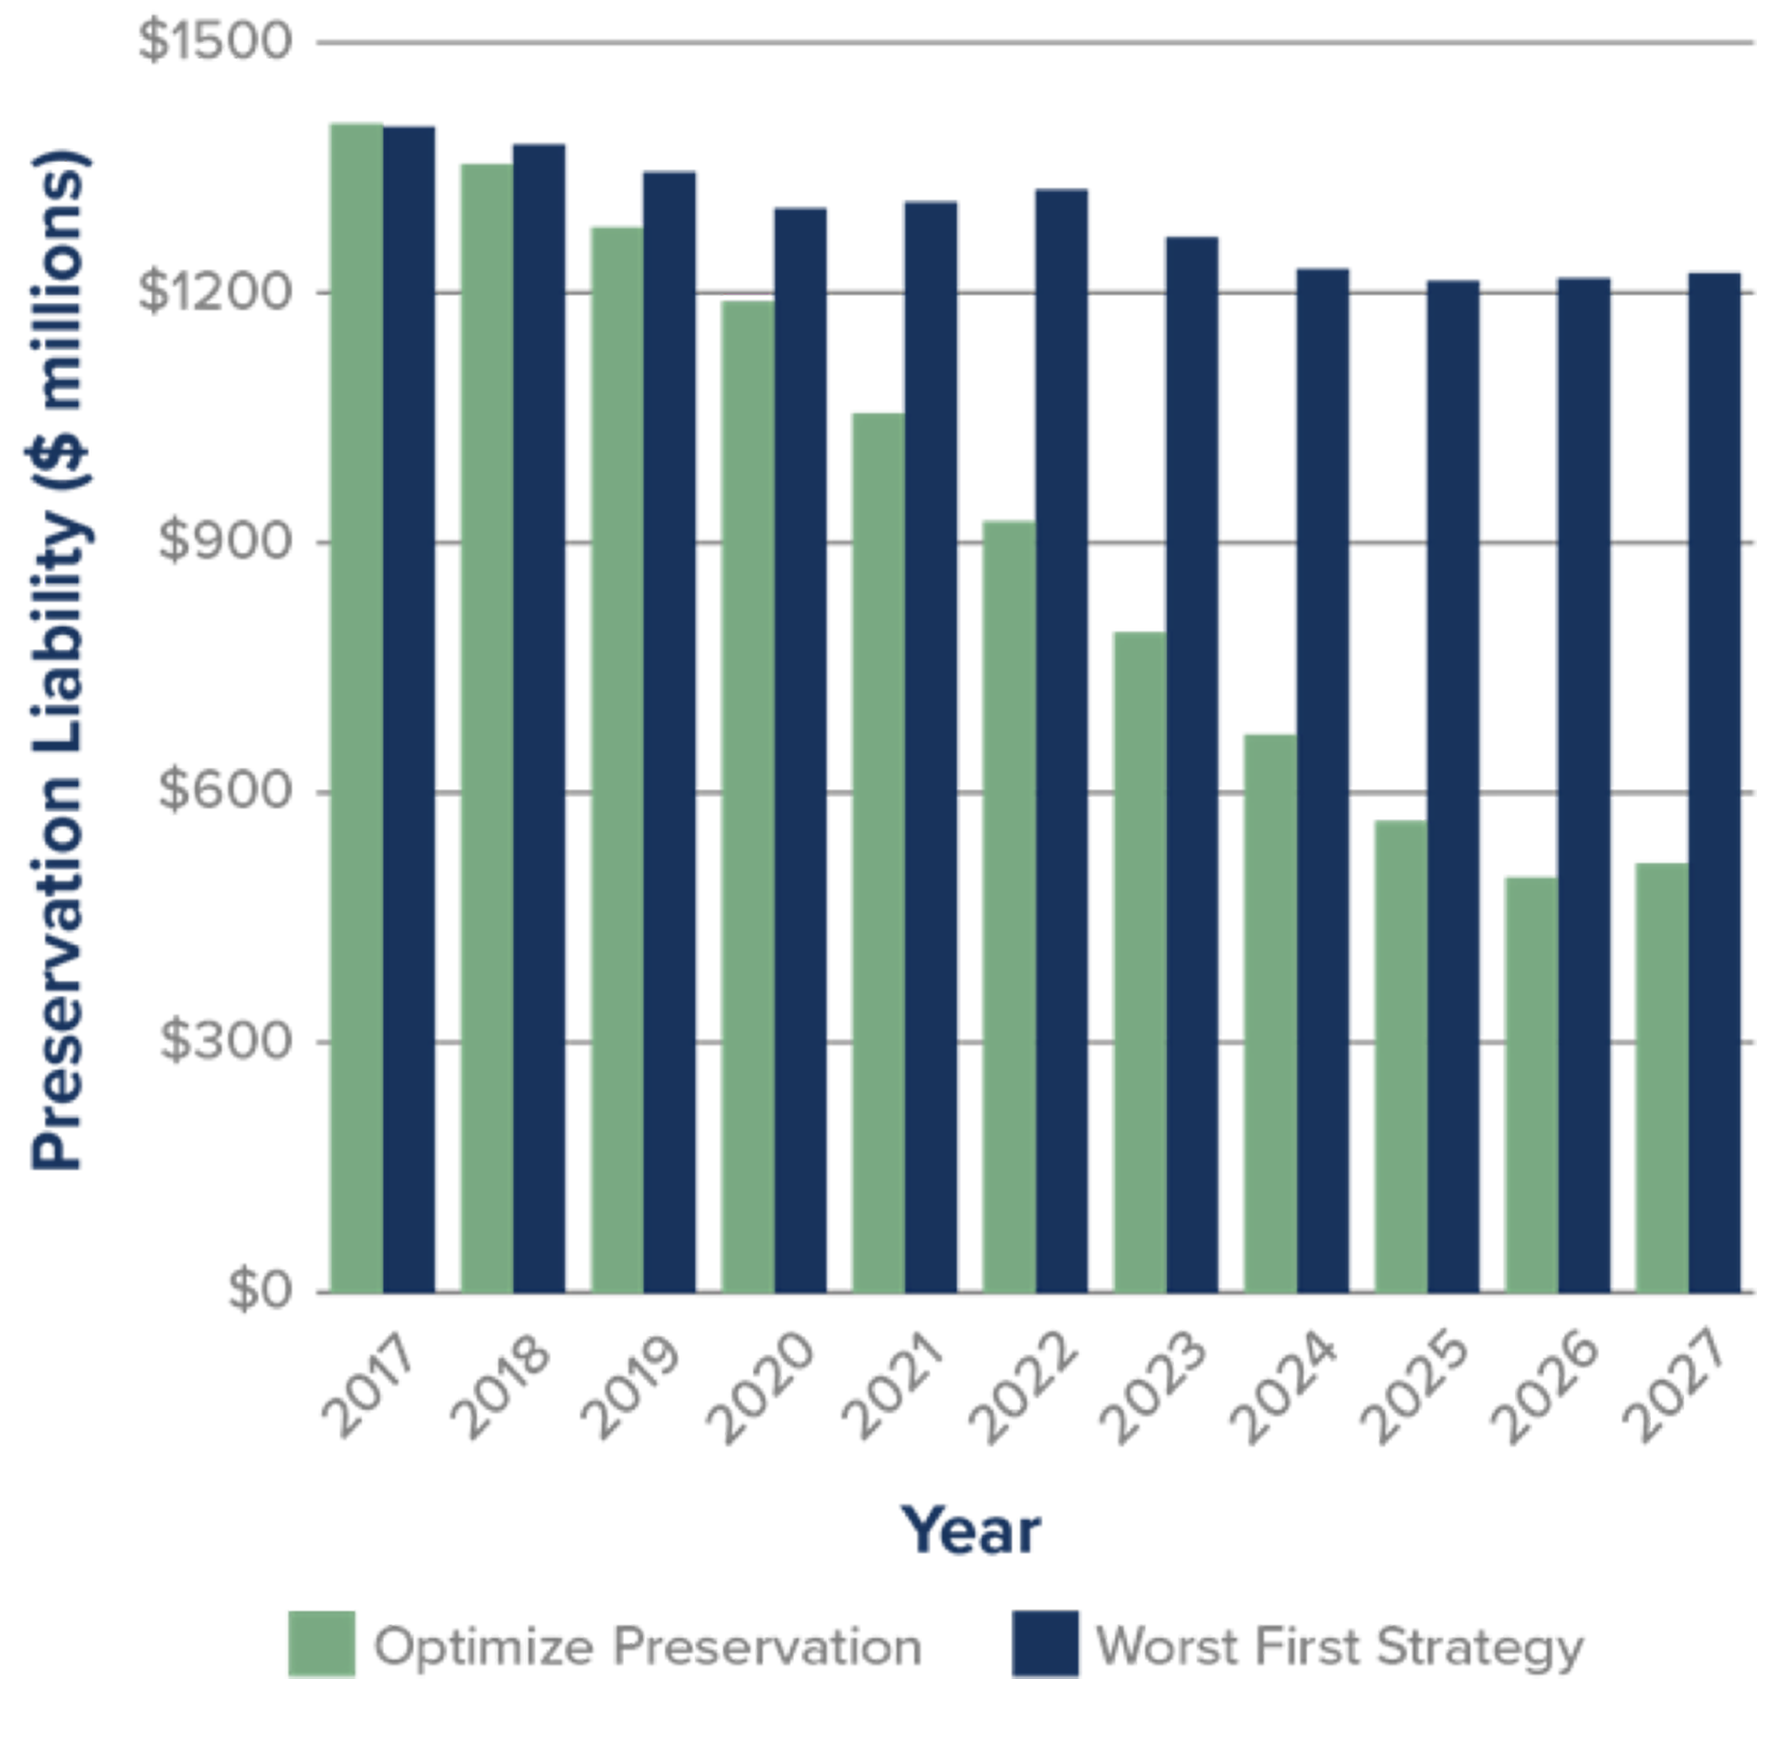
Source: Kentucky Transportation Cabinet Transportation Asset Management Plan, 2018.
Table 4.1 - TAM Decision-Making Contexts
Key Questions and Connections to Other Chapters
| Strategic | Tactical | Operational | |
|---|---|---|---|
| Key Decisions | Setting goals and objectives. | Capital investment prioritization and scoping and Integration of maintenance and renewal strategies | Delivery of the capital program, routine maintenance, and highway-operations activities. |
| Decision Makers |
| Directors and managers who are asset stewards. | District and field mangers, supervisors, and staff. |
| Key Questions |
|
|
|
| Other Factors | Decisions and outcomes of these strategic questions help focus investment. They add value to overall performance of the transportation system by setting priorities, values, and help prioritization of investment at lower levels. Creating new assets and disposing of existing ones are strongly influenced by decisions and priorities defined at this level. Chapter 2 discusses these considerations in more detail, and the level of service section in this chapter discusses linking these strategic priorities to decision-making at lower levels. Performance and target setting in Chapter 6 also discusses this linkage and how targets can be set to achieve these strategic goals. | This Chapter focuses on these questions and on the analysis that informs their corresponding answers and decisions. Life cycle management and analysis focuses on the existing transportation system and evaluates how:
| Delivering a program work, ranging from maintenance activities to capital improvements, requires a coordinated management of a large workforce. It requires processes that minimize input of resources to get the output required for desired system performance. Work management systems, efficiency and improvement techniques and performance management focus on improving decisions at this level. These concepts are discussed in Chapter 5, 6 and 7. |
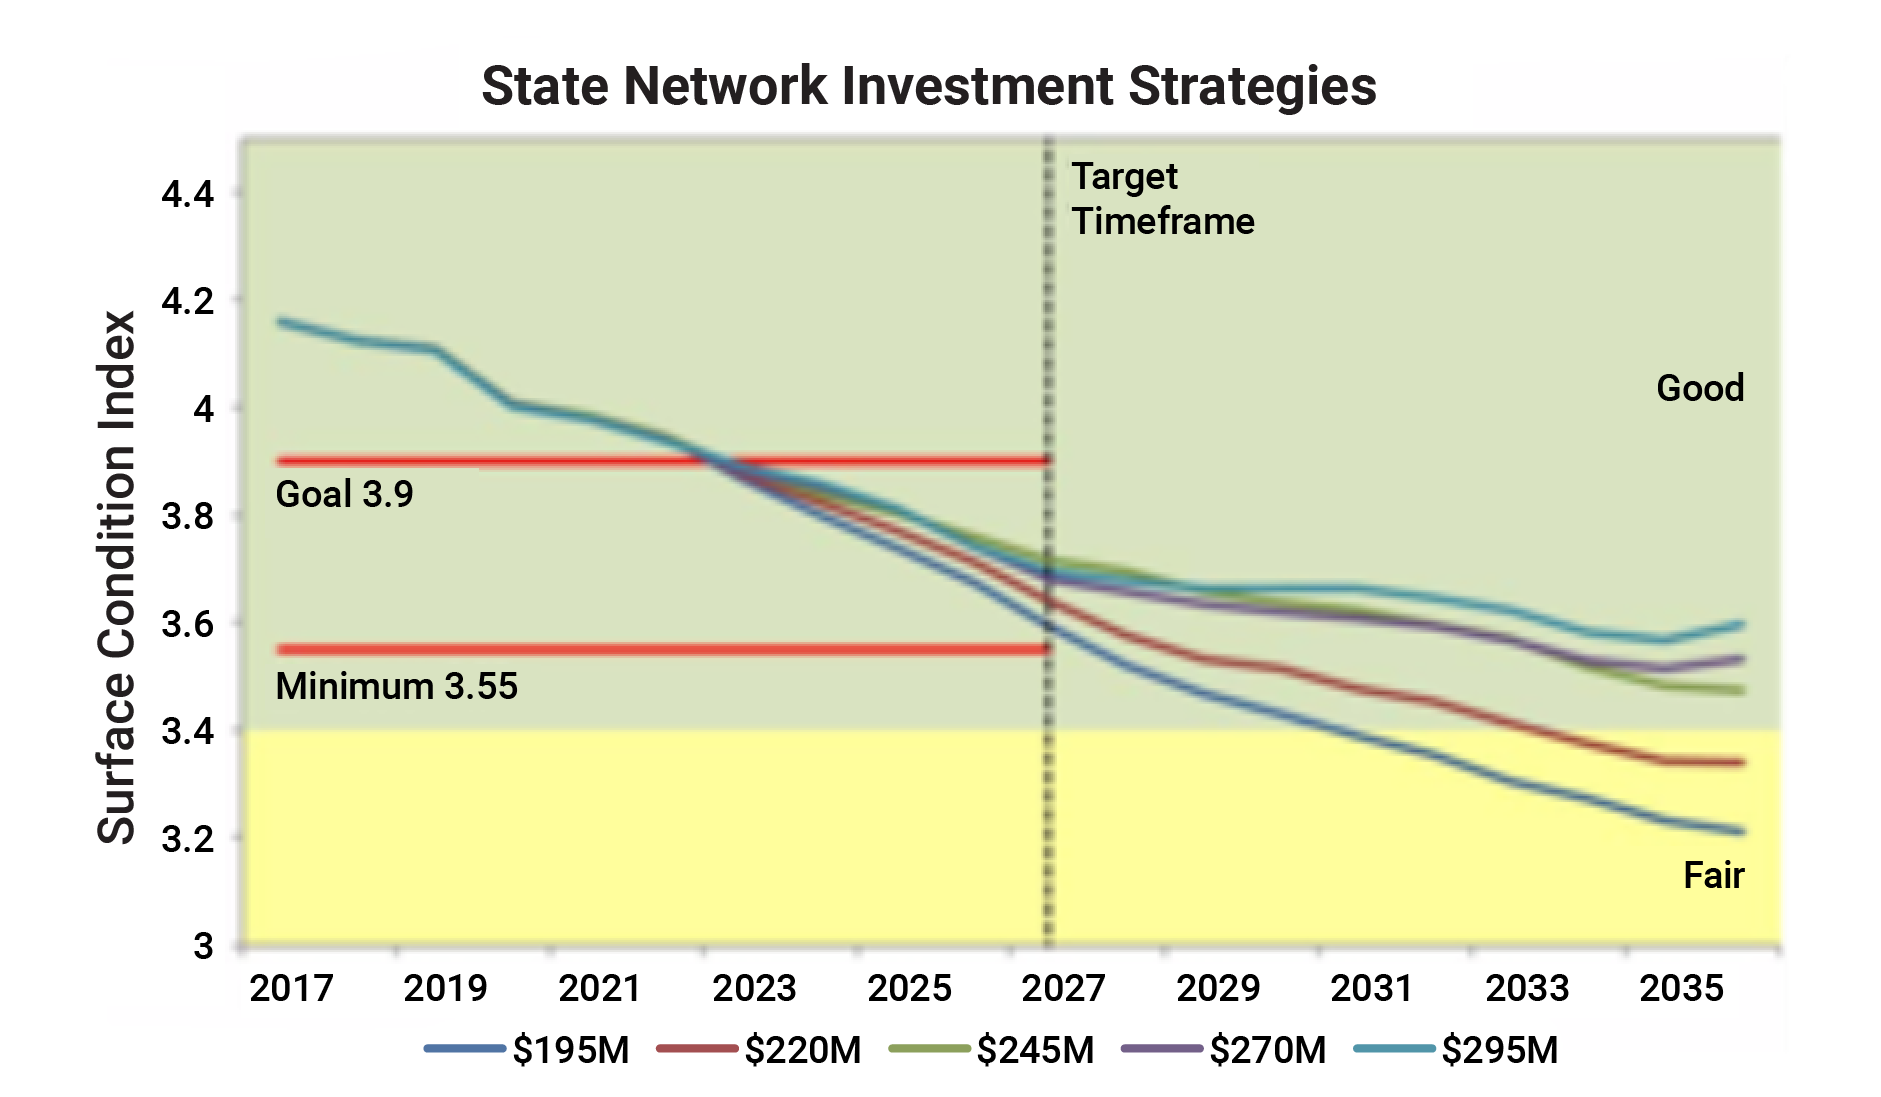
Kentucky Transportation Cabinet (KYTC)
In the early 2000s, KYTC found that the cost of hot-mix asphalt (HMA) was increasing faster than its budget to maintain pavement conditions. In response, KYTC evaluated the feasibility of strategies that relied heavily on preventive maintenance overlays such as thin HMA overlays (< 1 inch), chip seals, cape seals, and slurry seals. KYTC found that while the costs of these treatments were substantially less than a traditional HMA overlay, their service lives were only marginally shorter. As a result, the agency began increasing the use of these treatments on its secondary system. As part of developing its risk-based TAMP in 2018, KYTC evaluated life cycle strategies, as shown in Figure 4.3 Analysis of KYTC Future Costs Under Two Strategies that expanded the use of preventive maintenance overlays to its parkway and interstate pavements. The analysis results led the agency to select a life cycle management strategy that maximizes the use of preventive maintenance overlays on secondary roads and parkways and increases their use on interstate pavements over time. As shown in Figure 4.3, this new life cycle strategy achieved conditions over the 10-year TAMP analysis period that would have cost an additional $644 million if they had continued to rely on traditional 1- to 2-inch HMA overlays. By implementing these improved strategies, KYTC has significantly reduced the risk that the infrastructure will reach an unsustainable cost to maintain in the future.
Source: KYTC Transportation Asset Management Plan, 2018. http://www.tamptemplate.org/wp-content/uploads/tamps/048_kentuckytc.pdf
Defining Asset Service and Performance Levels 4.1.2
Before asset performance can be managed, an agency must first define what it is seeking to achieve. In TAM, asset performance is most commonly defined in terms of asset condition or maintenance level of service. Performance may also be evaluated in terms of safety, availability, reliability, resiliency and other service attributes. Regardless of the method used to monitor performance, it should be used to inform analysis that supports decisions to help ensure that investments enable an agency to achieve its goals cost-effectively.
Establishing Desired Levels of Service
Before a whole-life strategy can be developed and implemented, an agency must determine what they seek to achieve. In many transportation agencies, the desired level of service (or asset management organizational objectives, in ISO 55000 terminology) provides the linkage between what the goals of an agency are, and what investments and interventions should take priority when managing assets. High level goals should directly influence investment choices when resource allocation decisions are made. Service levels help establish when gaps need closing to achieve a goal, and merits investment. Chapter 2 discusses ways to create linkages between goals and investment decision making.
When managing the life cycle of existing assets, performance targets are commonly established as a way to manage service levels for the transportation network. How to determine the expected level of performance may vary depending on the type of asset being managed. Level of service targets that are part of performance framework typically are a mixture of both customer focused performance measures, and technical service measures that help those responsible for the asset assess what types of interventions might be required and when. Customer focused service measures are important to road users and other stakeholders that require mobility. Travel time reliability, safety, load capacity and clearances, and lane availability are all examples of service targets that are customer focused. Condition, strength, regulatory compliance and examples of technical service attributes are commonly of greater interest to asset stewards than asset users. Both types are service level targets that are important to evaluate the efficacy, effectiveness and efficiency of a transportation system.
TIP
“The organizational objectives provide the overarching context and direction to the organization’s activities, including its asset management activities. The organizational objectives are generally produced from the organization’s strategic level planning activities and are documented in an organizational plan.” (ISO 55000, 2.5.3.4) These organizational objectives are analogous to strategic objectives typically found in long range transportation plans.
For pavements and bridges, and other assets managed using a condition-based approach, asset condition is commonly used to establish expected technical levels of performance, but also is relevant to customers. For example, condition is employed as a proxy in this way for pavements because it is objectively measurable, deterioration has some predictability. It is a valuable service attribute because often, user experience is also directly connected to condition as well. Potholes, rutting and roughness all reduce quality of service from a pavement. Performance measures, such as those discussed in Chapter 6, are used to establish the desired long-term performance and to set short-term targets that can be used to track progress towards the long-term objectives. For other highway assets, including those managed using interval- or time-based maintenance approaches, performance may be linked to the expected service life, the ability of the asset to fulfill its intended function, and/or other operational factors. For these other highway assets, performance targets are often established as part of a Maintenance Quality Assurance (MQA) program in terms of desired maintenance levels of service (MLOS) and integrated with operational service targets that may also be customer focused.
Risk can also be used as a measure of performance. As described in chapter 2, risk considers both the potential impact and consequence of failure. This can be particularly useful when the potential consequences of failure impact other assets or facilities. An example of how Colorado uses risk to manage rockfalls is included in section 4.3 of this chapter. Additional details on how to track risk-based performance measures is included in Chapter 6.
Establishing a desired level of performance is typically a collaborative process that considers existing conditions, available funding, expected demands on the system, policy goals and guidance, and stakeholder priorities. The desired level of performance is typically established once baseline data is available, so performance trends can be evaluated. The desired level of performance may be adjusted over time to reflect changes in agency performance, changes in asset condition, capacity, safety, resiliency and other factors.
Three types of service expectations are often used in combination to manage asset performance:
- Performance target – the level of performance beyond which additional performance gains are not desired or worth the additional cost. When performance is measured based on condition, the desired performance may describe the desired state of good repair. There may be an expected specific time frame to achieve this desires performance target.
- Current Performance – an intermediate level of performance achieved by the organization and is usually reported relative to the desired target. Target setting is described in more detail in Chapter 5.
- Minimum acceptable performance – the lowest level of performance allowed for the asset or asset class to still function as designed.
Performance expectations may be set for the road network, a road corridor, for individual assets or for a group of assets. Commonly, performance expectations are set using a combination of asset class or subclass or sub network, such as:
- Key network corridors.
- Bridges on the National Highway System.
- Interstate pavements.
- Culverts larger than 10 feet in diameter.
- Traffic signals serving more than 10,000 vehicles per day.
TIP
A desired state of good repair is often established as the level of performance beyond which further performance gains are not necessary or desirable, usually represented as a condition state for a set of assets.
The nature of performance expectations can be either strategic or tactical or operational. Strategic expectations support freight movement; for example, the long-term goal of providing unrestricted flow of legal loads is supported by a performance expectation of no load-posted or restricted bridges on interstate highways. This expectation cannot be accomplished without the tactical delivery of work to address factors contributing to the physical condition of bridges. Thus, an agency may include tactical expectations to perform maintenance and repair on structural members on a routine basis or as conditions warrant. These enhancements can be also integrated with renewal and other rehabilitation interventions to help improve both tactical performance metrics, as well as achieve higher level goals and objectives. Operational improvements such as more responsive snow clearance, and better signage are all integrated treatment options to achieve the strategic objective.
Life cycle management analysis, and the decisions it supports, require service levels, performance targets and other objectives to be able to determine the optimal choices for agencies to select during resource allocation. Over an asset life cycle, a range of interventions are possible, from reactive, routine and preventative maintenance, to large investment associated with renewal, replacement, or removal. Having targets helps select the right interventions and investment option while balancing risk, service and cost.
Connecting performance measures to higher level strategic goals also supports an agency’s ability to communicate how technical measures relate to system performance as experienced by highway users and other external stakeholders, thus tying asset management outcomes to system performance. Asset management measures are often very technical. Performance indicators like bridge ratings, pavement distress measurements, and risk ratings are not commonly understood by those outside transportation agencies. However, agencies can use these technical measures to support the performance indicators that are more commonly understood and prioritized by system users and external stakeholders. Communicating system performance and the status of the road network is discussed in Chapter 2, and is illustrated in several examples below. Customer service level targets are often established for this purpose, and give users an ability to understand the quality of service they should expect on the transportation system.
Colorado DOT
Each year, the Colorado DOT must report to its legislature on the statewide highway infrastructure and the agency’s ability to meet those needs with available resources. This requirement is met through the Annual Infrastructure Deficit Report, which addresses pavements, bridges, and annual maintenance. The agency supports the annual maintenance portion of this report with its Maintenance Level of Service Measure, which rates the delivery of services in nine program areas in terms of a letter grade from A to D and F. The agency has used historic data to develop deterioration rates for each service area that estimate the resources needed to improve the maintenance level of service by a given amount over a specific time period. These estimates are summarized in the Report, which is in turn used by the Legislature and the DOT to establish the annual maintenance budget. The figure provides an example of information on MLOS in the 2016 Report. Once the targeted MLOS is established, maintenance funding can be allocated to ensure that agency priorities are met.
Colorado DOT Example of Funding Needed to Support Maintenance Levels of Service
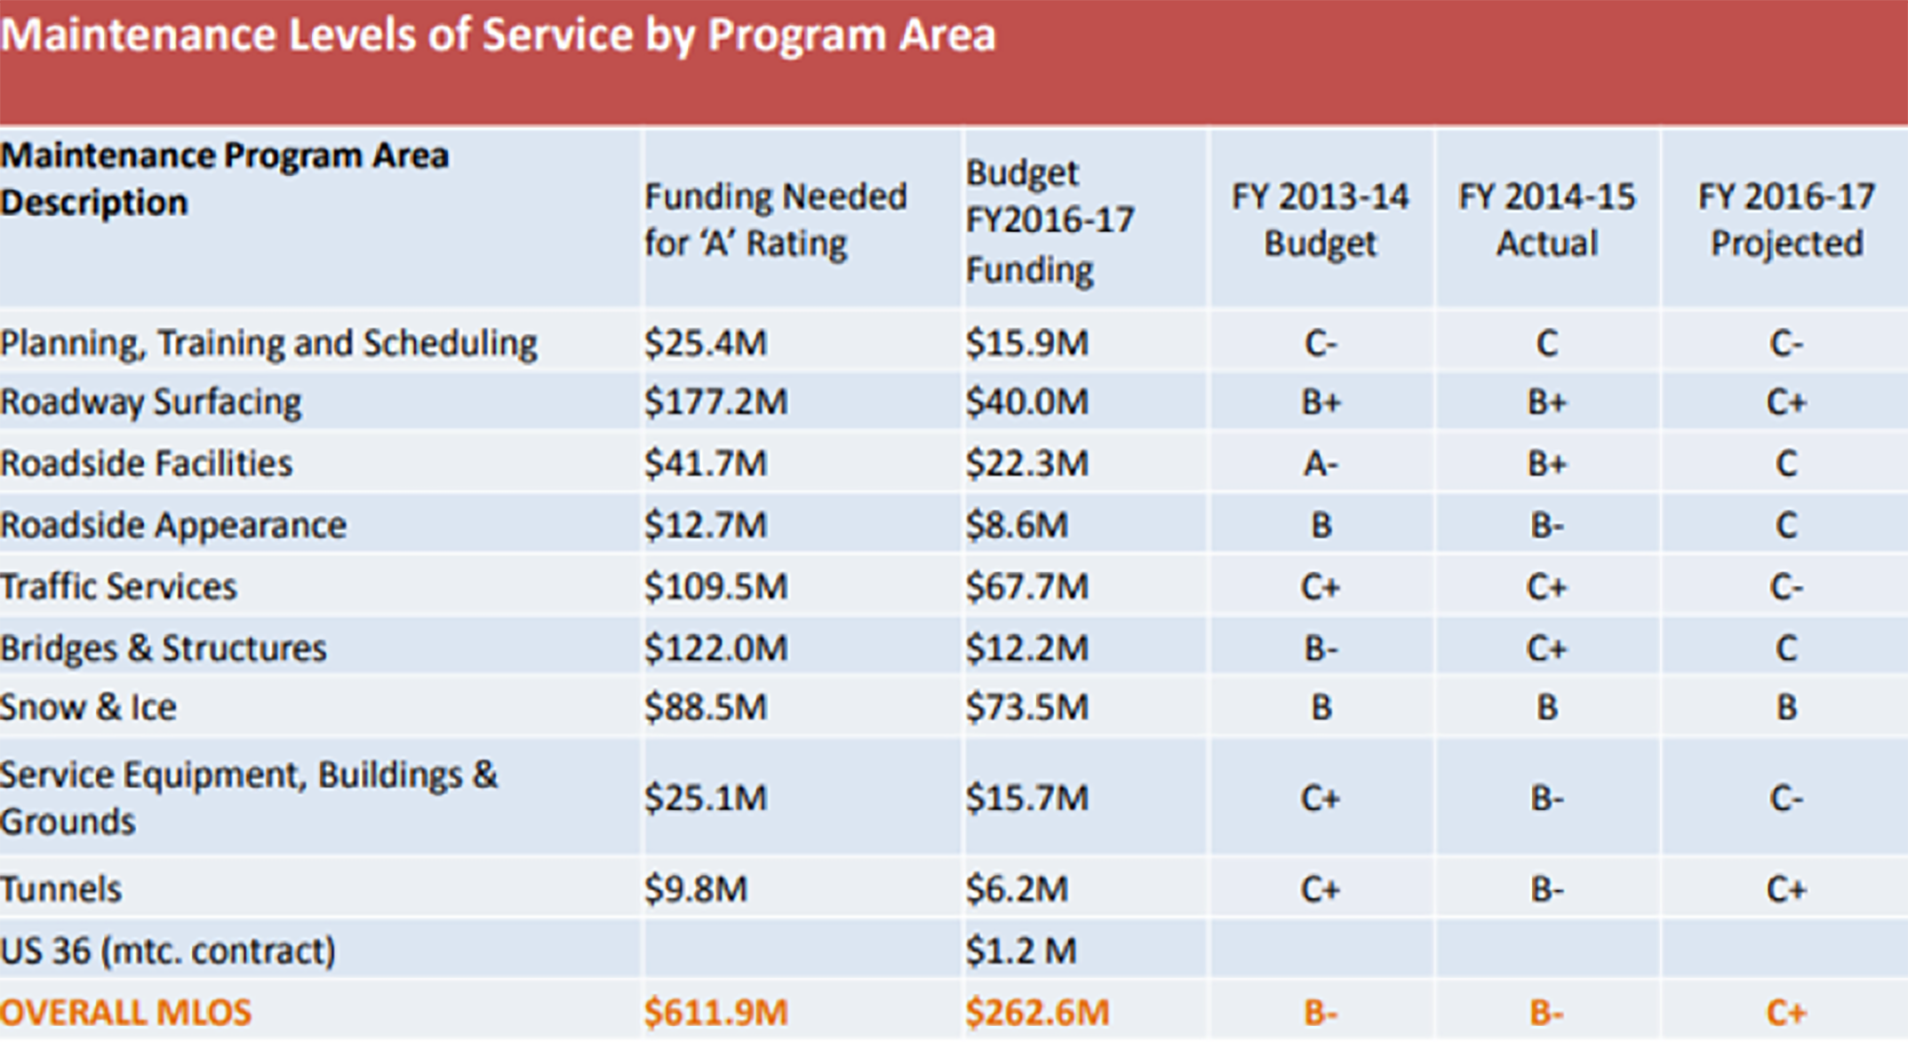
Source: Colorado DOT. 2016. https://leg.colorado.gov/sites/default/files/cdot_smart_2017_presentation.1.pdf
Washington State DOT
When seeking to establish the connection between investments and performance across a wide range of assets or roadway attributes such as litter, vegetation height, drainage, or functionality it is helpful to relate all of the various measures of performance to a common rating scale. Washington State DOT has developed its Maintenance Accountability Process to establish the relationship between maintenance level of effort and the resulting level of service. The process rates conditions and services in seven areas using a common letter-grade system, or MLOS.
- Roadway Maintenance & Operations.
- Drainage Maintenance & Slope Repair.
- Roadside and Vegetation Management.
- Bridge & Urban Tunnel Maintenance and Operations.
- Snow & Ice Control Operations.
- Traffic Control Maintenance & Operations.
- Rest Area Operations.
Each group of services or conditions includes several performance measures, which are translated to the MLOS grades of “A” (highest performance), “B”, “C” (adequate performance), “D” or “F” (unacceptable performance). Applying the MLOS grades allows for a consistent means of rating performance across services and geographic regions. Letter grades can also be represented in photographs of facilities that meet the criteria for each condition state to support communications with stakeholder groups. The MLOS are outcome-based measures that allow the agency to predict the expected level of service that can be achieved based on anticipated budget and work planning decisions. By tracking maintenance expenditures and MLOS results annually, Washington State DOT is able to adjust its maintenance priorities and budgets to address system needs and stakeholder wants.
Source: https://www.wsdot.wa.gov/Maintenance/Accountability/
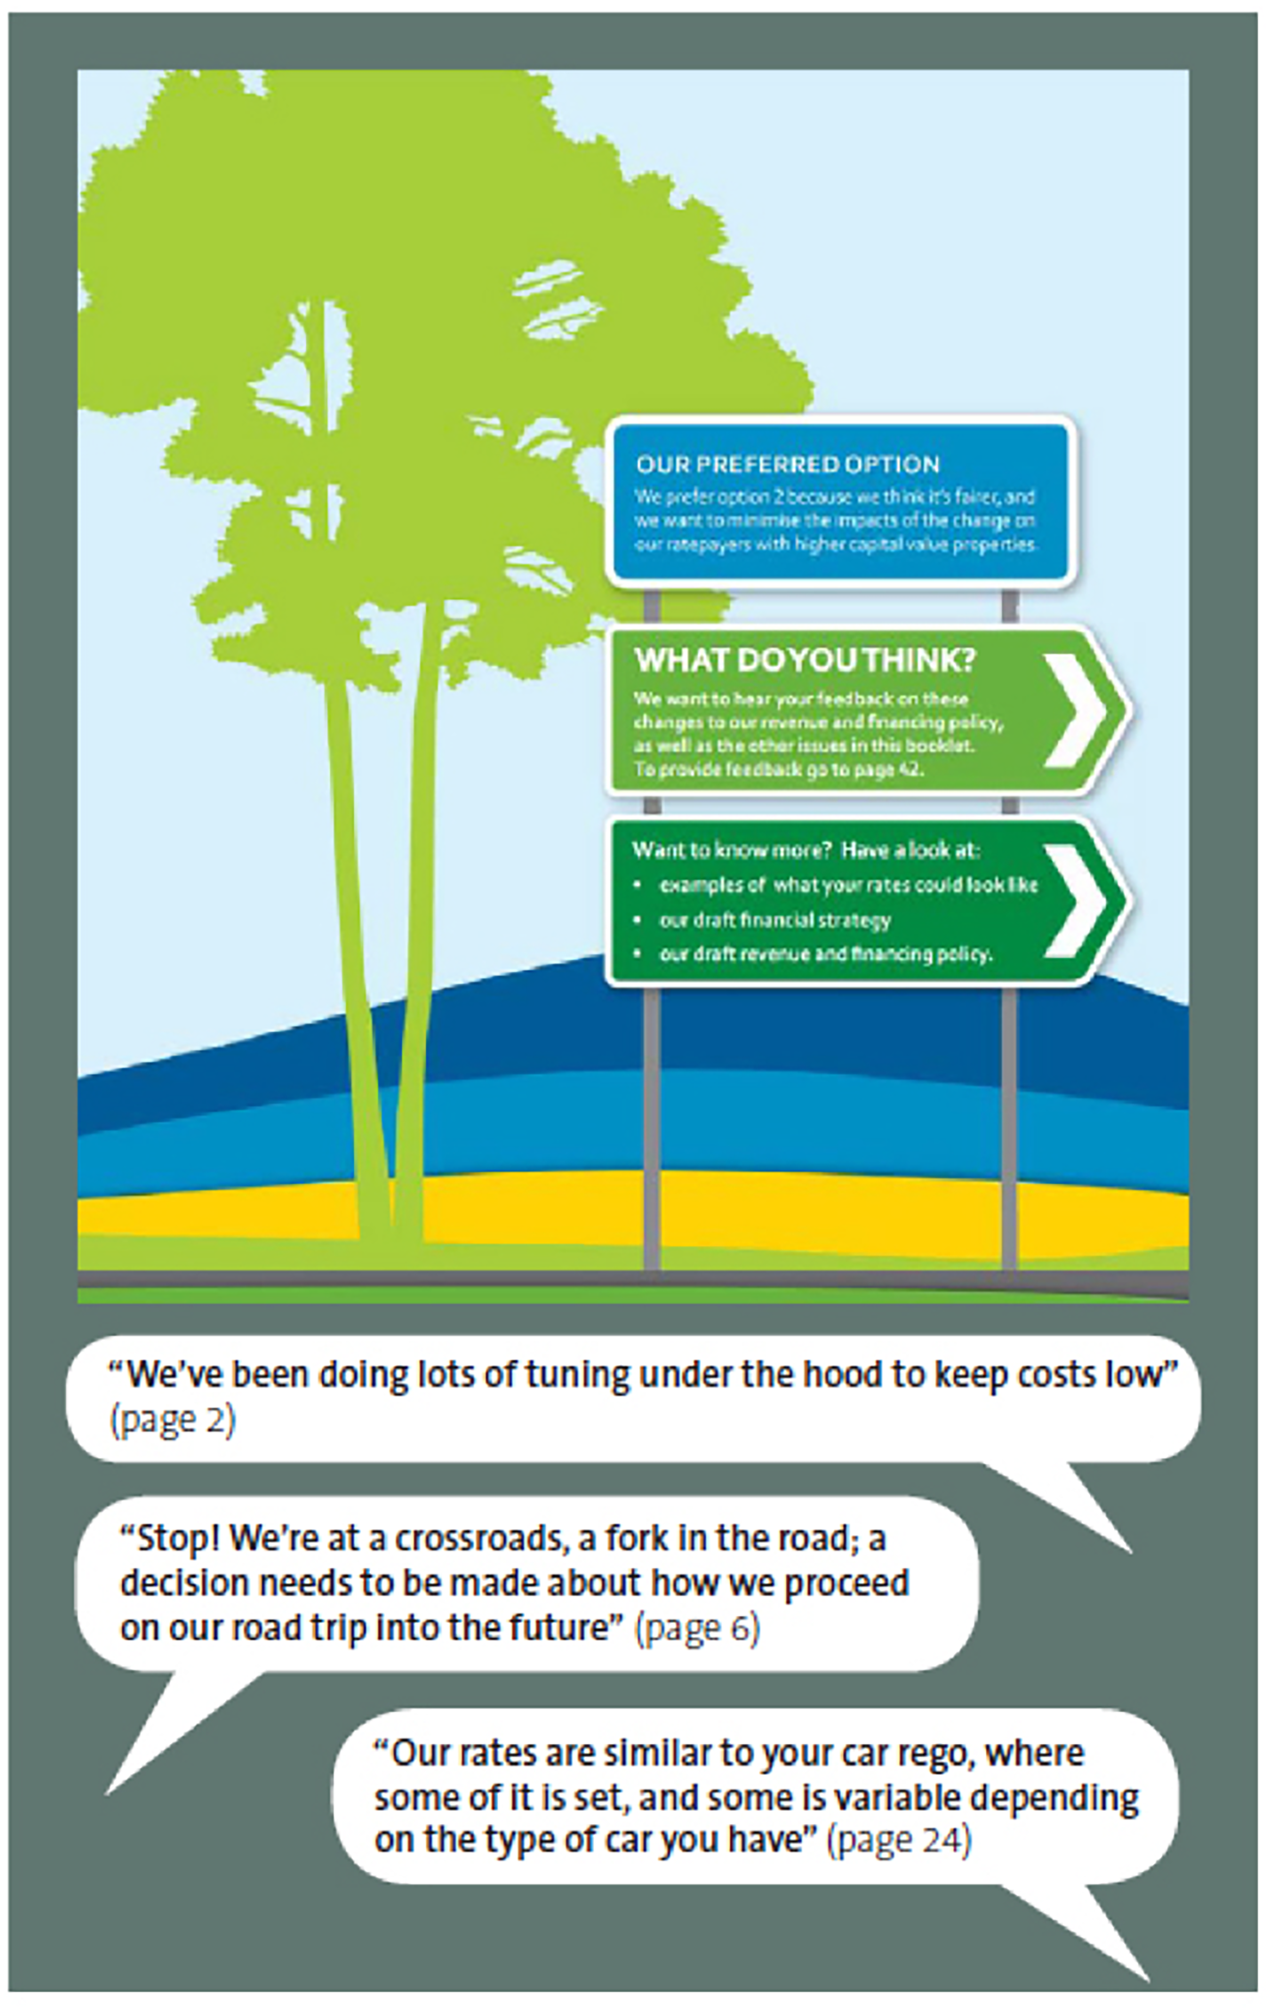
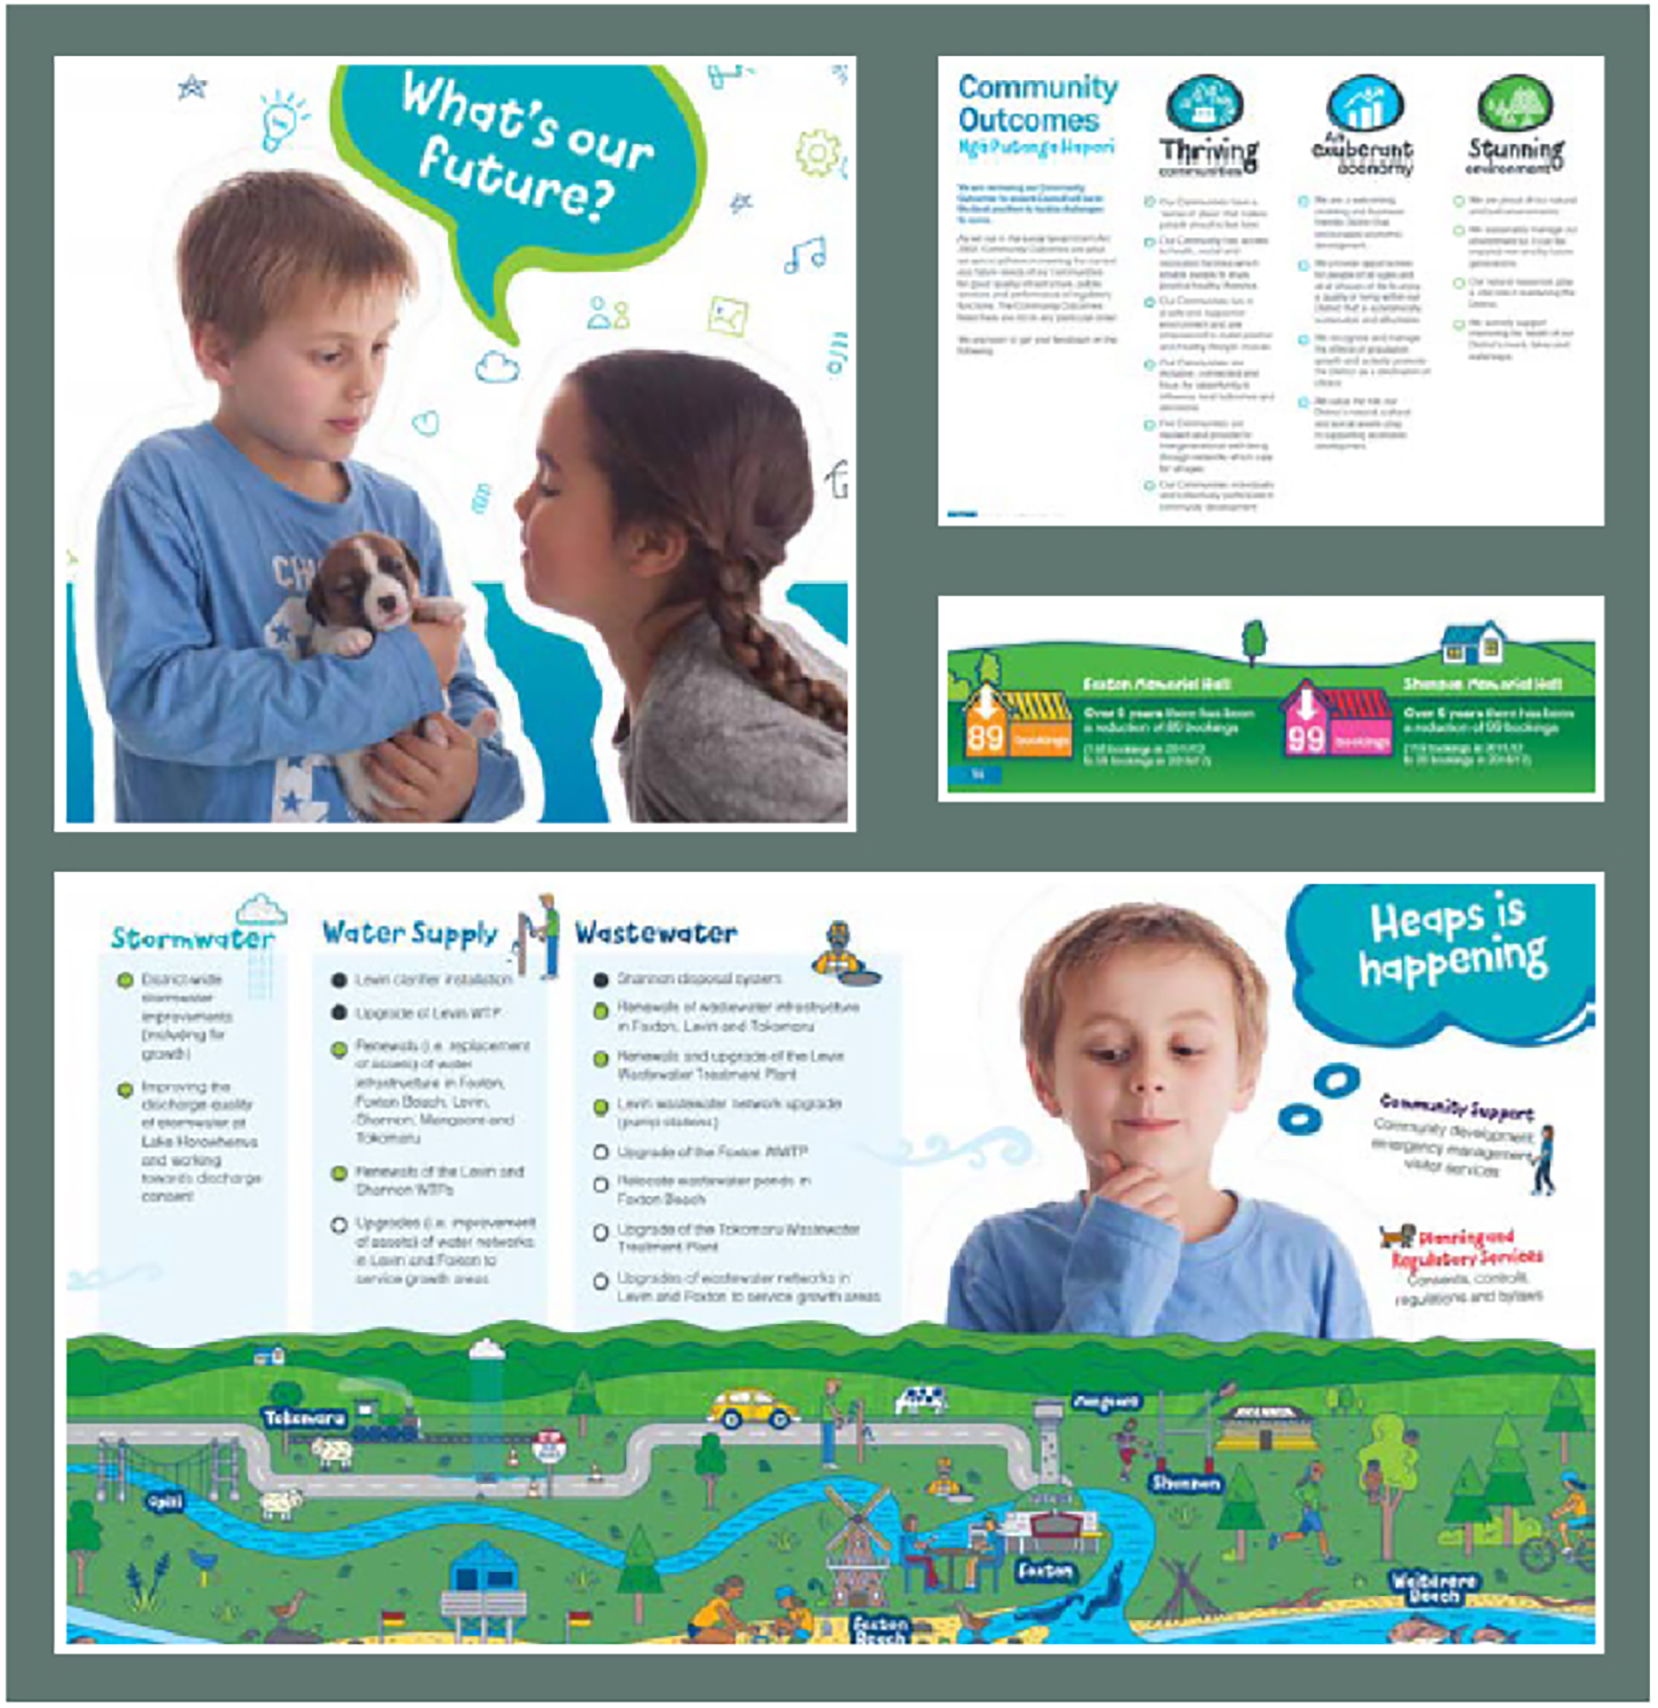
New Zealand Transport Agency
New Zealand Local Government Act legally requires councils to consult with their communities on their long-term plans. The consultation plan provides an effective basis for public participation in infrastructure decision-making associated with the long-term plan. It includes a fair representation of overall objectives, and how tax levels, debt, and levels of service might be affected by the intended plan and can be readily understood by interested or affected people. The Auditor General recently reviewed plans produced by communities across the country. Key findings highlighted aspects that help define good practice:
- Consultation documents present their information in a concise, readable and understandable way.
- Clear and unambiguous explanations on why proposed taxation and debt increases and significant changes in plans or intentions were considered “affordable” or “equitable” make consultation documents more effective.
- Some communities used a road-trip analogy throughout the document. The analogy makes technical subjects relatable without over-simplifying the issues.
- Some used a personalized approach that connected with people. For example, one uses two primary school children, Maia and Xander, who are pitched as the “champions of the Long Term Plan 2018-2038.”
By focusing on the inclusion of transportation customers, New Zealand municipalities are better able to address customer needs, inform customers of the actions they are taking, and refine work planning practices to address concerns critical to infrastructure operations and customer expectations.
Managing Assets Using Condition Based Management 4.3.1
The condition-based management is the most complex of the approaches introduced in Section 4.2 and requires a commitment to the collection of reliable inventory and condition information over an extended period and the of condition models to predict future deterioration to evaluate the type and timing of various treatment actions in terms of risk and performance.
Using Computerized Management Systems to Optimize Life Cycle Management
For condition-based analysis, computerized management systems are valuable tools for evaluating life cycle strategies. Computerized systems support the larger life cycle management process by providing relevant, reliable information and analysis results to decision makers at the right time.
Condition-based management is common for pavement and bridge assets. Often pavement and bridge decision making is supported by a computerized system that is used to support optimized life cycle management. The results from this analysis provide insights into optimal life cycle strategies for all network assets or for a specific group of assets. These models can be configured to include the effects, maintenance, preservation, rehabilitation, and reconstruction actions. Depending on the type of condition-based modeling approach, uncertainty can also be included.
Various life cycle scenarios can be generated by modifying one or more variables in the analysis. By running multiple network-level scenarios and comparing the results, pavement and bridge management systems can identify viable life cycle strategies and help an agency select the strategy that best achieves the stated objectives.
More information on the use of pavement and bridge management systems is available in the FHWA document, Using a Life Cycle Planning Process to Support Asset Management: A Handbook on Putting the Federal Guidance into Practice. Life cycle planning is a required component of risk-based TAMPs developed by state DOTs (23 CFR 515), that uses computerized asset management systems to establish long-term life cycle strategies for pavements, bridges and other highway assets. NCHRP Report 866, Return on Investment in Transportation Asset Management Systems and Practices, provides an assessment of how state DOTs have implemented asset management systems, including practice examples. The end of this section includes a how-to guide for using a pavement management system for life cycle planning, a requirement for risk-based TAMPs developed by state DOT’s for pavements and bridges on the National Highway System (23 CFR 515).
These computerized systems are designed to develop network-level scenarios for analyzing the impacts of different program variables over long periods of time. Typical pavement management scenarios will cover 10 to 40 years, while bridge management scenarios may need to cover 100 years or more to ensure inclusion of multiple life cycles within the scenario.
Various life cycle scenarios can be generated by modifying one or more variables in the analysis. By running multiple network-level scenarios and comparing results, pavement and bridge management systems can identify viable life cycle strategies and help an agency select a strategy that best achieves the stated objectives.
Ohio DOT
As required under MAP-21, Ohio DOT conducted a risk assessment to identify the most significant threats and opportunities to its pavements and bridges. The analysis revealed that anticipated flat revenues, combined with the annual increases in cost to pave roads and replace bridges, would lead to significant reduction in conditions without changes to existing practice. The potential deterioration in pavement and bridge conditions were expected to significantly increase future investment needs due to the increase in substantial repairs that would be required.
Following the risk assessment, a life cycle analysis was conducted. The analysis found that by focusing on the increased use of chip seals and other preventive maintenance treatments on portions of the pavement network, the annual cost of maintaining the network could be reduced. A life cycle analysis for bridges showed similar results. The bridge analysis found that with just 5 percent of the NHS bridges receiving a preservation treatment annually, the DOT could reallocate $50 million each year to other priorities. The investment strategies outlined in the TAMP and the changes made to the DOT’s existing business processes enabled the agency to offset the potential negative impact of the anticipated flattened revenue projections.
The differences in the adopted life cycle strategies are compared to the past strategies in the Figure. Although the total number of treatments applied over the analysis period increases, the annual life cycle cost decreases because of the reduction in the number of rehabilitation strategies needed.
Ohio DOT’s Pavement Preservation Strategy Comparisons
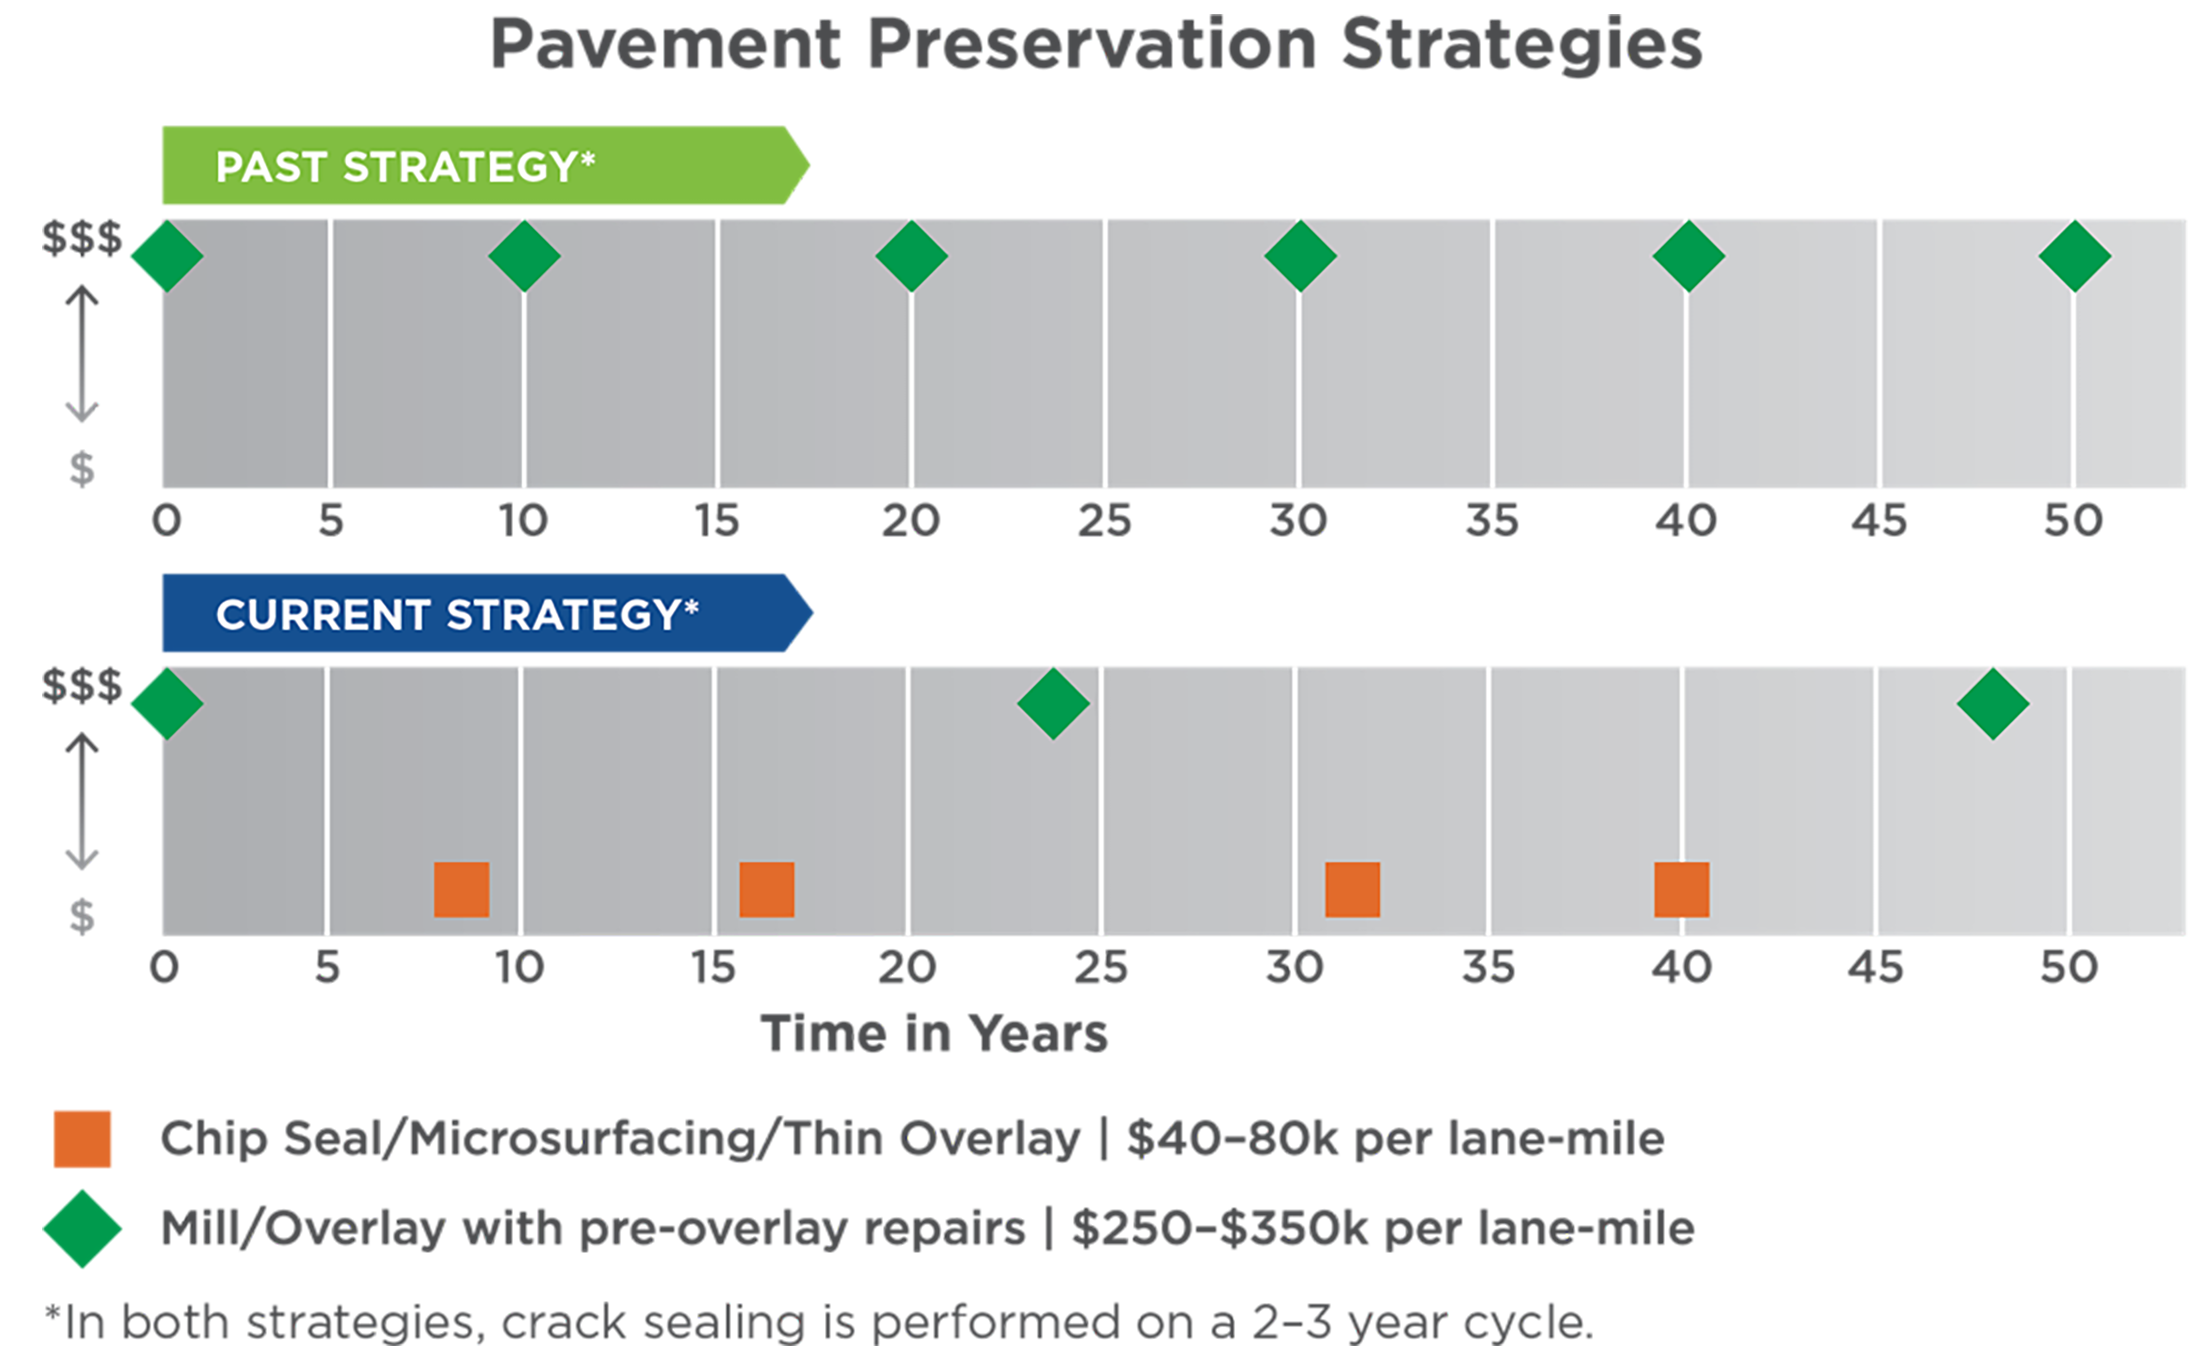
Source: Ohio DOT Transportation Asset Management Plan. 2018. http://www.dot.state.oh.us/AssetManagement/Documents/ODOT_TAMP.pdf
Minnesota DOT
In its 2019 Transportation Asset Management Plan (TAMP), MnDOT went beyond the scope of pavements and bridges as mandated by 23 CFR Part 515, addressing a comprehensive range of assets, including culverts, deep stormwater tunnels, overhead sign structures, high-mast light tower structures, noise walls, traffic signals, lighting, pedestrian infrastructure, buildings, and intelligent transportation system (ITS) components. MnDOT established expert work groups for each asset class to assess data availability, risks, mitigation strategies, measures, targets, and investment strategies. The Transportation Asset Management System (TAMS) was developed to manage asset inventory, condition data, and capture maintenance resources. TAMS integrates asset data, historical expenditures, and decision trees for culvert maintenance, facilitating life-cycle analysis, maintenance demand estimates, and performance evaluation. While traffic signals and ITS assets are being analyzed within TAMS, building management and sidewalk data are stored in separate databases.
Predicting Asset Performance
TAM Webinar #26 - Asset Inventory Condition, Target Setting, and Ten Year Projections
A life cycle strategy is enhanced by the availability of models and analysis tools that facilitate the evaluation of different combinations of treatment type and timing across the asset class. For this analysis a model that predicts future asset deterioration and response to treatments is required.
For condition-based approaches to managing assets, historical performance is typically used as a baseline for developing models to predict future performance. The predicted conditions are used to determine the type of treatments that may be needed over an asset’s service life, so the ability to accurately predict asset conditions in the future, with and without treatment, is an essential component of asset management. Models are developed by comparing performance, typically measured as asset condition, over time with actions or treatments performed on specific assets. This means that performance is associated to the last action or treatment that impacted performance in a positive way. However, assets may also receive treatments that delay the onset or advancement of distress. As a result, most models assume assets receive some level of preventive or routine maintenance between more significant treatments. If agency practices change to delay or cease maintenance activities, assets may not perform as models predict.
Several methods can be used to estimate future asset performance, the two most
common of which, deterministic and probabilistic, are described below. Additional information has been published by NCHRP (Report 713, 2012 ): Estimating Life Expectancies of Highway Assets. This report also contains guidance on selecting the most appropriate modeling approach for various highway asset classes.
Deterministic Modeling
Deterministic modeling is a common and relatively simple approach for using historic data to predict future asset performance. Deterministic models apply regression analysis to one or more independent variables, typically condition over time, and develop a “best-fit” equation to determine the rate at which asset conditions change. The independent variables are used to predict a single dependent variable, most commonly represented as the predicted condition at some point in time in asset management applications. Developing deterministic models is relatively easy but relies on quality data collected consistently over several years to produce dependable results. Deterministic models are more easily implemented as they are more readily paired with linear program solving. They also provide consistent outputs. The downside of deterministic models is the limited insight that they provide into the cost uncertainty surrounding a strategy.
Probabilistic Modeling
Unlike deterministic models, which provide a single repeatable outcome, probabilistic models provide a distribution of possible strategies that provides insight into the cost uncertainty of plans. Probabilistic models can also more readily accept uncertainty in other variables, as represented by the shading in Figure 4.7. Given that condition changes are probabilistic, no two strategies that the model will provide are the same. This means that multiple iterations of the model with the same inputs can provide different results. Accordingly, probabilistic models are useful for setting funding limit expectations, while deterministic models help to provide insights into which projects are best to apply to specific assets.
Common approaches to developing probabilistic models are the Markov, Semi-Markov and Weibull models. Markov modeling works well for assets with condition ratings based on regular inspections. There are several ways of establishing a Markov model, but the simplest is to calculate the proportion of assets that change from one condition state to the next in any given year. These proportions are then used to develop what is known as the transition matrix. At the start of the model run, an asset “knows” its condition state. Once this is known there is then a probability it will change from its current condition state to the next in any given year. While these types of Markov approaches have been widely used, they do not necessarily model deterioration effectively, as the rate of change of condition increases with time. To address this, Semi-Markov models are used. Like Markov, Semi-Markov models have a condition transition matrix, but this is also augmented with a time selection matrix. In these models the probability of a condition jump is calculated, then the length of time an asset will remain in that condition state is also selected. Using more advanced mathematical techniques, the Semi-Markov approach can be expressed similarly to the Markov approach, but for Semi-Markov, the transition matrix changes with time. This reflects the increasing likelihood the asset will transition (deteriorate faster as its ages). Such models are typically used on long-lived assets.
A Weibull model offers another approach for modeling asset deterioration. A Weibull distribution predicts the likelihood of asset failure or deterioration as a function of age. Weibull models are particularly useful for addressing assets rated on a pass/fail basis during inspection. The Weibull model provides an additional factor meant to address the increasing or decreasing likelihood of an asset moving from an acceptable to an unacceptable state between inspection cycles. Reliability is the inverse of the probability of failure (i.e. 1 -p(f)). Reliability, like Weibull can thus be used to assess the likelihood an asset will provide the required service. The relationship between time and reliability is assessed by analyzing asset behavior to understand potential modes of failure. This analysis is a core aspect of reliability-centered maintenance, and is more typically used on short lived assets.
Figure 4.7 Example of a Probabilistic Model
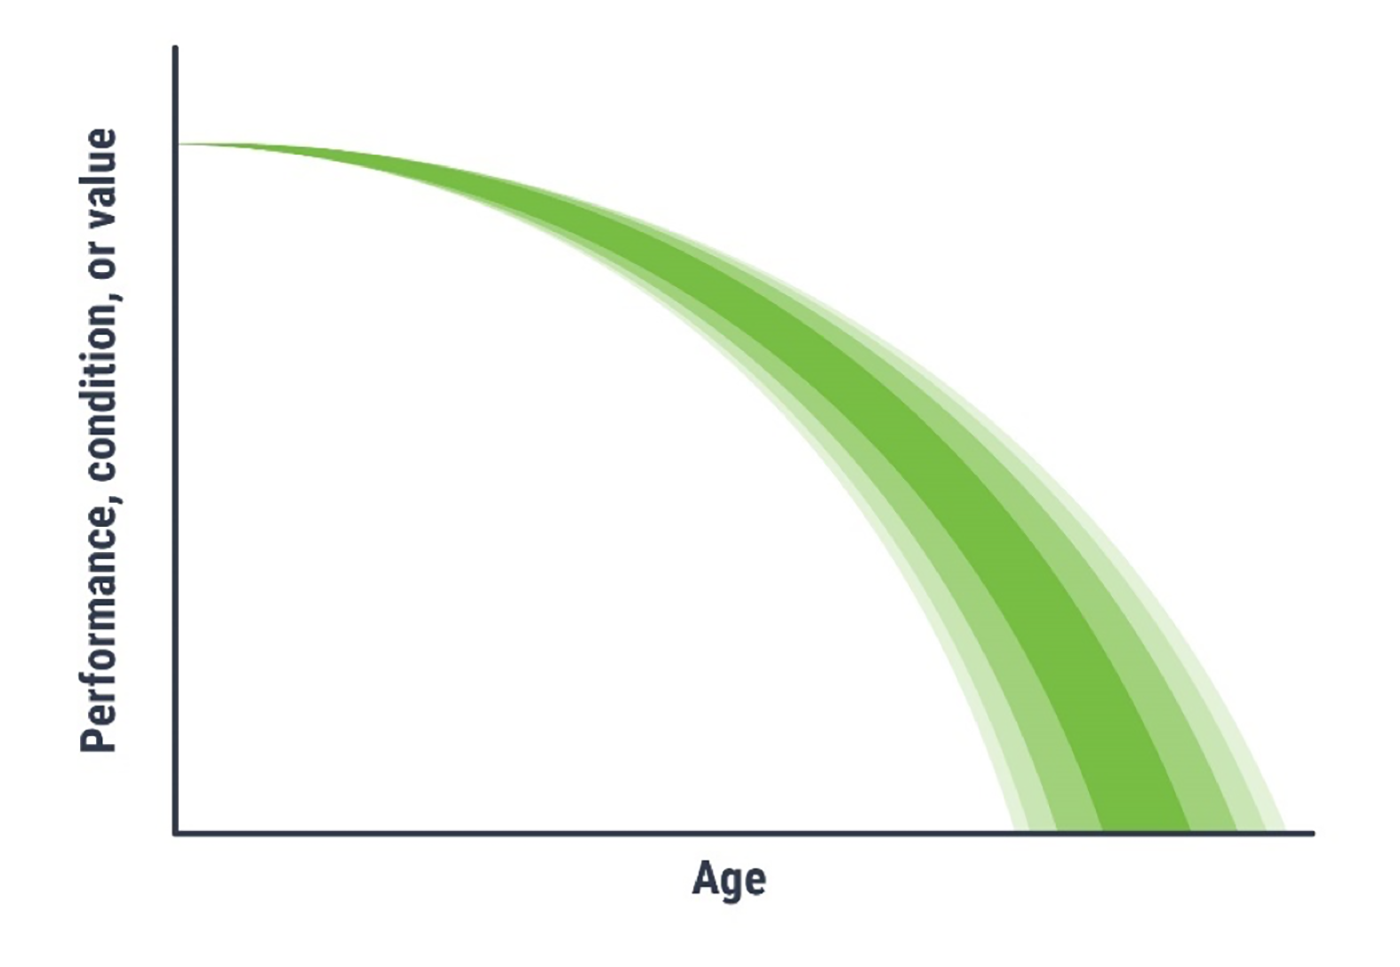
Source: Adapted from Transportation Research Board. 2012. Estimating Life Expectancies of Highway Assets, Volume 1: Guidebook. https://doi.org/10.17226/22782.
Accounting for Uncertainty in Asset Performance
Performance modeling uses historic data to estimate future performance; however, not all future events are predictable nor is past performance necessarily a predictor of future performance. This section considers the how uncertainty can be introduced into the analysis.
The unpredictability of future events introduces uncertainty into prediction models. Additionally, the amount of uncertainty tends to increase with time so their affects are compounded. As outlined in the previous section, probabilistic modeling is one approach that can be used for accounting for uncertainty, but what level of uncertainty is acceptable?
To minimize uncertainty, an agency must first understand the source of the uncertainty. A common type of uncertainty related to asset management is the behavior of the assets themselves. Due to the advancement of technology and knowledge and differences in materials and construction practices, there can be significant differences in performance between otherwise similar assets. The change in behavior can be positive, such as the introduction of epoxy-coated reinforced steel in bridge decks to delay the onset of corrosion from road salt intrusion or the introduction of Superpave and performance graded asphalt binders to reduce pavement cracking and rutting. Other changes in behavior are less easy to predict, such as the impact of salt intrusion on prestressed, post-tensioned concrete box-beam bridges. Other sources of uncertainty include:
- Weather events, e.g. flooding, drought, or freeze-thaw
- Earthquakes
- Climate change
- Traffic accidents
- Data inaccuracies
- Inaccurate models
- Poor assumptions
Uncertainty caused by variability in the data can often be addressed through the development of quality assurance plans that describe the actions an agency has established to ensure data quality, whether the data is collected in-house or by a contractor. Common quality assurance techniques include documented policies and procedures to establish data quality tolerance limits, independent reviews of collected data, and training of data collection crews. Data management strategies are discussed in more detail in Chapter 7.
To evaluate the accuracy of models and assumptions, agencies can include multiple scenarios in their life cycle planning analysis to test the impact of different decisions. This type of sensitivity analysis can be helpful in identifying areas in need of further research or developing contingency plans if the initial assumptions turn out to be inaccurate.
To understand whether time and effort should be invested in minimizing uncertainty, a risk-based approach can be used. Assuming the consequence arising from a defined issue or event remains the same, the cost in terms of data collection of reducing uncertainty can be investigated. As an example, the condition state of an asset, as determined using a visual approach, may not provide the required level of insight, which results in poor or unknowable treatment decisions. To minimize the uncertainty, extra testing can be carried out. The level of testing would be defined by the risk-cost reduction ratio. Similarly, with climate change, how much would have to be invested in studies to understand the effects on asset longevity? Thus, through risk management, an agency determines which risks are tolerable and which must be actively managed through investigations, studies other research. The risks are identified, prioritized, and tracked using a risk register (see Chapter 2). For those risks that should be managed, plans are developed to outline actions that will be taken to mitigate threats or take advantage of opportunities, as discussed in Chapter 6.
Halifax Regional Water Commission
Halifax Regional Water Commission (Halifax Water) has employed a deterministic modelling approach to create a plan for their storm water assets. The management system was used for long-term planning their culvert portfolio (approximately 1744 cross culverts on 3700 lane km of regional roads). The software uses deterioration curves, a temporal model periodic simulation model and has integrated Geographic Information System (GIS) capabilities.
Initially the analytical objective of the model was to maximize the average condition of all the culverts and minimize the investment. Several constraints were embedded within the initial model analysis including:
- Non-Increasing percentage of culverts in critical condition
- Replace all culverts that exceed expected useful life
- Budget not to exceed scenario
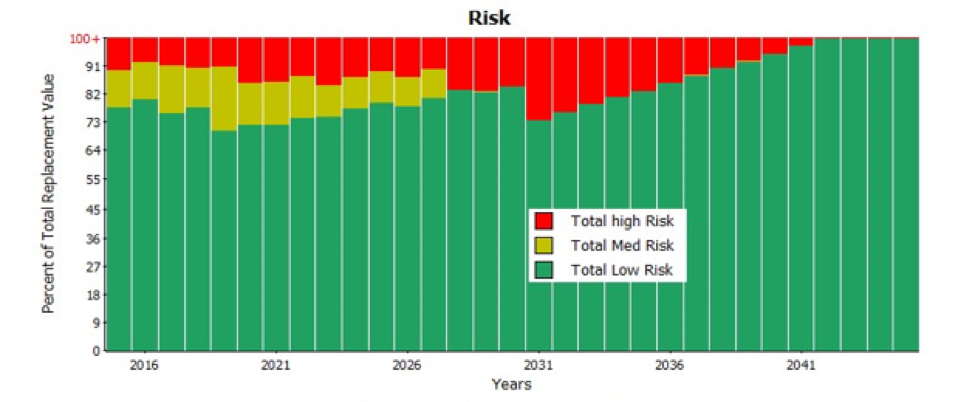
The scenario analysis allowed Halifax Water to establish a minimum investment level required to bring the portfolio to an acceptable average condition state, have a reliable forecast of future condition trends, and quantify an estimate of accepted risk of failures. The figure below shows the agency’s forecasted risk of failure over time based on the selected strategy and projected funding.
NBDTI forecasted culvert conditions using a deterministic model.
Categorizing and Tracking Maintenance Activities and Costs 6.6.1
Maintenance can be performed at any stage of the asset life cycle. Some maintenance work may or may not change the measured asset condition, extend the expected asset life cycle, or reduce risk. NCHRP Report 1076: Guide for Incorporating Maintenance Costs Into a TAMP establishes five categories of maintenance work to be considered in the incorporation of maintenance costs into TAM Analyses.
Operations and Routine Maintenance
TAM Webinar #59 - Incorporating Maintenance Costs Into a TAMP
Operational and routine maintenance activities may restore or sustain the functionality of an asset, but they do not change measured asset conditions (e.g., road patrol, mowing, and snow and ice control). These activities do not typically have a direct impact on an asset’s service life. Therefore, these are activities that are not generally considered in lifecycle planning (LCP) analysis. An absence of routine maintenance may increase the likelihood of some risks, as the performance of these tasks is typically assumed as part of the highway design process (Allen, et. al. 2023).
Preventive Maintenance
As the name indicates, preventive maintenance prevents or addresses deterioration to delay a decline in measured conditions but does not significantly improve conditions. Common examples include crack seal, chip seal, sweeping, drain cleaning, bridge washing (Allen, et. al. 2023).
Repair
Repairing damage or deterioration improves the measurable asset condition and restores function but does not restore or improve structure, capacity, or functionality. Examples of repairs include milling and inlaying pavement, bridge deck repairs, and bridge member repairs. These activities may include replacement of parts but not major components. The quantity of repair, rather than the type of activity, is what typically designates an activity as maintenance instead of rehabilitation or preservation (Allen, et. al. 2023).
Unit or Major Component Repair
Unit or component replacement goes beyond repair to remove and replace one or more individual asset components, restoring functionality for that component. Examples include sign panel replacement, striping, and traffic signal component replacement. For some assets, such as ground mounted signs, the entire asset may be replaced under a maintenance action because of the mechanism by which the replacement is delivered or funded (Allen, et. al. 2023).
Organizational Strengthening
Organizational strengthening includes activities that are not directly asset related. These activities may mitigate risk or improve organizational capacity. Examples include training, emergency preparedness, management systems and their use (Allen, et. al. 2023).
Capturing Maintenance Cost and Accomplishment Data 6.6.2
This subsection discusses the challenges of capturing maintenance costs for TAMPs, particularly when maintenance work is delivered by in-house crews or through different contract mechanisms. It emphasizes the need to align costs from different sources, such as in-house and contract maintenance costs, both financially and in terms of units of accomplishment. Examples are provided to illustrate approaches for aligning and tracking maintenance costs.
Introduction
The majority of asset management costs, for large transportation agencies, are contract costs for preservation, renewal, and construction of assets. However, maintenance investments have a significant impact on asset conditions and should be accounted for in a TAMP. Capturing maintenance costs for inclusion in a TAMP often poses unique challenges, because maintenance work is often delivered by in-house crews or through different contract mechanisms than major capital projects. These costs may also be tracked through different IT systems than capital costs.
When capturing costs for incorporation into a TAMP, it is also important to capture what is purchased, or accomplished, with those investments. Maintenance accomplishments are typically captured in terms of maintenance activities. However, the units of accomplishment for these activities may not easily align with asset management measures. Further the units of accomplishment may vary between work performed by in-house crews and work performed by contract.
In-House Maintenance Costs
Maintenance crews commonly report their efforts and accomplishments on a daily basis through a work reporting system. Most State DOTs currently use some form of maintenance management systems (MMS) to report work performed, along with the resulting accomplishments and costs.
In-house maintenance costs commonly include the cost of labor, equipment, materials, and overhead expenses related to work performed by maintenance field crews. These costs are captured through work order or daily report records, in which costs are associated with one or more actions, commonly called “tasks,” performed by the crew. Each task has an associated task code, which serves as a unique identifier, and a specific unit of measure for reporting accomplishments. For example, the task of “ditch cleaning” may have a unit of accomplishment of “feet,” or the task of “mowing” may have a unit of accomplishment of “acres.”
Contract Costs
Maintenance contract costs, like typical construction contract costs, are captured in terms of contract pay items. These pay items commonly do not align with the maintenance. Moreover, the unit of accomplishment may depend on the type of contract used to procure the work. For example, a contract to clean ditches may have a pay item measured in feet of ditch cleaned, cubic yards of material removed, or hours of work performed.
Maintenance contracts may be funded from an agency's Capital program or Maintenance budget. In many cases maintenance contracts funded through different programs are managed with different systems and have different means of tracking both costs and accomplishments. All of these differences can make tracking maintenance costs more challenging than the costs for other work types.
Aligning Costs from Different Sources
To incorporate maintenance costs into a TAMP, the costs from multiple sources need to be aligned in regard to both their financial components and their units of accomplishment.
The primary source of misalignment between in-house and contract maintenance costs is that in-house costs are captured through individual components of labor, equipment, materials, and overhead, whereas contract costs are captured based on pay items that combine each of these components. The labor costs captured through maintenance management systems (MMS) may or may not include an estimate of overhead costs. To facilitate comparison of in-house labor costs to contract costs an overhead multiplier should be applied. Best practices for ensuring in-house costs are accurate includes interfacing the maintenance management systems with the agency’s financial or enterprise resource planning (ERP) system.
Once the costs are aligned financially, they must be aligned to common units of accomplishment to allow them to be incorporated into asset management analyses. The Maryland DOT State Highway Administration (MDOTSHA) and Texas DOT (TxDOT) offer two examples of how this alignment can be accomplished. These examples are taken from NCHRP Report 1076, Guide for Incorporating Maintenance Costs into a Transportation Asset Management Plan. TxDOT’s approach requires inspectors on maintenance contracts to enter daily accomplishment information into both the Capital Program management system, SiteManager, and the MMS. MDOTSHA has developed a set of Project Cost Activity (PCA) codes to track in-house maintenance expenses. These codes are incorporated into the records of all maintenance contracts to facilitate alignment of costs and accomplishments.
Maryland DOT
The MDOT SHA reports labor, equipment, and materials costs for its State forces’ work into the electronic team activity cards (eTAC) system. These costs are captured by asset or unit. MDOT SHA enters contract data into the FHWA Financial Management Information System (FMIS) and other contract management software. The contract systems and eTAC assign a Project Cost Activity (PCA) code for each expense. The PCA codes allow the costs from similar work, delivered by different means, to be aggregated. The PCA codes are linked to the twenty-one Maryland Condition Assessment Reporting System (MCARS) elements to align costs with asset performance. MDOT SHA uses QlikView to aggregate the work output, cost data, and MCARS data and associate each to the appropriate PCA code for the work activity accomplished (see Figure 6-B, a screenshot of QlikView provided by MDOT SHA). Data aggregation with QlikView works well if data is accurate with the PCA codes, costs, and accomplishments.
Screenshot of QlikView
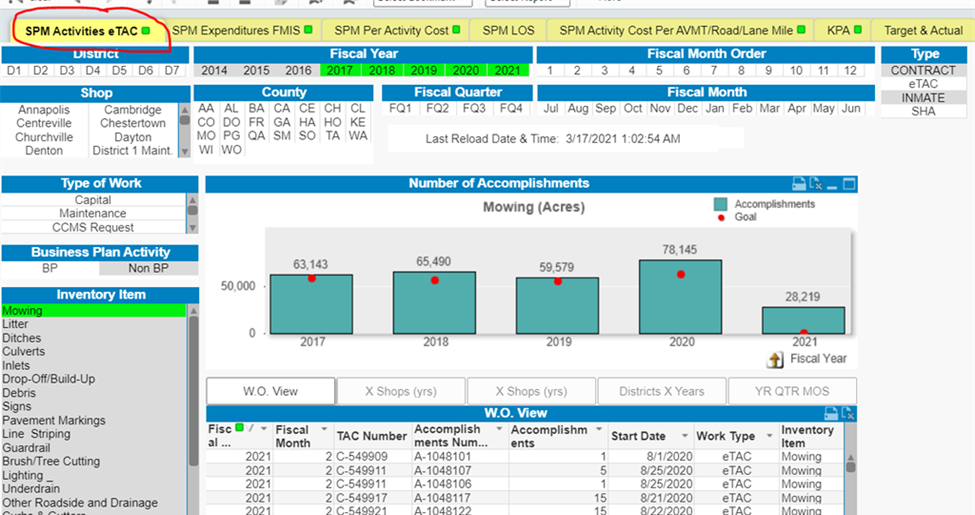
Source: MDOT SHA
This approach enables MDOT SHA to perform an analysis to determine whether in-house or contracted maintenance provides a more cost-efficient result for the activity or asset. This is an important analysis to consider when developing maintenance work programs as it allows an agency to be strategic with limited resources” (Allen, et. al. 2023).
*Note: This practice example was derived from NCHRP Research Report 1076: A Guide to Incorporating Maintenance Costs into a Transportation Asset Management Plan.
Texas DOT
TxDOT provides an example of effective contract maintenance cost data collection processes. TxDOT contracts approximately 52 percent ($620 million) of its $1.2 billion maintenance budget for routine maintenance. Contracted work is interfaced into TxDOT’s MMS in two ways: from its enterprise resource planning (ERP) software and from its construction contract management software. TxDOT typically uses work orders (WO) for contracts less than $25,000. The process for capturing and reporting contract maintenance costs is shown in Figure 6-A.
Figure 6-A: TxDOT Contract Purchase Order Data Collection Process
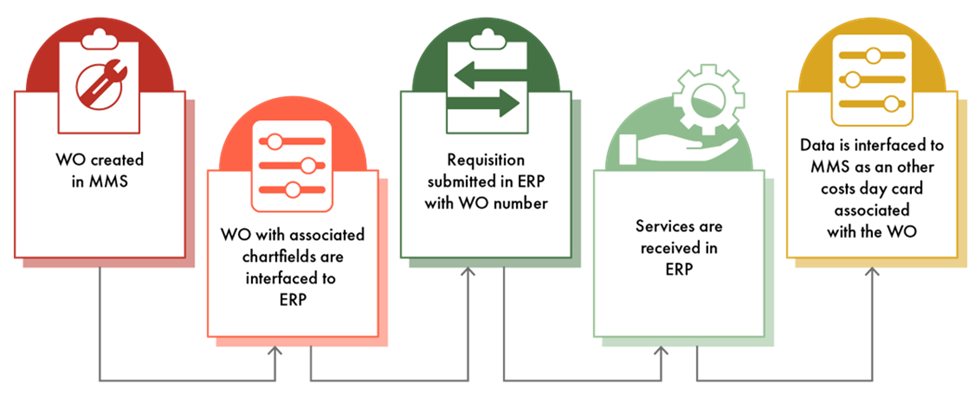
Source: Texas DOT
For larger projects, TxDOT utilizes AASHTOWare Site Manager, including the Routine Maintenance Contract Administration module. Daily work reports allow inspectors to capture work performed at the job site such as personnel, equipment, work items, quantities, descriptions, etc. Over 3,700 pay items are used on routine maintenance contracts and the Maintenance Distribution Window, a custom upgrade to Site Manager, ties the pay item cost to the MMS function code (i.e., what work is being performed) and amount of work performed. The MMS then provides reports by function code for both in-house and contracted work and TxDOT actively monitors data quality to ensure accurate reporting and analysis” (Allen, et. al. 2023).
*Note: This practice example was derived from NCHRP Research Report 1076: A Guide to Incorporating Maintenance Costs into a Transportation Asset Management Plan.
Incorporating Maintenance Costs into TAMP Analysis 6.6.3
This subsection introduces strategies for incorporating maintenance costs into key TAMP analyses, such as lifecycle planning, risk analysis, and financial/investment planning. It also provides insights into addressing unexpected disruptions using historical trends and other data. While many agencies capture maintenance costs and asset conditions within an MMS, few agencies use that data for the type of long-term analysis used to develop a TAMP.
Life Cycle Planning
One benefit of categorizing maintenance activities by their impact on the asset life cycle is that it facilitates incorporation of costs from those activities into Life Cycle Planning (LCP) analysis.
- Preventive Maintenance, Repair, and Unit Replacement costs are all critical inputs to LCP analysis. These costs are sometimes considered under the Preservation work type by State DOTs. Assets are typically eligible for each type of maintenance activity at a specific point in their lifecycles. Once a certain level of deterioration has been reached, a given type of activity ceases to be a cost-effective treatment. To incorporate these maintenance activities into LCP for a given asset class, agencies should consider the following:
-
- The size of the asset inventory.
- The number (or percentage) of assets eligible for the activity type.
- The length of time a typical asset is eligible for the activity type.
- The available treatments and their unit costs.
- How the application of each treatment impacts asset conditions.
- The quantity of each treatment to be applied in each year of the analysis.
- Operations, routine maintenance, and Organizational Strengthening costs do not have a direct impact on future conditions, and are generally not included in LCP analysis.
Risk Management
Maintenance crews and contracts are often critical components of risk mitigation strategies. The way these resources are deployed to address risks depends on the type of risk, which can be broadly incorporated into two categories: events and trends.
Risk Events
Maintenance resources represent a transportation agency’s first responders to major and minor disruptive events. Costs for response to risk events can be captured using normal work reporting procedures. Agencies often apply a code to signify if the work being reported is in response to a specific event. In some cases, the agency may be deploying maintenance resources in response to an event that has not yet been identified. In these cases, staff may need to review past records so they can be associated correctly.
Trends and Long-Term Change
Maintenance can be deployed to address long-term trends that impact asset conditions. Other trends may impact an agency’s ability to deploy maintenance. Examples of trends that impact maintenance include the following (Allen, et.al. 2023).
- Changes to regulations, requirements or standards may require a rapid response to replace non-conforming assets, or may impact the cost of future maintenance.
- Changing customer expectations may lead to changes in maintenance performance standards and drive future budget changes.
- Funding fluctuations may provide a boost to or decline in maintenance capabilities. In turn this could lead to changes in asset performance, or vulnerabilities.
- Aging infrastructure can lead to network wide changes in maintenance needs. This can occur cyclically, following large building cycles, such as the interstate construction era from 1960 to 1980.
- Staff turnover due to retirements can create a need for better knowledge management.
- Rapid system expansion can lead to an increased need for future maintenance. Since the need is not immediate, there can be a lag between the need arising and an awareness of that need among executives and legislators who establish maintenance budgets.
- Long-term or gradual environmental changes can impact asset performance by exposing infrastructure to conditions it was not designed to withstand. Maintenance may be required to retrofit or replace poorly performing assets.
Financial Planning
The TAMP Financial Plan should consider all sources of funding used to support maintenance. The Financial Plans should indicate how that available funding is expected to be used over the TAMP time period. This will typically require extrapolation or forecasting beyond established maintenance budgets. The maintenance activity categories can be helpful in determining how to account for this funding within the plan.
- Preventive Maintenance, Repairs, and Unit Replacements are often funded and delivered by multiple programs. As such some of these costs may be captured under the Preservation work type, and some captured under Maintenance. Agencies should take care in understanding how this work is funded and delivered to ensure costs are fully captured and not double counted in the TAMP.
- Funding for Operations and Routine Maintenance may come from its own budget line or be part of overall maintenance funding. Additionally, some operations expenses may be funded out of capital programming through programs such as the Congestion Mitigation and Air Quality (CMAQ) program. These activities are generally performed in a similar fashion regardless of asset condition. Therefore, these are commonly included as fixed-cost items that reduce the amount of funding available for activities that improve asset condition. Typically, this is included as an average annual cost.
- Organizational Strengthening activities can be budgeted separately from the other categories to clearly communicate their importance and show what activities are planned. These activities can be tracked using the time, labor, and material features in a maintenance management system.
A process for developing TAMP financial plans has been established through several documents. Most recently, NCHRP Report 1076, Guide for Incorporating Maintenance Costs into a TAMP updated this process to better incorporate maintenance costs (Allen et. al. 2023).
- Determine the scope of the TAM program.
- Identify maintenance fund sources.
- Establish maintenance fund uses.
- Structure maintenance sources and uses list.
- Validated the list.
- Document Constraints.
- Document assumptions about fixed costs.
Investment Strategies
As described in Chapter 5 of this guide, investment strategies establish a long-term plan for how the agency will apply its resources to achieve its asset management objectives. Agencies typically develop investment strategies through a scenario-based planning process. In this process the agency evaluates costs and benefits of different investment scenarios to choose the most appropriate. Since the majority of TAM funding comes through capital programming that has traditionally been the focus of investment strategy development, incorporating maintenance costs and benefits into this process may require incorporation of additional performance measures, such as those established through Maintenance Quality Assurance (MQA). MQA performance measures are often more directly related to investments in maintenance activities, whether through in-house crews or contracts. NCHRP Report 1076, Guide for Incorporating Maintenance Costs into a TAMP suggests the following steps for developing investment strategies that fully incorporate maintenance investments and benefits (Allen et. al. 2023).
- Define the role of maintenance in each scenario.
- Identify existing commitments to future investments in maintenance.
- Incorporate MMS and MQA data to improve predictions of future conditions.
- Perform initial budget allocations, including maintenance.
- Identify candidate projects and field crew capacity.
- Develop scenarios for analysis.
- Review predicted future conditions and predicted maintenance needs.
- Finalize funding levels by use.
- Document maintenance strategies for addressing performance gaps.
- Document assumptions and strategies.
Practice Examples:
Virginia DOT
TAM Maintenance and Operations
The Virginia DOT maintains most of the assets on state roads. For pavements and bridges, there are asset leads at both the central office…
Utah DOT
When meeting with legislators, the UDOT CEO uses the agency’s Strategic Directions Dashboard on a tablet device to communicate TAM-rela…
Colorado DOT
Each year, the Colorado DOT must report to its legislature on the statewide highway infrastructure and the agency’s ability to meet tho…
Washington State DOT
When seeking to establish the connection between investments and performance across a wide range of assets or roadway attributes such as …
New Zealand Transport Agency
Establishing Desired Maintenance Levels of Service
New Zealand Local Government Act legally requires councils to consult with their communities on their long-term plans. The consultation p…
South Dakota DOT
Use of Incremental Benefit Cost to Demonstrate Long-Term Benefits
To analyze the benefits of potential actions at the network level, South Dakota DOT (SDDOT) uses incremental benefit cost (IBC) analysis …
Minnesota DOT
Using Computerized Management Systems to Optimize Life Cycle Management
In its 2019 Transportation Asset Management Plan (TAMP), MnDOT went beyond the scope of pavements and bridges as mandated by 23 CFR Part …
Ohio DOT
Use of a Pavement Management System to Establish a Life Cycle Strategies
As required under MAP-21, Ohio DOT conducted a risk assessment to identify the most significant threats and opportunities to its pavement…
Halifax Regional Water Commission
Deterministic Modeling of Culvert Condition
Halifax Regional Water Commission (Halifax Water) has employed a deterministic modelling approach to create a plan for their storm water …
AASHTO
Linking Maintenance Strategies and TAM Policies
The following hypothetical examples show how policy and management strategy work together to deliver transportation services and manage r…
Fredericton Transit (Canada)
Life Cycle Management Across a Diverse Portfolio
The City of Fredericton has, over the last 15 years, implemented several life cycle management strategies that have significantly changed…
South Dakota DOT
South Dakota's Resource Allocation Process
SDDOT’s agency mission is “to efficiently provide a safe and effective public transportation system.” To support this high-level go…
Practices:
Levels of Service
- Customers are identified, but outreach is not formalized.
- Some technical levels of service or KPIs are defined and considered when intervention alternatives are being evaluated.
- Customer groups are defined and some communication practices are in place to assess wants.
- KPIs are established, but may not be tightly tied to business decisions.
- Maintenance levels of service are established, but there is not a tight connection to KPIs.
- Technical levels of service are defined, and measured to evaluate the effectiveness of past investment and operational decisions.
- Customer groups are defined and clear policies and procedures are in place to assess wants.
- Customer-based KPIs and maintenance levels of service are established at the strategic, tactical, and operational levels.
- Agency performance is routinely measured and reported to all internal and external stakeholders.
Managing Assets for their Life Cycle
- Alternative management strategies are considered for high value/critical asset classes in the portfolio and selected based on efficiency and effectiveness of the transportation network.
- Asset reliability is qualitatively considered in a systematic way for some asset classes.
- Reactive and interval-based approaches that are based on risk assessments are used where appropriate.
- Management strategies are periodically re-evaluated to determine if a change in management practice would be more effective.
- Deployment of maintenance crews, capital projects, and network operation resources are coordinated to ensure the right interventions are occurring in the right locations, at the right time on the transportation network to deliver mobility service levels at an acceptable cost and level of risk.
- Appropriate condition, interval and reactive based management strategies have been established for most asset classes.
- Asset reliability is well understood and is aligned with risk tolerance in the agency.
- Assets are planned, acquired and managed with an awareness of the costs, risks, and service performance characteristics over the entire life cycle.
- Appropriate management strategies are established and periodically re-evaluated to determine if a change in management practice would be more effective.
- Deployment of maintenance crews, capital projects, and network operation resources are coordinated to ensure the right interventions are occurring in the right locations, at the right time on the transportation network to deliver mobility service levels at an acceptable cost and level of risk.
- Appropriate condition, interval and reactive based management strategies have been established for every asset class in the portfolio, to support management of the transportation network efficiently and effectively.
- Asset reliability is well understood and is aligned with service expectations and risk tolerance in the agency.
- Strategic, tactical and operational activities directly consider alternatives that balance service delivery and investment of resources.
- Reactive and interval-based approaches that are based on risk assessments are used where appropriate.
- Management strategies are periodically re-evaluated to determine if a change in management practice would be more effective.
- Deployment of maintenance crews, capital projects, and network operation resources are coordinated to ensure the right interventions are occurring in the right locations, at the right time on the transportation network to deliver mobility service levels at an acceptable cost and level of risk.
Data and Systems for Life Cycle Management
- A computerized maintenance management system is being implemented/customized to better understand operations and maintenance activities within the agency.
- Some basic asset modeling is used to predict asset performance in the future for financial planning purposes.
- Computer management systems meeting the minimum federal requirements are implemented and used for compliance.
- A computerized maintenance management system captures operations and maintenance costs within the agency and assigns these to assets appropriately.
- Appropriate probabilistic and deterministic modeling techniques are used to predict asset performance for high value assets.
- A computerized maintenance management system captures operations and maintenance costs within the agency, and supports trade-off analysis between capital investment and operations and maintenance intervention alternative tactics
- Appropriate probabilistic and deterministic modeling techniques are used to predict asset performance in the future, and inform financial planning and intervention selection.
Monitoring the State of Assets
- Asset data collection and management is in transition to better support timely and accurate performance reporting.
- The performance measurement framework is evolving to improve goal alignment and trend the agency to desired outcomes.
- Asset data collection and management supports performance reporting.
- Periodic review of performance measurement framework is carried out to confirm measures are appropriate, aligned with objectives and suitable to trend the agency to desired outcomes.
Monitoring Asset Work and Costs
- The agency is improving its ability to track operations and maintenance costs and capital investments and link them to assets in the portfolio.
- Some departments can analyze the effectiveness and efficiency of their alternative interventions.
- The agency tracks operations and maintenance costs and capital investments, and these are linked to the asset to which they apply.
- Analysis is periodically carried out to assess efficiency of alternative interventions.
- The agency has accurate method of tracking operations and maintenance costs and capital investments, and these are linked to the asset to which they apply.
- Analysis is periodically carried out to assess the effectiveness and efficiency of the alternative interventions and trade-off between maintenance and capital decisions.
Information and Systems
- Agency information systems are unintegrated, however the current portfolio of systems are well mapped, and an improvement plan is in progress to improve integration toward a clearly defined future state that is suited to agency requirements.
- Agency information systems are partially integrated, interconnected and a plan is being implemented to create a system that is suited to agency requirements.
- Agency information systems are fully integrated. Systems supporting inventory management, data warehouses and statistics, inspections and condition assessments, maintenance management, performance modeling, analytics, forecasting and financial systems are interconnected and are suited to agency requirements.
Collecting Asset Data
- Collection occurs periodically and data is maintained, current and accurate.
- Data collection strategies are targeted to agency decision-making requirements.
- Collection occurs periodically and data is maintained, current and accurate.
- Data collection strategies are targeted to agency decision-making requirements, and collection resources add value.
- Collection occurs periodically and data is maintained, current and accurate.
How To Guides:

How to Optimize Treatment Timing

Quantifying the Effects of Preservation Treatments on Pavement Performance
Checklists:
Characteristics of Strong Performance Measures for Managing the Condition of Ancillary Assets
September 1, 2019 | FHWA
This handbook presents a methodology that will aid highway asset owners and maintenance personnel with determining what assets, beyond pavements and bridges, are most important to support their agencies' missions and goals. The methodology prioritizes asset classes and identifies data related to those assets that best support a performance-based approach to managing the condition and utilization of those assets.
External Link: https://www.fhwa.dot.gov/publications/research/infrastructure/19068/index.cfm
August 11, 2011 | SAE International
A Guide to the Reliability-Centered Maintenance (RCM) amplifies and clarifies each of the key criteria listed in SAE JA1011 (“Evaluation Criteria for RCM Processes”), and summarizes additional issues that must be addressed in order to apply RCM successfully.
External Link: https://www.sae.org/standards/content/ja1012_201108/
August 1, 2009 | SAE International
This document describes the minimum criteria that any process must possess to be deemed a compliant RCM process. It is intended to provide a means for evaluating whether a given process remains true to the tenets of RCM as it was originally conceived.
External Link: https://studylib.net/doc/25686202/23.-sae-ja1011---2009---evaluation-criteria-for-reliabili...
March 1, 2023 | Transportation Research Board
This document, the Bridge Inspector’s Reference Manual (BIRM), is a comprehensive reference manual on programs, procedures, and techniques for inspecting and evaluating a variety of in-service highway bridges. It was intended to replace the Bridge Inspector’s Reference Training Manual (BITM) 90 which was first published in 1991 to assist in training highway personnel for the new discipline of bridge safety inspection.
External Link: https://trid.trb.org/view/2219426
January 1, 2018 | FHWA
This resource provides information on performance monitoring. Performance measures are used to prioritize projects, provide feedback on the effectiveness of long-term strategies, refine goals and objectives, and improve processes for the delivery of transportation services.
External Link: https://tmcpfs.ops.fhwa.dot.gov/cfprojects/uploaded_files/tms_pmer_brochure.pdf
September 1, 2015 | Transportation Research Board
Maintenance Quality Assurance Field Inspection Practices summarizes practices used by state transportation agencies to support maintenance investments.
External Link: https://www.nap.edu/catalog/22201/maintenance-quality-assurance-field-inspection-practices
January 1, 2022 | Transportation Research Board
The TRB National Cooperative Highway Research Program's NCHRP Research Report 1008: Attracting, Retaining, and Developing the 2030 Transportation Workforce: Design, Construction, and Maintenance provides a guide with specific strategies and action plans to help agencies identify and address workforce needs through 2030 and beyond.
May 3, 2022 | Transportation Research Board
America’s “crumbling roads” currently headline the infrastructure zeitgeist, but deteriorating sidewalks are also in desperate need. This research instead seeks to uncover the similarities and differences in how American cities treat their road versus sidewalk networks by asking: are these two indispensable assets of daily urban public life repaired, maintained, and funded disparately?
External Link: https://trid.trb.org/view/1945979
June 7, 2019 | CTEDD
This resource prooses that in order to maintain the aging infrastructure in a state of good repair under shrinking budgets, local governments must adopt a systematic approach to conduct cost-effective maintenance, rehabilitation, and reconstruction (MR&R) instead of relying on subjective individual knowledge and experience.
External Link: https://rosap.ntl.bts.gov/view/dot/65589
January 1, 2019 | Transportation Research Board
Geotechnical Asset Management for Transportation Agencies, Volume 2: Implementation Manual presents a manual that can be used to implement Geotechnical Asset Management (GAM) planning.
October 1, 2022 | FHWA
Incorporating Maintenance Costs into a Transportation Asset Management Plan, from TRB's National Cooperative Highway Research Program, documents research conducted to develop a framework that state DOTs and other transportation agencies can use to incorporate maintenance costs into their TAMP.
External Link: https://nap.nationalacademies.org/catalog/27290/incorporating-maintenance-costs-into-a-transportation-asset-management-plan
January 1, 2023 | Transportation Research Board
A Guide to Incorporating Maintenance Costs into a Transportation Asset Management Plan, from TRB's National Cooperative Highway Research Program, leads practitioners through a six-part framework designed to tackle the biggest challenges agencies face in projecting future maintenance costs in TAMP activities.
External Link: https://nap.nationalacademies.org/catalog/27291/a-guide-to-incorporating-maintenance-costs-into-a-transportation-asset-management-plan