Topic: Performance Management
Performance Management
This page features information on performance management for TAM. Whether you are selecting performance measures, monitoring performance-based data, or monitoring improvements, you will find what you need here.
Overview:
Implementation Considerations:
Related Subsections:
Performance Management 2.2.2
Asset management utilizes performance management to set objectives, define measures, establish targets, and monitor results. Transportation Performance Management (TPM) relies on the TAM principles and process to help achieve the agency's broader goals and objectives.
Relationship to Federal TPM Activities
The MAP-21 Act (2012) established a performance-based program intended to focus Federal Aid highway program and public transportation system (e.g., bus, light rail, and ferry) investments on national transportation goals. It was also intended to increase accountability and transparency in the use of federal transportation funds, as well as improve project decision-making through the strategic use of system performance information. The performance-based provisions of MAP-21 were retained in the FAST Act in 2015.
TPM is defined by FHWA as a strategic approach to making investment and policy decisions to achieve national performance goals using system information in accordance with rules established by the Department of Transportation (see Figure 2.3). The FHWA recognizes asset management as the application of TPM to manage the condition of infrastructure assets needed to provide for mobility and safety in the nation’s transportation system. In short, the FHWA refers to asset management as the engine driving infrastructure performance.
Figure 2.3 FHWA's Strategic Approach to TPM
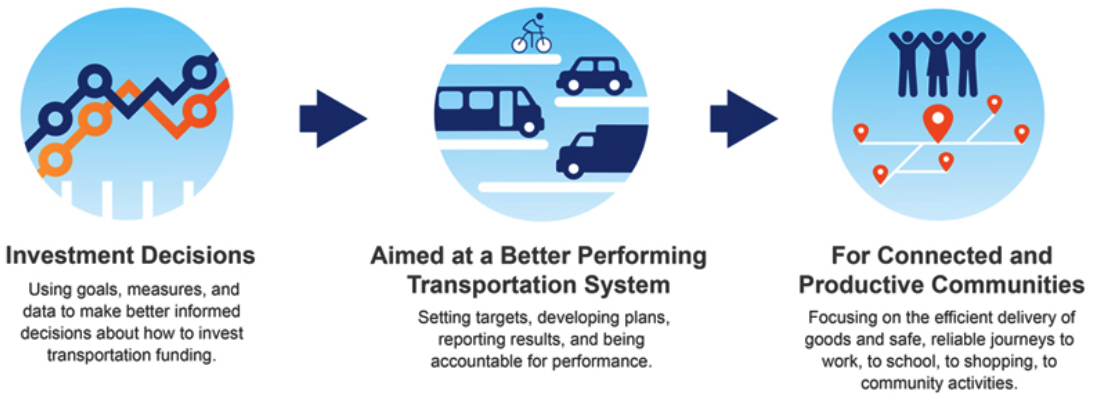
Source: FHWA TPM Homepage. 2019 https://www.fhwa.dot.gov/tpm/
Asset management plans document the processes and investment strategies developed by an agency to manage its infrastructure assets. These asset management plans support an agency’s performance-based planning and programming processes for making long-term investment decisions and feed shorter-term project and treatment selection activities. Together, these activities ensure the investment decisions of an agency are aligned with performance objectives and goals.
TPM Regulations
The TPM provisions for highways included in federal law are implemented in accordance with rulemakings organized around the following six elements:
- National goals – focusing the Federal Aid highway program on the seven areas listed below:
- Congestion reduction
- System reliability
- Environmental sustainability
- Freight and economic vitality
- Infrastructure condition
- Reduced project delivery delays
- Safety
- Measures – assessing performance or condition in carrying out the TPM-based Federal Aid highway program
- Targets – funding recipients are required to document future performance expectations under a fiscally-constrained environment
- Plans – identifying strategies and investments for addressing performance needs
- Reports – documenting progress toward target achievement and investment effectiveness
- Accountability and transparency – requiring federal funding recipients to achieve or make significant progress toward targets
TPM Relationship with TAM
There is a close relationship between TPM and TAM, since both consider asset and system performance, risks and available resources to achieve desired objectives over time. Both rely on a strategic approach, using data to make investment and policy decisions in order to achieve performance objectives. Internationally, there is less distinction between asset management and performance management, with the IAM defining asset management as encompassing the “balancing of cost, opportunities and risks against the desired performance of assets to achieve the organizational objectives.” In the United States, TAM applies to the technical and financial decisions, plans and actions related to physical infrastructure, while TPM considers a broad range of system performance categories.
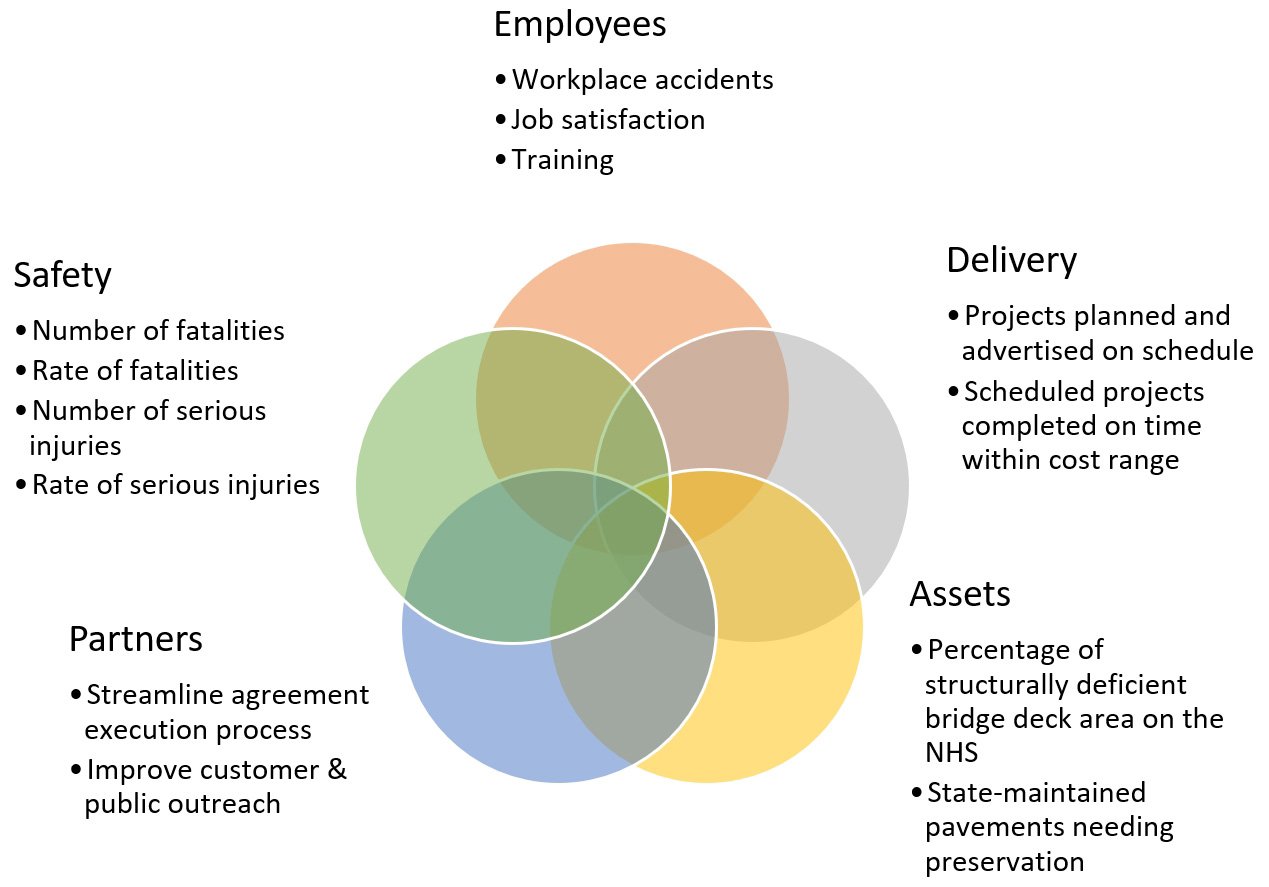
A graphic illustrating the integration of asset management and performance management is provided in Figure 2-4. In the figure, the circle on the left represents the interconnection of the various performance areas that transportation agencies are concerned with throughout their planning processes. Flowing into the performance circle is the asset management circle, representing an agency’s infrastructure needs to support system performance.
The FHWA’s Expert Task Group (ETG) published a white paper explaining the relationship between asset management and performance management. It acknowledges the performance of a transportation system is dependent on many factors, including operational characteristics, and system usage and demand, in addition to the physical condition of the infrastructure assets. The paper explains that “performance management focuses on how policies, resource allocation, and other decisions affect all aspects of system performance including safety, operations, environmental stewardship, and infrastructure condition.” (FHWA 2019) Asset management is described as an application of performance management principles with a long-term focus to manage the performance of infrastructure assets, the resources allocated to operate a transportation system, and the investments made to achieve the agency’s long-term goals and objectives.
Figure 2.4 Integration of Performance Management and TAM
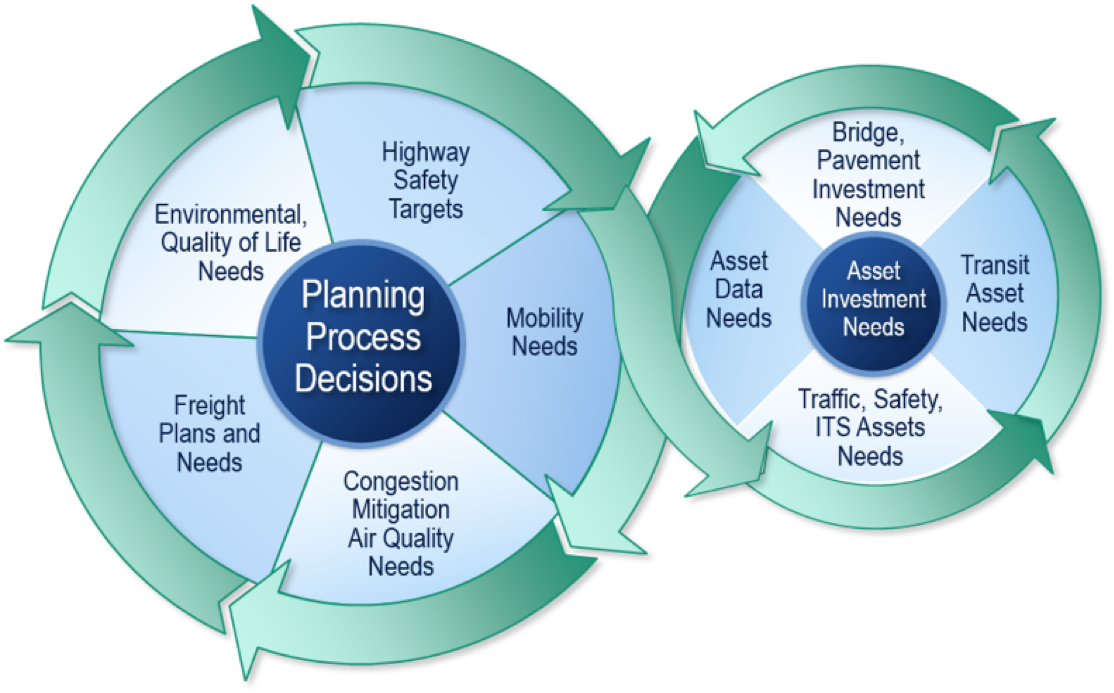
Source: NHI 136106A, Introduction to Transportation Asset Management. 2019
British Columbia
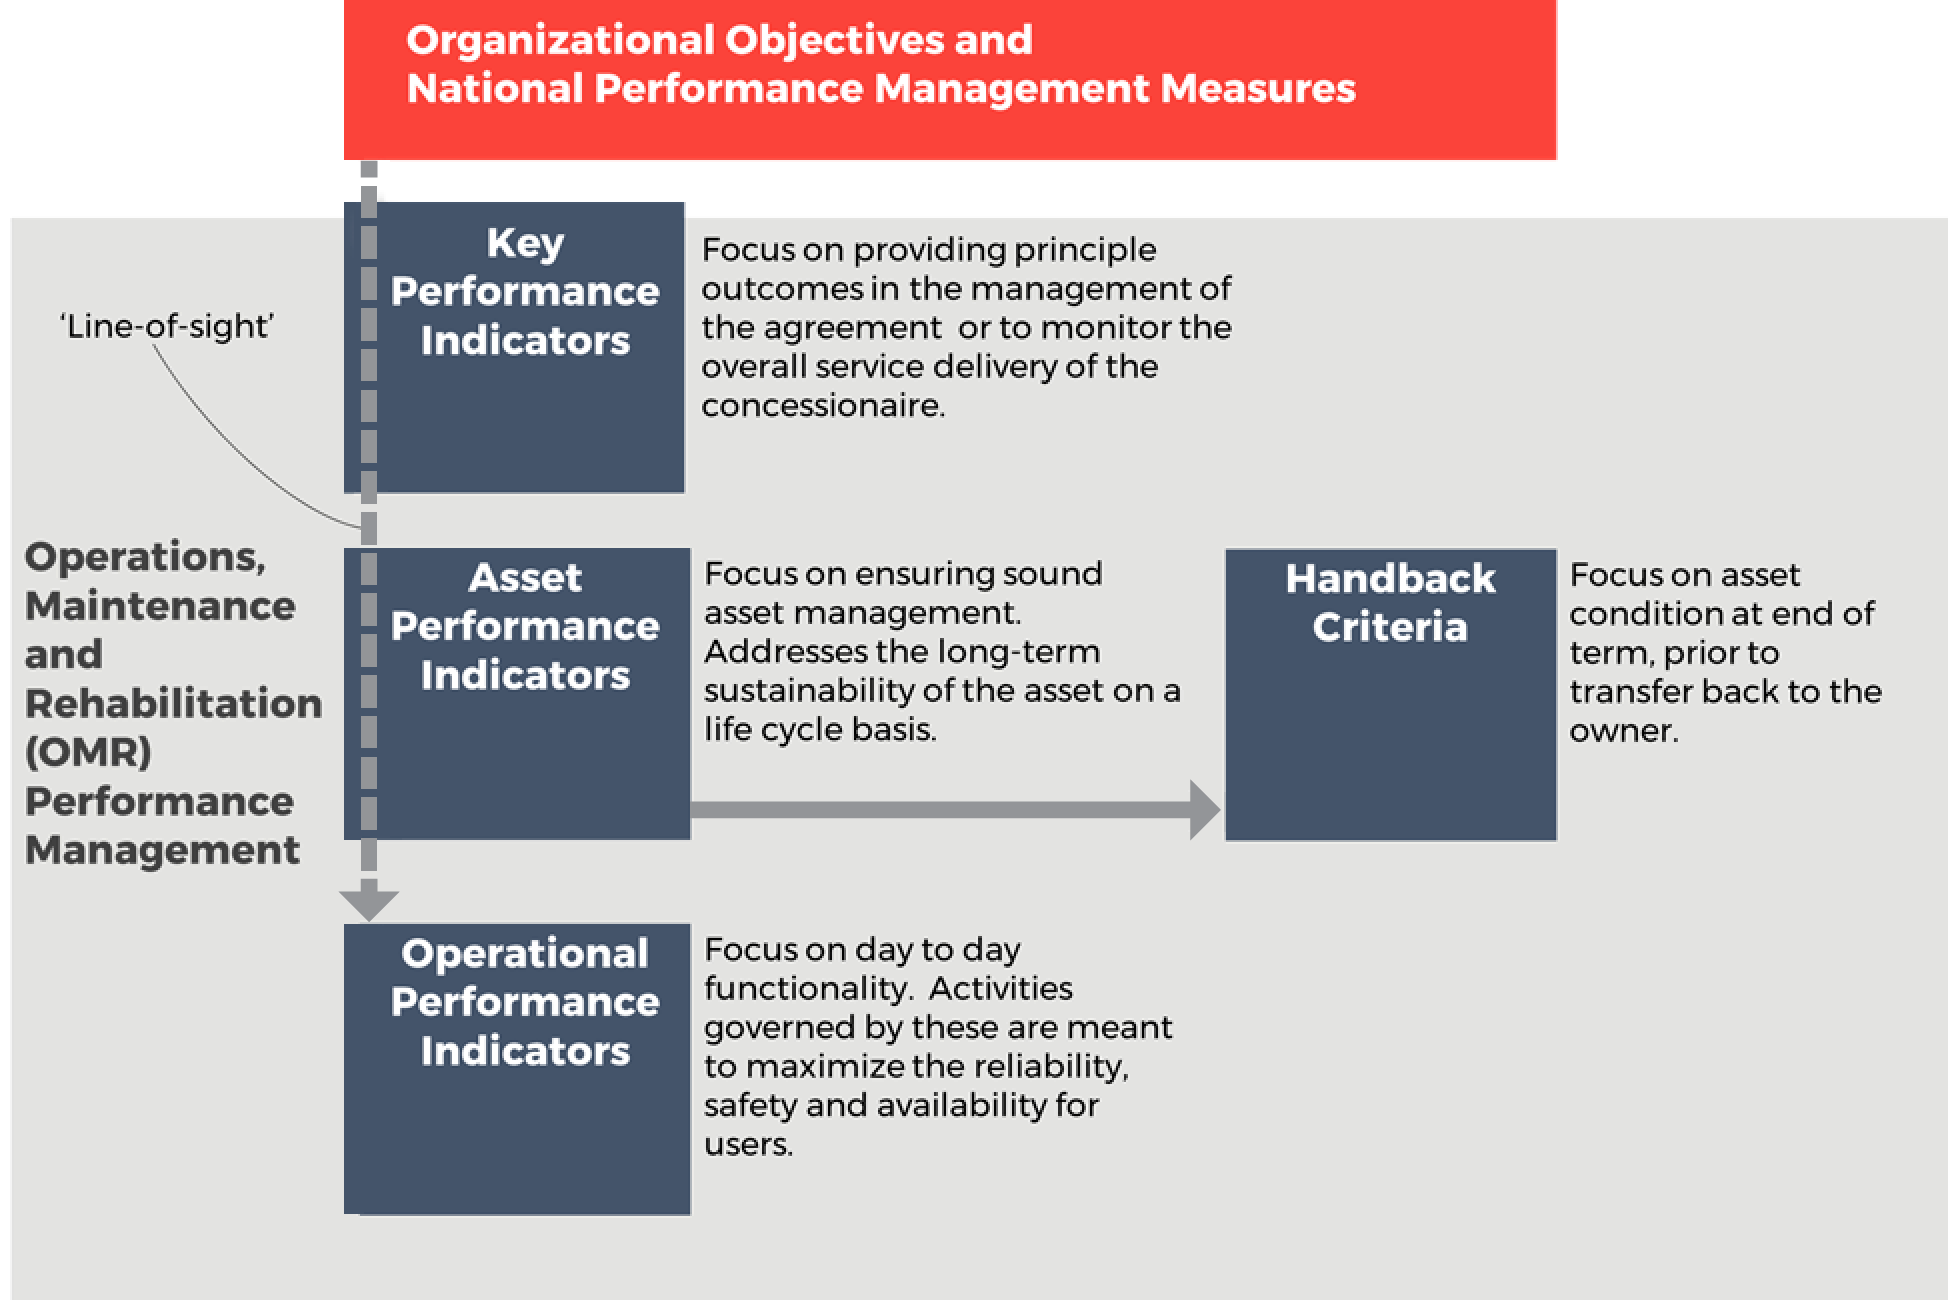
To support the alignment of agency policies, objectives and day-to-day practices, the Province of British Columbia established the tiered structure shown in Figure 2.5 for a design-build-finance-operate project. The highest of the three levels, Key Performance Measures, defines the high-level outcomes for service delivery in terms of a few key strategic areas. The second level, Asset Preservation Performance Measures, defines the minimum acceptable condition levels for each of the individual assets to preserve their value. The third level, Operational Performance Measures, corresponds to the many specific requirements for operating and maintaining the highway in a safe manner on a day-to-day basis. The tiered approach helped align stakeholders at all levels and clarified priorities for all parties.
Performance Management Framework
To support the alignment of agency policies, objectives and day-to-day practices, agencies may establish a tiered performance management framework, such as the example illustrated below for a model Design-Build-Finance-Maintain-Operate (DBFMO) project (Figure 2.5). The highest of the three levels, Key Performance Measures, defines the high-level outcomes for service delivery in terms of a few key strategic areas. The second level, Asset Preservation Performance Measures, defines the minimum acceptable condition levels for each of the individual assets to preserve their value. The third level, Operational Performance Measures, corresponds to the many specific requirements for operating and maintaining the highway in a safe manner on a day-to-day basis.
Further discussion on Performance Management Frameworks, defining Performance Measures and Performance Targets is included in Chapter 6.
Figure 2.5 Typical Performance Management Framework used in a DBFMO Project
For the transit community, TCRP Research Report 198 presents a framework for developing relationships between service quality and asset conditions, using a variety of transit system performance and customer satisfaction attributes. The research conducted in developing the report found many correlations between asset condition and performance, as noted below (Spy Pond Partners, et.al, 2018).
- Asset condition is related to the quality attributes of Frequency, Reliability, and Travel Speeds. As assets decline in condition, failures become more likely, reducing frequency, reliability, and average speeds.
- Asset condition is related to Appearance/Aesthetics in that customer perceptions of this factor are likely to be worse when assets are in poor condition and/or are technically obsolescent.
- Asset condition is related to other service quality attributes, including Comfort, Ease of Access, Environmental Impact, Information, Safety, and Security. For these attributes, increasing asset failures may affect quality, although the effects may be difficult to model. For instance, reduced service frequency resulting from increased failures can lead to greater crowding and less comfort. A particularly challenging area is safety. Given that operating severely deteriorated assets could compromise safety, in theory and in general practice, transit agencies establish thresholds for safe operations and remove an asset from service, rather than operating unsafely. Thus, potential safety issues tend to become operational issues, rather than actual safety issues. Regardless, customer perceptions are likely to be worse when assets are in poor condition for these factors, as in the case of Appearance/Aesthetics.
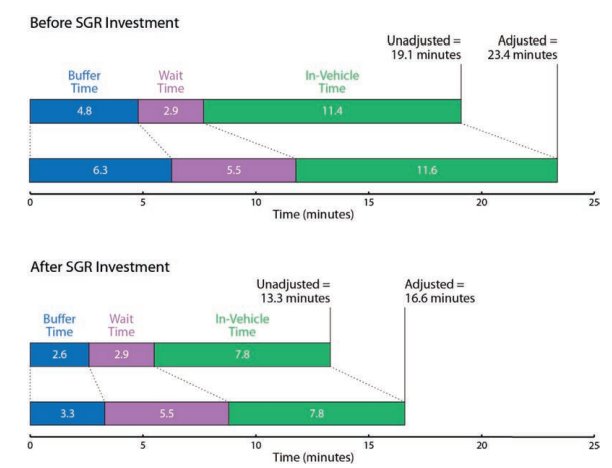
In one example, the impact of State of Good Repair (SGR) investment on the calculation of Effective Journey Time (EJT) is demonstrated. The example illustrates the differences in the calculated unadjusted and adjusted journey time, both before and after SGR investment, for a hypothetical rail line. Although the calculation is not based on actual data, it is intended to show that, after a SGR investment, both the adjusted and unadjusted journey times decrease. Before investment, the actual journey time for all components is 19.1 minutes, increasing to 23.4 minutes when adjustment factors are included. Following an investment in improved vehicles and track, these journey times decrease to 13.3 and 16.6 minutes. Looking closer at the components of time that change in this example, the decrease in buffer time after SGR investment indicates that travel times are more reliable and passengers do not have to build in as much buffer when planning their trips. Overall, in this example, SGR investments reduce EJT an average of 6.8 minutes per trip. This savings can be multiplied by an average value of time and number of trips per year to yield a prediction of the annual user benefit resulting from the investment. The results can be used in a variety of ways to analyze asset conditions and service quality.
Figure 2.5-B Comparing Adjusted and Unadjusted SGR Investment
Minnesota DOT
The Minnesota DOT’s performance management system consists of clear policies, performance trend data and performance forecasts to guide investments and operational decisions. The system is designed to (http://www.dot.state.mn.us/measures/):
- Address stakeholders’ desire for accountability and transparency
- Provide more informed decision-making and solutions to increasing challenges
- Enhance customer-responsiveness
- Ensure compliance with legislators' mandates
- Improve internal management
- Facilitate refinement of programs and services
- Set benchmarks for comparison of results
MnDOT uses performance criteria to guide capital investments and annual operational budgets. Transportation system and agency performance reports are regularly reviewed by MnDOT management. The ongoing measurement and review process assists MnDOT in evaluating the efficiency of service delivery and assessing the effectiveness of program activities. This objective-based approach increases transparency, and encourages innovation by keeping the focus on outcomes.
The accountability and transparency provided by MnDOT’s performance management system has contributed to MnDOT’s reputation among elected officials as a trusted partner in addressing challenging issues.
Accountability and transparency are a foundation of success for public agencies. The benefit is increased trust. This can help elected officials view MnDOT as a trusted partner and work together on challenging issues. Confidence in agency decision-processes and results is important to legislators considering new investments.
Assessing Current Practice 2.3.1
An assessment of current agency competency against industry-leading practice enables an agency to assess a desired future performance level. It can also help to identify the steps required to reach that goal.
TAM is an evolving process; ongoing improvement is an important component for a TAM program. In fact, the ISO 55001 Asset Management certification requires ongoing assessment and continual improvement.
A gap assessment process is used to understand how well an agency aligns with an established asset management framework. The gap assessment can be conducted internally or by a third party. Organizations seeking or wanting to maintain ISO certification will also undergo a formal third party audit.
The results of a gap assessment can help agencies identify changes in business processes needed to better link plans and decisions and better align to leading practice.
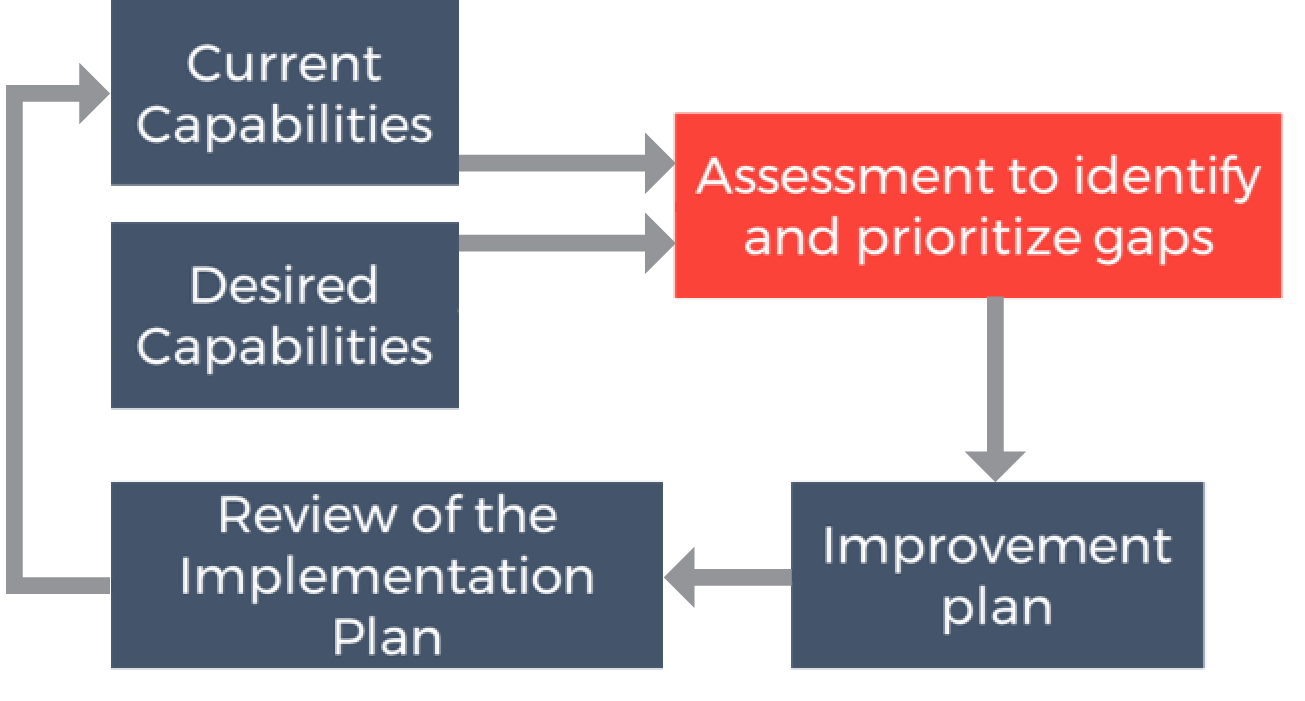
NCHRP Project 08-90 led to the development of a gap analysis tool, available through AASHTO and the TAM Portal. Figure 2.8 illustrates how this assessment tool is intended to be used. There are several other frameworks that can be used, including ISO 55001 and the Institute of Asset Management (IAM). A range of gap assessment framework’s are discussed further in Table 2.1. Each framework, process or tool will enable an agency to assess current performance and, from this, identify a desired capability level.
Figure 2.8 TAM Improvement Cycle
Source: Modified from original in NCHRP Project 08-90
TIP
Factors to consider when prioritizing advancement in TAM approaches will vary from agency to agency. Consider those factors that are of most importance to you and are well-aligned to your strategic goals.
In some cases, agencies also seek benchmarks that reflect how peers are performing to help them decide on the level of maturity and complexity to which they should aspire. ISO 55001 trends away from this. It encourages agencies to check against a framework of practices and process, and select what is best for the agency. Chapter 6 addresses benchmarking and related topics.
Actions to close gaps between desired and actual performance should be addressed within a TAM improvement or implementation plan.
Undertaking a gap assessment can form an important part of a change management process by aligning those within the agency on current performance, opportunities and targets for improvement.
Table 2.1 - Frameworks for Assessing Current Practice
| Framework | NCHRP 08-90 Gap Analysis Tool | ISO 55001 Asset Management Gap Analysis | International Infrastructure Manual (IIMM) | IAM Self-Assessment Methodology |
|---|---|---|---|---|
| Background | This tool was developed based on the tool and process created through development of the 2011 AASHTO TAM Guide. Uses a point scale for evaluating current and desired capabilities. See more | This is the most widely adopted standard for asset management globally. It is generic to accommodate many contexts. Describes a management system approach to asset management. See more | Recognizing that the ISO Standards for asset management are very much the “What to do”, the IIMM looks to provide the “How to do it”. Identifies an Asset Maturity Index (Aware, Basis, Core, Intermediate, Advanced) to identify the current and an appropriate level of asset management for each asset. See more | As an aid to the application of ISO 55001, the IAM decided to update their methodology into one that enables organizations in all sectors to measure their capabilities against the requirements of both PAS 55 and ISO 55001. See more |
| Assessment or Focus Areas |
|
|
|
|
| Why use this framework? | This framework is best for an agency that wants to work explicitly within a US-defined context that adopt wider influences. Since this tool can be fully customized by an agency, an agency that wants to tailor the analysis to their particular needs will find this useful. Finally, the tool facilitates the analysis of data, and can generate graphs and charts using the data imported into it. | This framework is ideal for agencies that want to adopt a world-recognized approach to asset management that provides a developed asset management lexicon. This is currently the most internationally-recognized standard in the world. | This framework has been refined over time with many examples that illustrate successful application of concepts by organizations. Public agency focused, and largely written for the asset management practitioner responsible for civil assets. | This standard is well recognized internationally, is infrastructure agnostic, and has applicability to infrastructure owners in both the private and public sector. It has many other resources developed along with the framework including training materials, reference guides and courses to upskill an agency. |
Amtrak
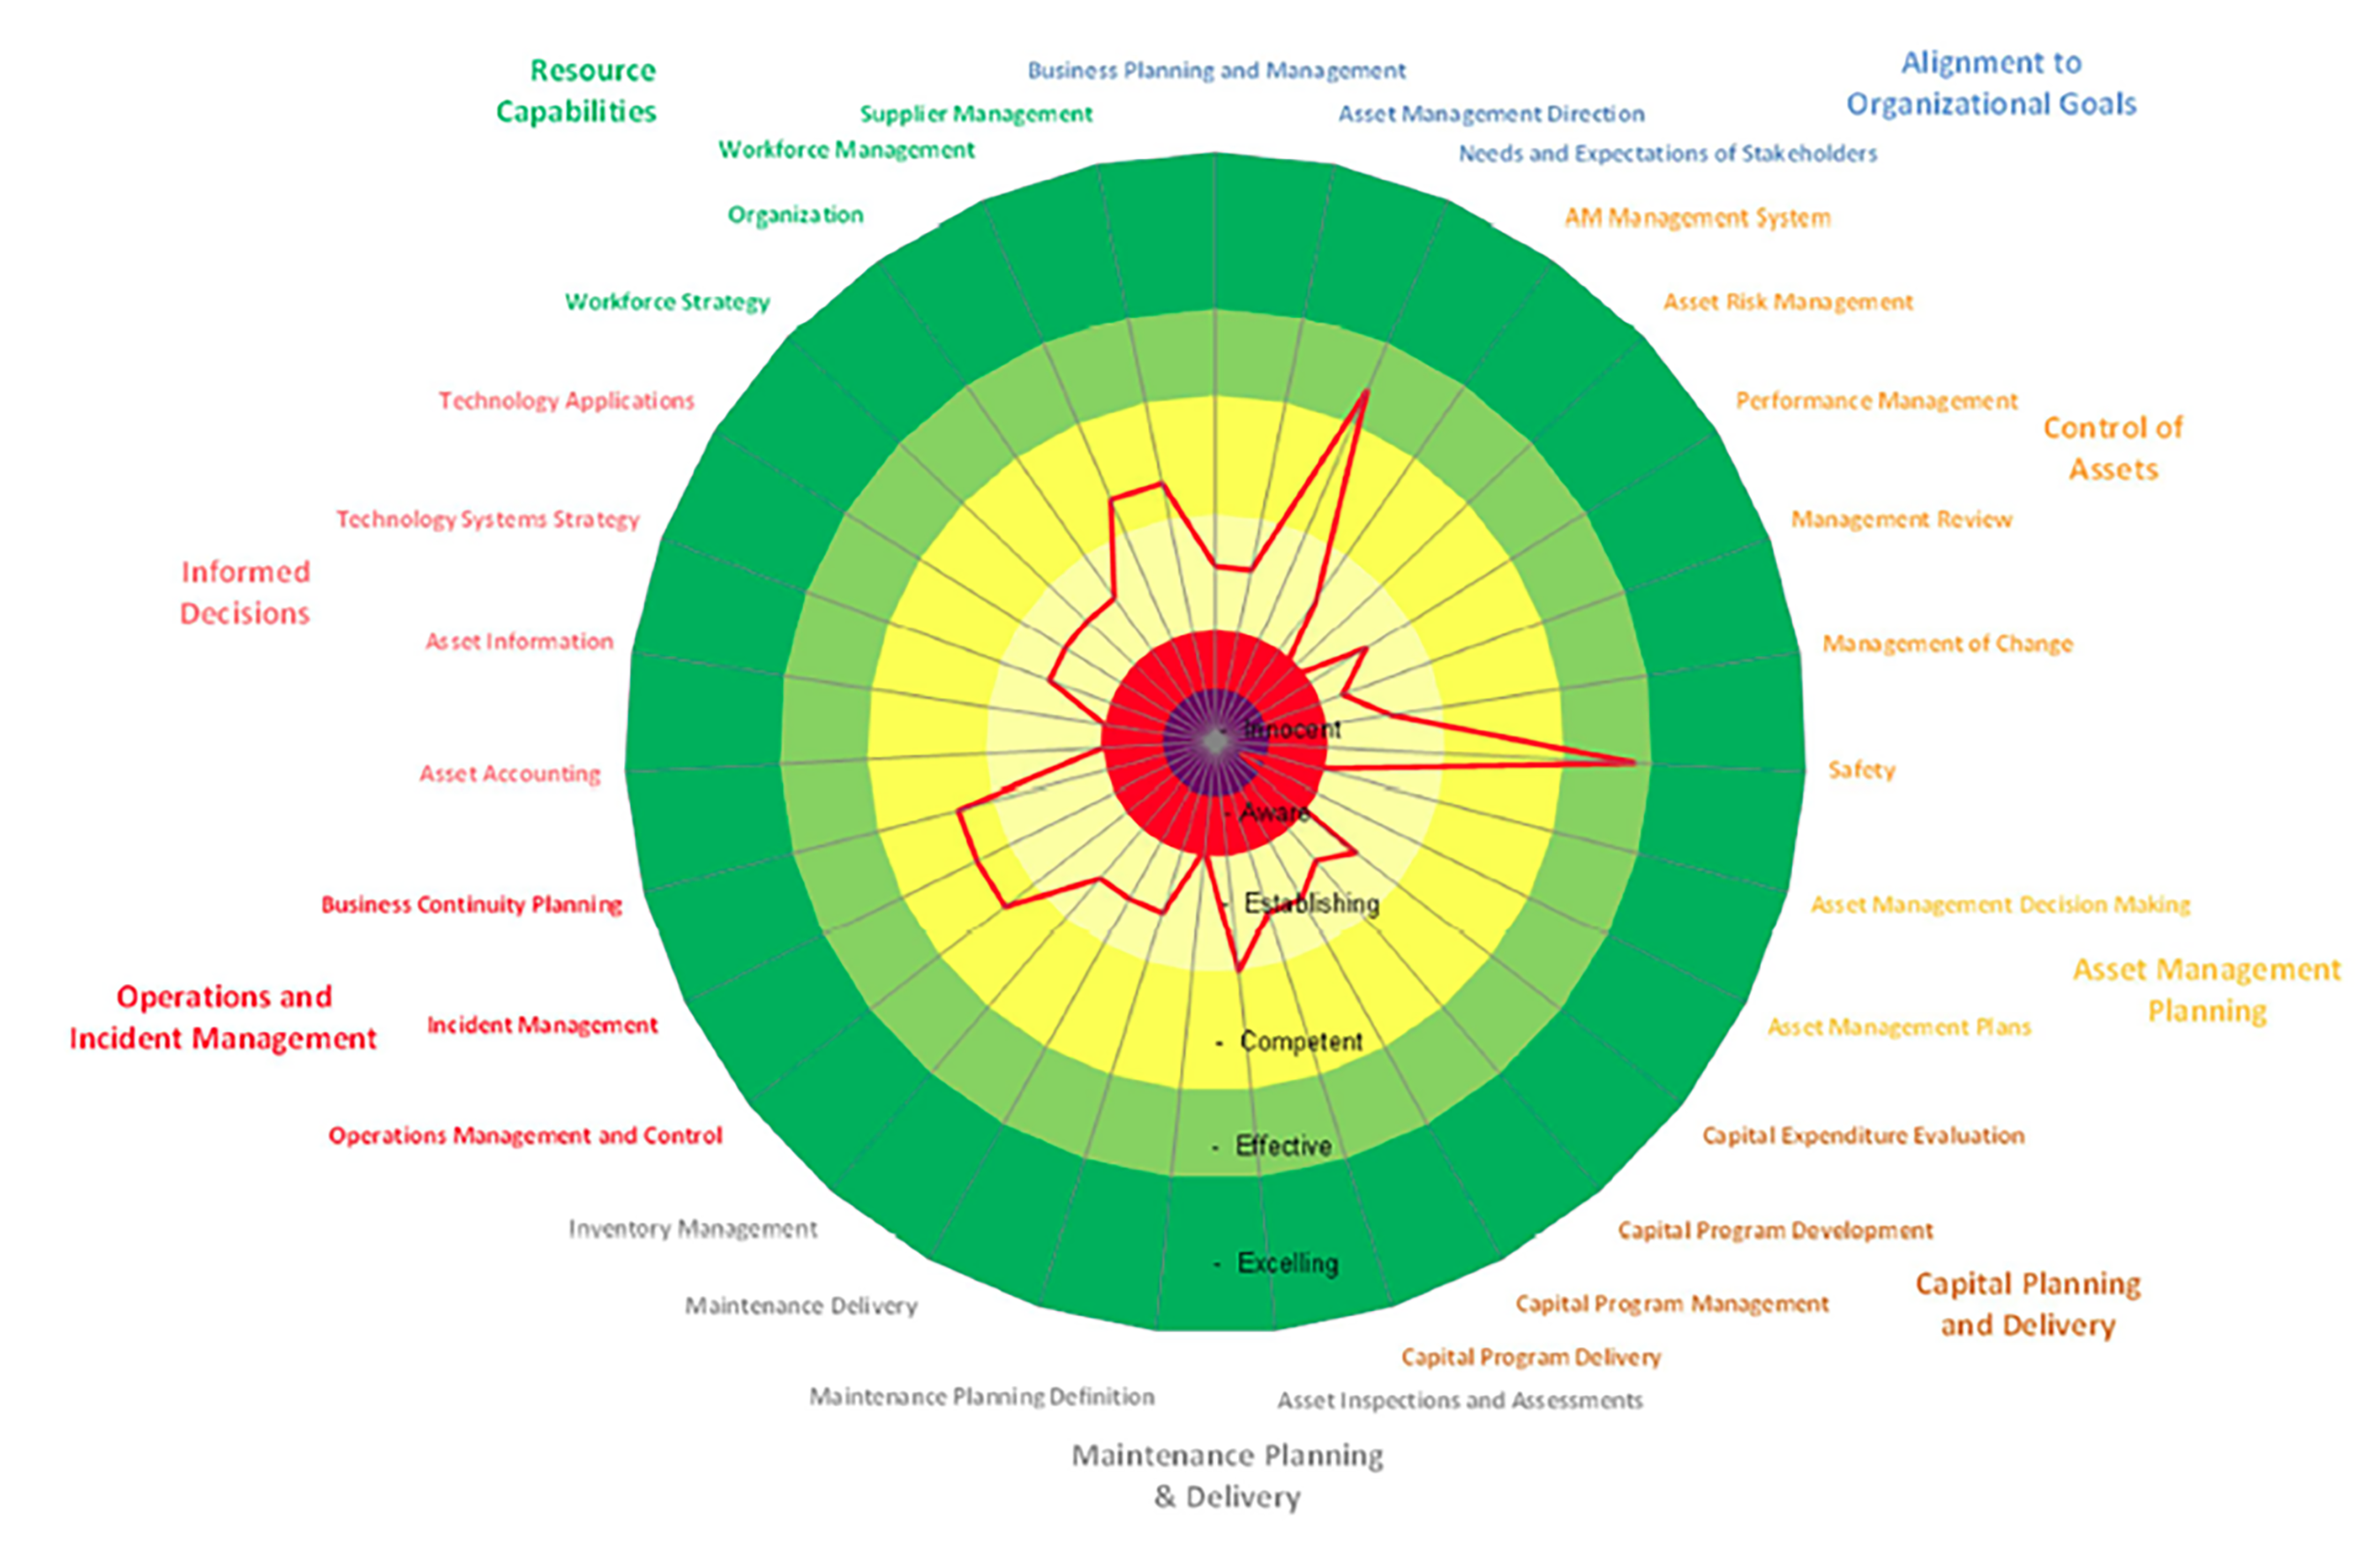
In 2016, Amtrak Engineering undertook an Asset Management Capability Assessment which bases maturity on the degree of formality and optimization of processes. The assessment uses several questions grouped into eight assessment areas, which describe operational processes necessary for asset management success. This maturity methodology is aligned with emerging guidance from the Institute of Asset Management (IAM), ISO 55001 standards, and requirements of the US FAST Act.
The assessment used a six-point scale, scoring Amtrak at the Establishing level, indicative of an agency that is actively developing asset management capabilities and establishing them to be consistent, repeatable, and well-defined.
Based on the 2016 assessment results, key challenges were identified and a series of improvement recommendations were developed and integrated into an Asset Management Improvement Roadmap.
In addition, Amtrak established a target position, driving process implementation priorities, with the intention of continuous monitoring by repeating the capabilities assessment process on an annual basis.
2016 Amtrak Asset Management Capabilities Assessment Results
Source: Amtrak Engineering 2019
Defining and Prioritizing Improvement in TAM Approaches 2.3.2
Agencies managing different types of assets are faced with the decision of where to prioritize advancing formal asset management. Determining where to improve the organizations effort can depend on different factors, but should always align with the organizational context and priorities.
TAM Webinar #61 - TAM Innovations
For transportation agencies, asset management typically begins with the high-visibility, high-value assets, such as pavements and bridges. However, operating the transportation system requires a supporting cast of assets, typically referred to as ancillary assets, that include lighting structures, roadway signs, ITS assets or even operations facilities and technology hardware components. Establishing the appropriate management approach, and future desired approach for each asset is an essential step in strategic planning for asset management, defining boundaries around the effort. Furthermore, for each type of asset, it is important to determine how broadly to define the inventory of assets, such as the decision to include only arterial roads initially or all roads in a network.
Defining Appropriate Management Approaches for Different Asset Categories
An appropriate approach to manage and monitor each asset governed by the TAM framework needs to be established. Depending on the nature of the asset and the level of risk involved, different approaches can be selected by an agency.
Structuring asset management also involves evaluating different management approach- es and defining the appropriate level of maturity. There are several approaches to managing highway assets, each with different data needs, and several ways to structure and implement asset management processes. These include:
- Reactive-Based. Treatment is performed to fix a problem after it has occurred.
- Interval-Based. The asset is treated based on a time or usage basis whether it needs it or not.
- Condition-Based (Life Cycle Approach). Select intervention based on a forecasted condition exceedance interval.
Chapter 4 provides more details on these different approaches to managing assets.
Processes and approaches can range in their level of detail and complexity. This is what forms the foundation of some asset management maturity levels. Much like deciding on the scope of assets to manage, the level of advancement of the asset management processes an agency adopts should depend on the context and readiness of the agency, as well as the problem being addressed. Consideration should be given to the data, processes and tools available to support the asset management approaches and processes, as well as resource availability and capability. It is common for an agency to begin at a simple level and mature over time towards more complex asset management that integrates processes and decision-making.
Utah DOT
To accomplish the objective of allocating transportation funding toward the most valuable assets and those with the highest risk to system operation, UDOT developed a tiered system of asset management. Asset Management tiers range from one to three with tier one being the most extensive management plan for the highest value assets.
Tier 1. Performance-based management
- Accurate and sophisticated data collection
- Targets and measures set and tracked
- Predictive modeling and risk analysis
- Dedicated funding
Tier 2. Condition-based management
- Accurate data collection
- Condition targets
- Risk assessment primarily based on asset failure
Tier 3. Reactive management
- Risk assessment primarily based on asset failure
- General condition analysis
- Repair or replace when damaged
Source: Utah DOT. 2018. Utah TAMP. https://www.tamptemplate.org/tamp/053_utahdot/
Prioritizing TAM Improvements
Deciding on the appropriate management approach and level of asset management is a strategic decision that should consider several factors:
Organizational Strategic Goals
The decision of which assets to prioritize should be driven by the organization’s strategic goals. A desire to focus on one aspect of the transportation system over another in order to meet a larger objective can present a good reason for prioritizing some assets over others.
Asset Value
A common consideration for selecting assets to include is the financial value. Monetizing value provides a consistent way of comparing asset classes. In general, assets that are the most expensive to replace or cause the greatest financial concern for an organization fall into the highest priority. Strategic management of these assets means strategic investments over the life cycle of the asset, which will prevent or delay the need for significant additional investment, help avoid premature failure, and allow time to plan for appropriate replacement.
Data Availability
TAM as a concept is heavily dependent on data. Deciding on which assets to focus on based on existing data collection and management practices and will often support achievement of “quick wins.” Data availability does not always indicate strategic priority or risk exposure of the asset, but can still be an important factor in selecting assets to include the cost of collecting and analyzing data to form the basis for more advanced TAM decision making can in some instances be significant, and require new skills and training.
It should be recognized that data does not need to be comprehensive and complete as a basis for TAM decision making. An accepted approach is to group assets into classes (age, type, function) and then inspect a sample set. This can provide important insights to guide long-term planning at minimal initial expense/time. It can also highlight any issues with particular types of assets and allow for more detailed inspections to be undertaken if required. A gap analysis to define future data requirements and determine how to collect this data should be considered for long term TAM outcomes.
Risk of Failure
Often, it can be necessary to consider including assets if the probability and consequence of failure is significant. Assets with a high risk of failure can be a high priority due to the potential losses to the agency and its stakeholders should they fail. Asset management can alleviate or prevent the impact of failure.
Asset Criticality and Network Reliability
Decisions to formally manage certain assets can be based on their importance to the service provided, such as operations, or the importance of the travel paths under consideration. Defining criticality is context specific, but is important, since user experience is based on the journey, not the specific assets. Considering criticality in selecting assets to include in TAM will ensure that the most important assets–those necessary to maintain network reliability–are managed first.
Stakeholder Influence
In general, the scope of TAM should be agreed to in coordination with leadership and influenced by stakeholders. Stakeholders can be any asset owners, metropolitan planning organizations (MPOs), cities, tolling authorities, P3 concessions, federal (mandated requirements), and others. The public can also be stakeholders who influence which assets to include, especially when high-profile incidents potentially attributed to the state of good repair occur.
Aurizon
Aurizon is Australia’s largest freight rail operator, transporting more than 500 million tons of coal to markets including Japan, China, South Korea, India, and Taiwan, in addition to over 800 million tons of freight through an extensive network throughout the country. Aurizon Network manages the largest heavy haul rail infrastructure network in the country. The network is economically regulated by the State through a process that sets investment levels and tariffs. Asset management practice is well-entrenched in the organization, with a focus on “optimizing the life of assets, keeping a tension between investment in maintenance and capital.” The scope of the Aurizon Network asset base, known as the Regulated Asset Base includes all assets used in the provision of the rail infrastructure service. Management is informed by external engineering standards and legislative and regulatory obligations including:
- Prevention and intervention levels specified in an Asset Maintenance and Renewals Policy.
- Commitments to the Central Queensland Coal Network.
- A Safety Management System aimed to minimize safety risks.
- Network Strategic Asset Plan models which are based on asset age, predicted condition and historical and forecasted usage.
Source: Aurizon. 2019. Network: Planning and Development.https://www.aurizon.com.au/what-we-deliver/network#planning---development
Developing a TAM Implementation Plan 2.3.3
A TAM implementation plan can clearly communicate an agency’s next steps for TAM and define responsibilities for implementation.
TAM Webinar #39 - TAMP Implementation
The product of a gap assessment will often take the form of an implementation plan for TAM improvements. These improvements can involve changing behaviors across many business units within an organization. The actions should, therefore, be prioritized and staged to advance one step at a time. When defining actions, it is important to understand the purpose and outcome to be achieved, who is responsible, how long it will take and how many resources are required for it to happen.
Note that a TAM Implementation Plan is different from a Transportation Asset Management Plan (TAMP) described further in Section 2.4. An implementation plan focuses on business process improvement, while a TAMP focuses on an organization’s assets and how it is investing in and managing them. However, the implementation plan may be included as a section of a larger TAMP.
The improvements identified need to recognize potential barriers to implementation. As an example, improving decision-making tools will likely require improvements in data practices. The implementation plan should consider any foreseeable obstacles, including staff resistance to new business procedures, lack of support from agency leadership, inadequate skills among staff, data integration issues or outdated analytical tools.
Communicating the Implementation Plan
Effective, organization-wide communication can serve as a powerful tool to facilitate smooth and swift adoption of the TAM implementation plan. At the start of implementation, communicating the future vision and benefits can help build awareness and buy-in. Throughout the duration of the implementation initiative, communication about milestones and accomplishments can help sustain or regain momentum. Additionally, as different projects are initiated, delivered and completed, agencies will want to ensure that the resulting changes in processes, systems and tools are adopted and used consistently to achieve the intended outcomes and objectives. As illustrated in Figure 2.9, the TAM communication strategy should cover six key elements – why, who, what, when, how and how well.
Objectives. Why communicate?
Establishing early buy-in to the implementation plan by providing an upfront explanation of why execution of the TAM implementation plan is needed—the anticipated benefits for the organization as well as for different stakeholder groups—will help jumpstart success of the implementation.
Stakeholders. Who delivers and receives the communication?
To make sure the right people are receiving the right information, it is key to develop and categorize a complete list of internal and external stakeholders who will be impacted by the TAM implementation plan and its resulting changes. In determining stakeholders, consider who needs to receive different types of information and who best to deliver that information to support achievement of implementation plan objectives.
Messages. What are the messages to communicate?
In developing the key messages to communicate, consider intent – what should stakeholders know, think or do as a result of the message? Key messages should promote awareness, desire and reinforcement of the implementation plan and its associated changes. They should also align with objectives of the implementation plan as well as organizational objectives.
Timing & Frequency. When will the communication occur?
Communication about the TAM implementation plan and corresponding changes should be timely, frequent enough to keep stakeholder groups well informed about approaching milestones and key dates of impact, and not so frequent that they lose value. Take into account what is being communicated and to whom, as different stakeholder groups receiving different types of messages often require different delivery frequency.
Tactics & Channels. How will information be communicated?
Depending on the duration of the TAM implementation plan and the number of associated changes, communication needs often shift over the course of its execution. Agencies should determine the most effective types of communication and delivery channels as they progress through change. By including stakeholder categories, messages and frequency as inputs when determining the most effective channels, the communications strategy remains agile, which facilitates continuous improvement.
Continuous Improvement. How well is the communications strategy working?
Assessing the effectiveness or performance of any strategy is important for achieving objectives. Including a stakeholder feedback loop into the communications strategy is one way to accomplish this. Agencies can use surveys, polls, focus groups or meetings to gather information and gauge opposition and support. This crucial feedback serves as guidance for subsequent content and can lead to changes in the communications strategy.
Figure 2.9 Communicating the Plan
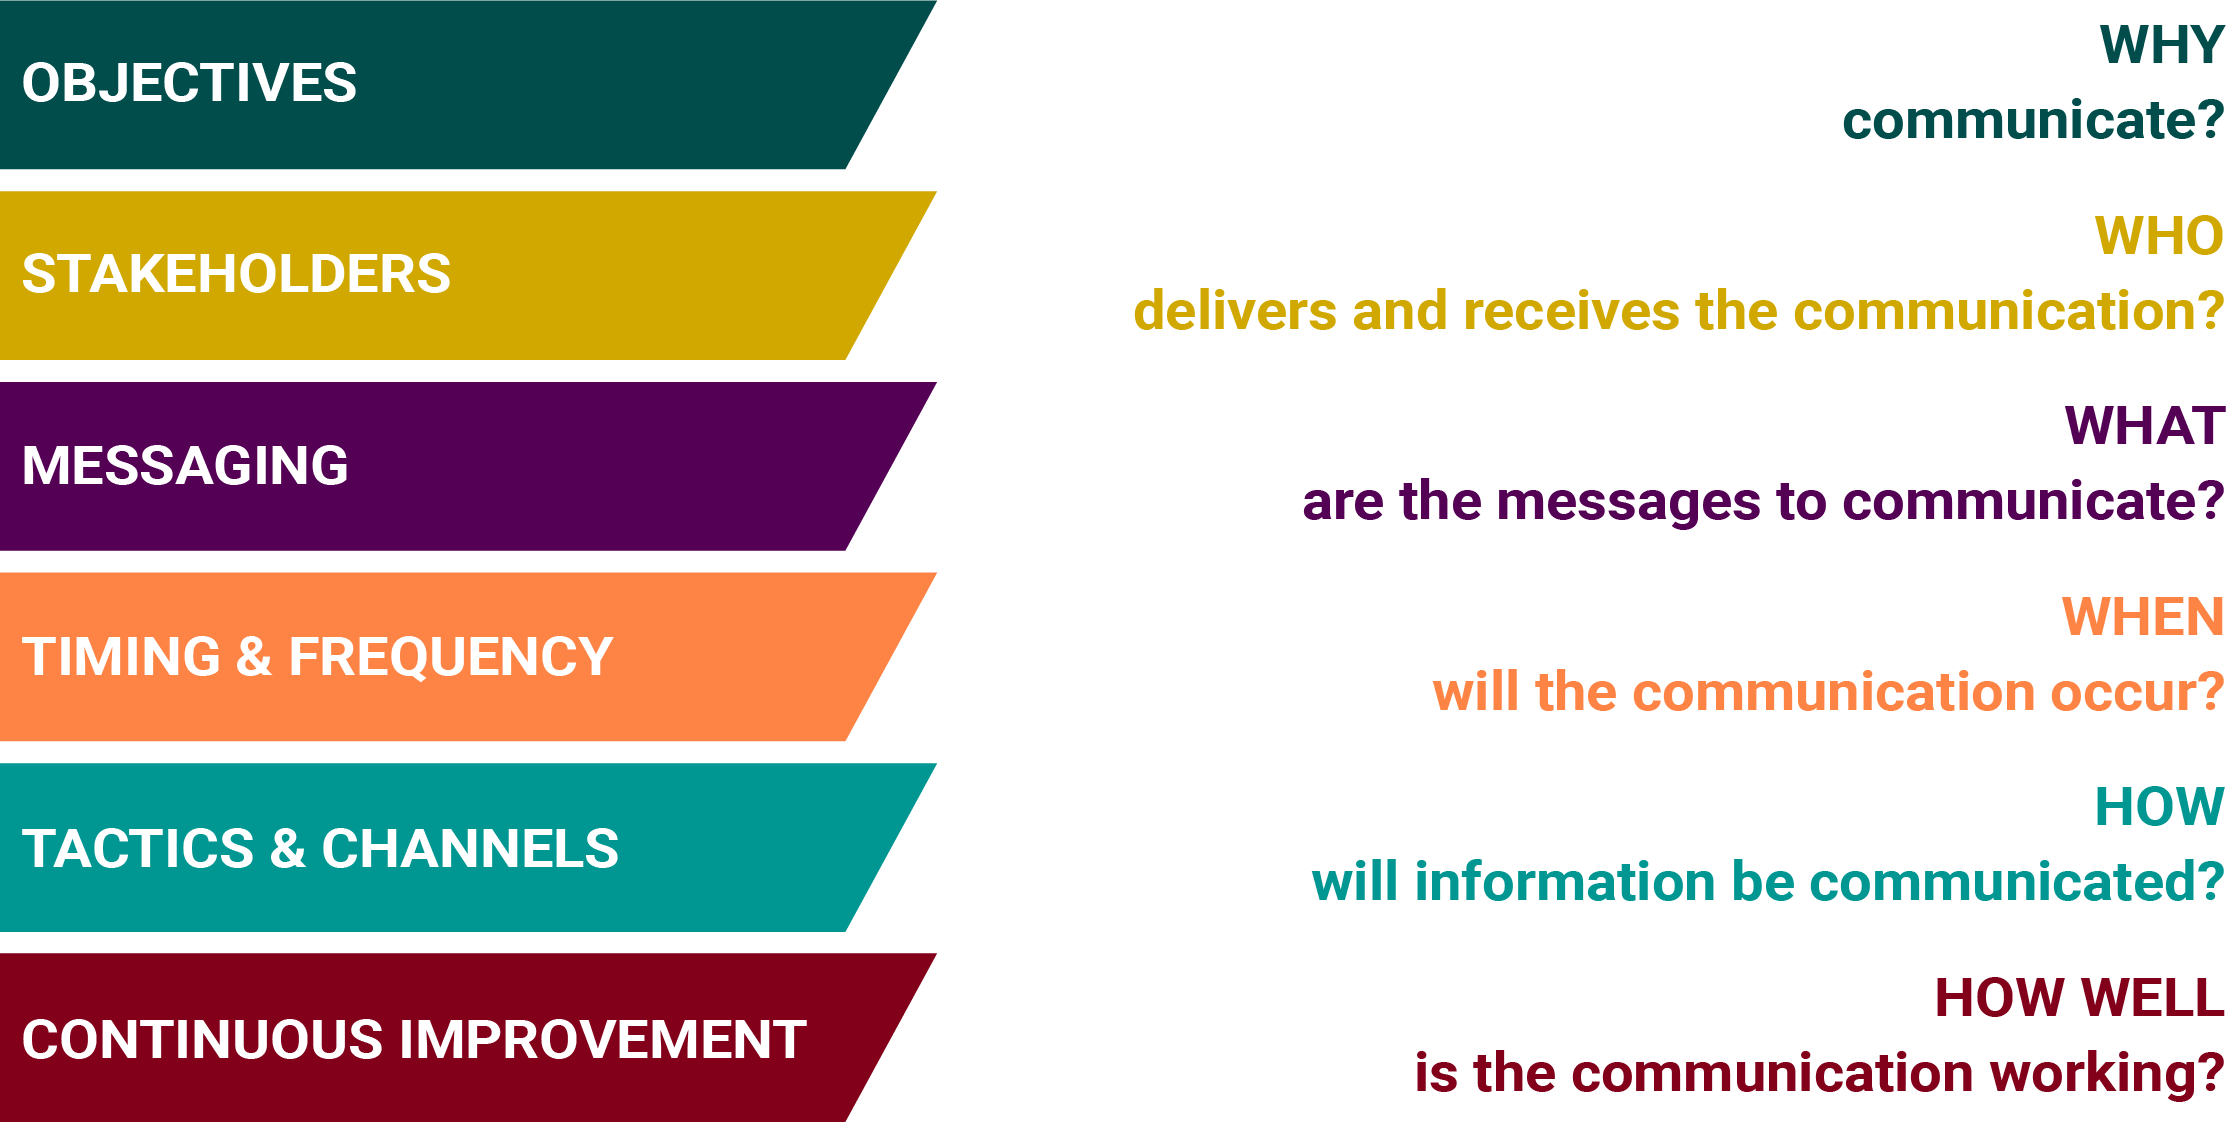
Key questions to answer in communicating your implementation plan.
Clackamas County DOT
Based on their gap assessment, Clackamas County Department of Transportation and Development established a Transportation Asset Management Strategic Plan (TAMSP), which documents its methods to implementing a comprehensive transportation asset management program over a five year period. This TAMSP was accompanied by an asset management implementation strategy that identified the key actions to be undertaken.
Clackamas County, 2051 Kaen Road #426 Oregon City, OR 97045
Extract from Clackamas County DOT Implementation Plan
Monitoring TAM Program Improvements 2.3.4
Measuring TAM improvement is important for understanding if the plan needs adjustment, and to communicate success and motivate those responsible for implementation.
Once a commitment to make improvements has been made, the improvement process needs to be managed and monitored.
Regular updates, meetings, performance tracking (monitoring improving performance against the selected framework) and scheduled reviews by the TAM Governance Groups will help provide oversight to those responsible for undertaking the improvements.
This process also helps remove roadblocks by involving leaders from across the organization.
When to Re-Assess Performance
A regular commitment to monitor progress is important. This assessment will compare progress from the initial benchmark toward the desired level of competency. There is no set recommendation for when to assess progress; some agencies find it more important in the early stages of implementation, while others do not.
When considering the timing of progress assessments, it is important to consider:
- Process checkpoints. The frequency could be aligned with reporting requirements, but should also consider appropriate points where progress will be noticeable.
- Commitment. Undertaking an assessment will take time and resources, so it is important this is balanced against progressing with implementation.
- Champions and change agents. As these individuals are critical to the overall success of TAM implementation, if they change or need to monitor their own performance, then a review of progress can help motivate and reset goals.
Measuring Performance Improvements
Monitoring performance of the asset management system and the results of improvement actions can be challenging, as the cost of service delivery, quality of service levels and risk of service failures may shift over time, and can change following the implementation of an improvement action. The IIMM suggests some of the following potential TAM system performance indicators:
- Financial performance
- Data management performance
- Timeliness relative to target response times
- Productivity and utilization of resources
- Skills availability relative to planned requirements
- Adherence to quality procedures
Chapter 6 provides more information on performance measures, targets, and monitoring asset performance. Self assessment can focus both on service / asset outcomes experienced by users, as well as be internally focused to determine how well the agency is aligned with desired practices. It is important that agencies consider and select the appropriate level and focus of self-assessment for their requirements.
TIP
TAM Maturity Assessments should end with an Improvement Program, highlighting areas for self-improvement, which can then be prioritized according to agency priorities or strategic direction.
New Zealand Transport Agency
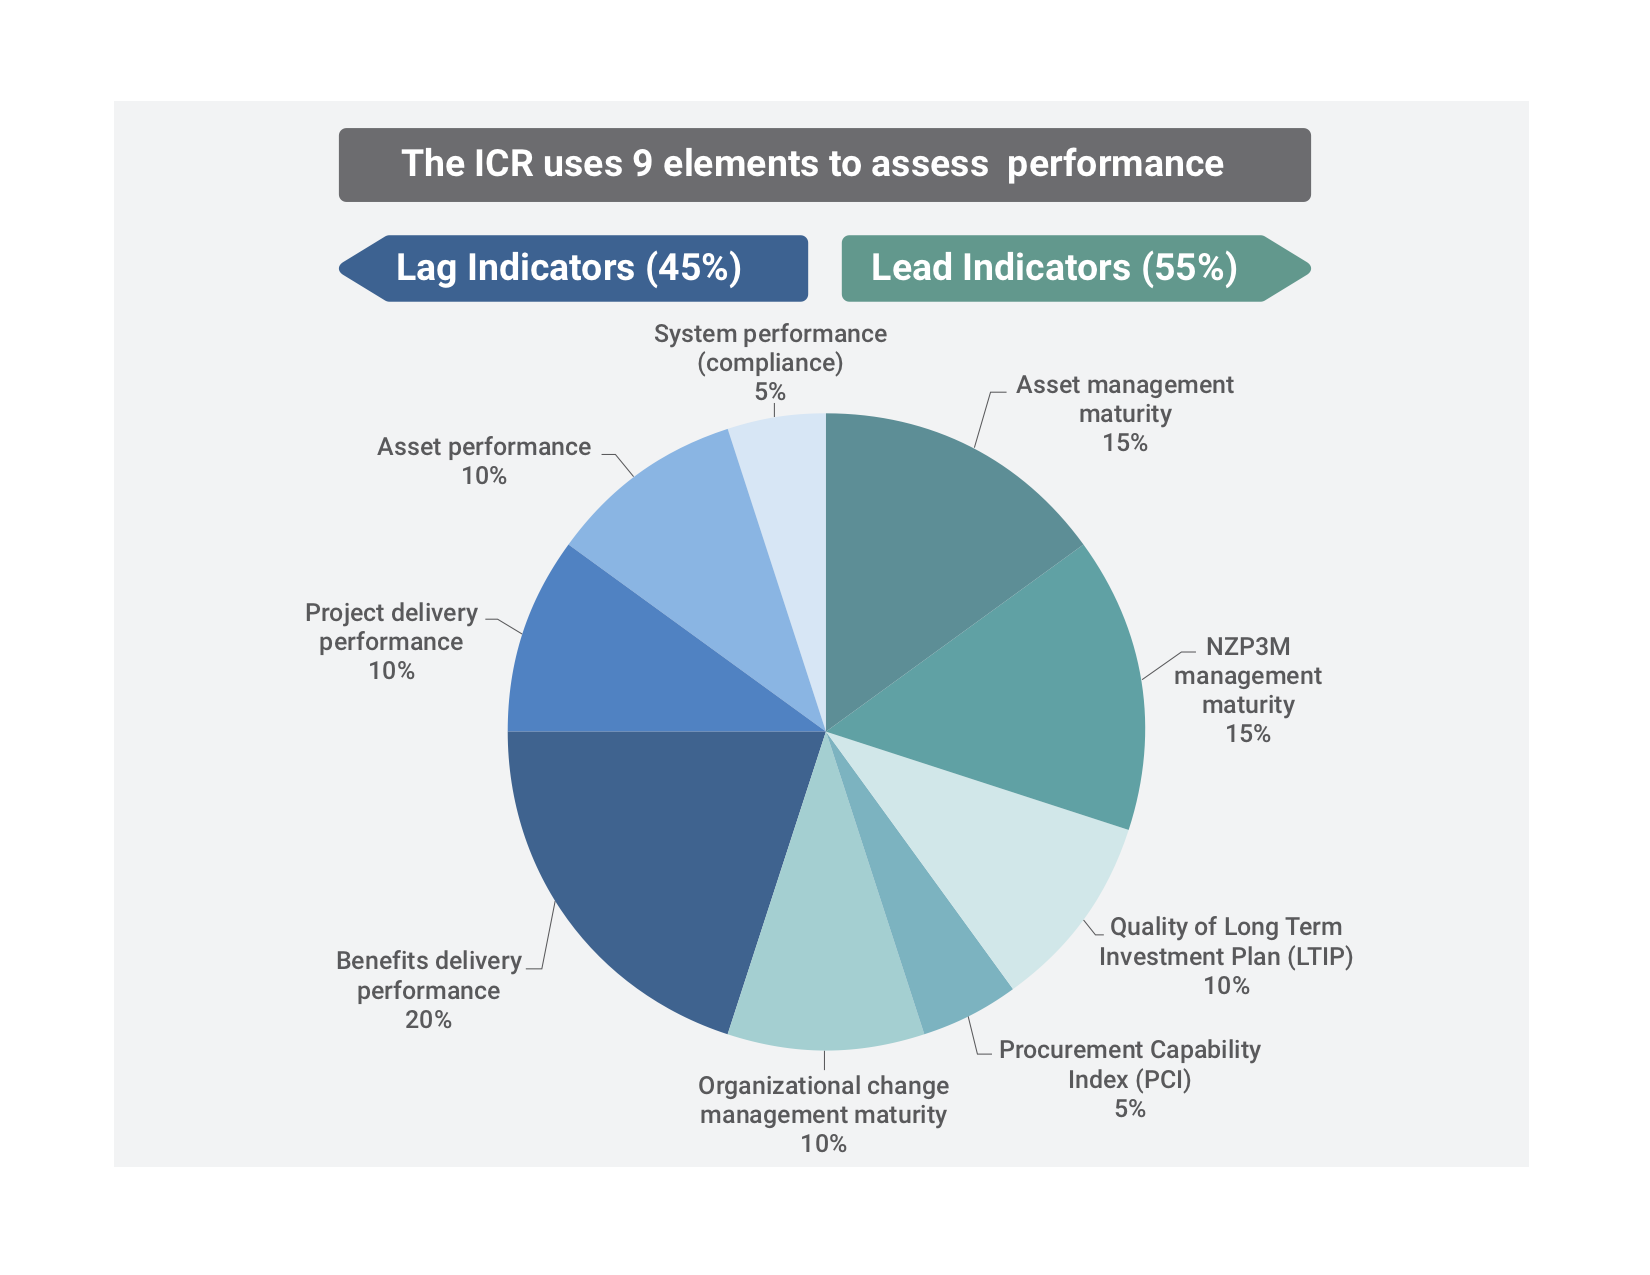
The New Zealand Treasury stewards the NZ government’s Investment Management System to optimize value from new and existing investments and assets for current and future generations of New Zealanders. One of the tools the system uses is the Investor Confidence Rating (ICR), which illustrates the confidence that government leadership (i.e. Ministers) can have in an agency’s ability to deliver investments that produce the desired results.
The ICR also promotes and provides a pathway for capability uplift. One element of the ICR evaluates the gap between current and target asset management maturity levels on the basis that good asset management practice provides the foundation for good investment management. The Treasury recommends periodic self-assessments using a methodology based on international asset management guidelines and the ISO 55001 standard.
The ICR assessment is conducted every 3 years, resulting in more decision-making autonomy for agencies that obtain a good rating and potential flexibility over investment assurance arrangement.
Adapted from New Zealand Treasury. Investor Confidence Rating (ICR).
https://treasury.govt.nz/information-and-services/state-sector-leadership/investment-management/review-investment-reviews/investor-confidence-rating-icr
Defining Asset Service and Performance Levels 4.1.2
Before asset performance can be managed, an agency must first define what it is seeking to achieve. In TAM, asset performance is most commonly defined in terms of asset condition or maintenance level of service. Performance may also be evaluated in terms of safety, availability, reliability, resiliency and other service attributes. Regardless of the method used to monitor performance, it should be used to inform analysis that supports decisions to help ensure that investments enable an agency to achieve its goals cost-effectively.
Establishing Desired Levels of Service
Before a whole-life strategy can be developed and implemented, an agency must determine what they seek to achieve. In many transportation agencies, the desired level of service (or asset management organizational objectives, in ISO 55000 terminology) provides the linkage between what the goals of an agency are, and what investments and interventions should take priority when managing assets. High level goals should directly influence investment choices when resource allocation decisions are made. Service levels help establish when gaps need closing to achieve a goal, and merits investment. Chapter 2 discusses ways to create linkages between goals and investment decision making.
When managing the life cycle of existing assets, performance targets are commonly established as a way to manage service levels for the transportation network. How to determine the expected level of performance may vary depending on the type of asset being managed. Level of service targets that are part of performance framework typically are a mixture of both customer focused performance measures, and technical service measures that help those responsible for the asset assess what types of interventions might be required and when. Customer focused service measures are important to road users and other stakeholders that require mobility. Travel time reliability, safety, load capacity and clearances, and lane availability are all examples of service targets that are customer focused. Condition, strength, regulatory compliance and examples of technical service attributes are commonly of greater interest to asset stewards than asset users. Both types are service level targets that are important to evaluate the efficacy, effectiveness and efficiency of a transportation system.
TIP
“The organizational objectives provide the overarching context and direction to the organization’s activities, including its asset management activities. The organizational objectives are generally produced from the organization’s strategic level planning activities and are documented in an organizational plan.” (ISO 55000, 2.5.3.4) These organizational objectives are analogous to strategic objectives typically found in long range transportation plans.
For pavements and bridges, and other assets managed using a condition-based approach, asset condition is commonly used to establish expected technical levels of performance, but also is relevant to customers. For example, condition is employed as a proxy in this way for pavements because it is objectively measurable, deterioration has some predictability. It is a valuable service attribute because often, user experience is also directly connected to condition as well. Potholes, rutting and roughness all reduce quality of service from a pavement. Performance measures, such as those discussed in Chapter 6, are used to establish the desired long-term performance and to set short-term targets that can be used to track progress towards the long-term objectives. For other highway assets, including those managed using interval- or time-based maintenance approaches, performance may be linked to the expected service life, the ability of the asset to fulfill its intended function, and/or other operational factors. For these other highway assets, performance targets are often established as part of a Maintenance Quality Assurance (MQA) program in terms of desired maintenance levels of service (MLOS) and integrated with operational service targets that may also be customer focused.
Risk can also be used as a measure of performance. As described in chapter 2, risk considers both the potential impact and consequence of failure. This can be particularly useful when the potential consequences of failure impact other assets or facilities. An example of how Colorado uses risk to manage rockfalls is included in section 4.3 of this chapter. Additional details on how to track risk-based performance measures is included in Chapter 6.
Establishing a desired level of performance is typically a collaborative process that considers existing conditions, available funding, expected demands on the system, policy goals and guidance, and stakeholder priorities. The desired level of performance is typically established once baseline data is available, so performance trends can be evaluated. The desired level of performance may be adjusted over time to reflect changes in agency performance, changes in asset condition, capacity, safety, resiliency and other factors.
Three types of service expectations are often used in combination to manage asset performance:
- Performance target – the level of performance beyond which additional performance gains are not desired or worth the additional cost. When performance is measured based on condition, the desired performance may describe the desired state of good repair. There may be an expected specific time frame to achieve this desires performance target.
- Current Performance – an intermediate level of performance achieved by the organization and is usually reported relative to the desired target. Target setting is described in more detail in Chapter 5.
- Minimum acceptable performance – the lowest level of performance allowed for the asset or asset class to still function as designed.
Performance expectations may be set for the road network, a road corridor, for individual assets or for a group of assets. Commonly, performance expectations are set using a combination of asset class or subclass or sub network, such as:
- Key network corridors.
- Bridges on the National Highway System.
- Interstate pavements.
- Culverts larger than 10 feet in diameter.
- Traffic signals serving more than 10,000 vehicles per day.
TIP
A desired state of good repair is often established as the level of performance beyond which further performance gains are not necessary or desirable, usually represented as a condition state for a set of assets.
The nature of performance expectations can be either strategic or tactical or operational. Strategic expectations support freight movement; for example, the long-term goal of providing unrestricted flow of legal loads is supported by a performance expectation of no load-posted or restricted bridges on interstate highways. This expectation cannot be accomplished without the tactical delivery of work to address factors contributing to the physical condition of bridges. Thus, an agency may include tactical expectations to perform maintenance and repair on structural members on a routine basis or as conditions warrant. These enhancements can be also integrated with renewal and other rehabilitation interventions to help improve both tactical performance metrics, as well as achieve higher level goals and objectives. Operational improvements such as more responsive snow clearance, and better signage are all integrated treatment options to achieve the strategic objective.
Life cycle management analysis, and the decisions it supports, require service levels, performance targets and other objectives to be able to determine the optimal choices for agencies to select during resource allocation. Over an asset life cycle, a range of interventions are possible, from reactive, routine and preventative maintenance, to large investment associated with renewal, replacement, or removal. Having targets helps select the right interventions and investment option while balancing risk, service and cost.
Connecting performance measures to higher level strategic goals also supports an agency’s ability to communicate how technical measures relate to system performance as experienced by highway users and other external stakeholders, thus tying asset management outcomes to system performance. Asset management measures are often very technical. Performance indicators like bridge ratings, pavement distress measurements, and risk ratings are not commonly understood by those outside transportation agencies. However, agencies can use these technical measures to support the performance indicators that are more commonly understood and prioritized by system users and external stakeholders. Communicating system performance and the status of the road network is discussed in Chapter 2, and is illustrated in several examples below. Customer service level targets are often established for this purpose, and give users an ability to understand the quality of service they should expect on the transportation system.
Colorado DOT
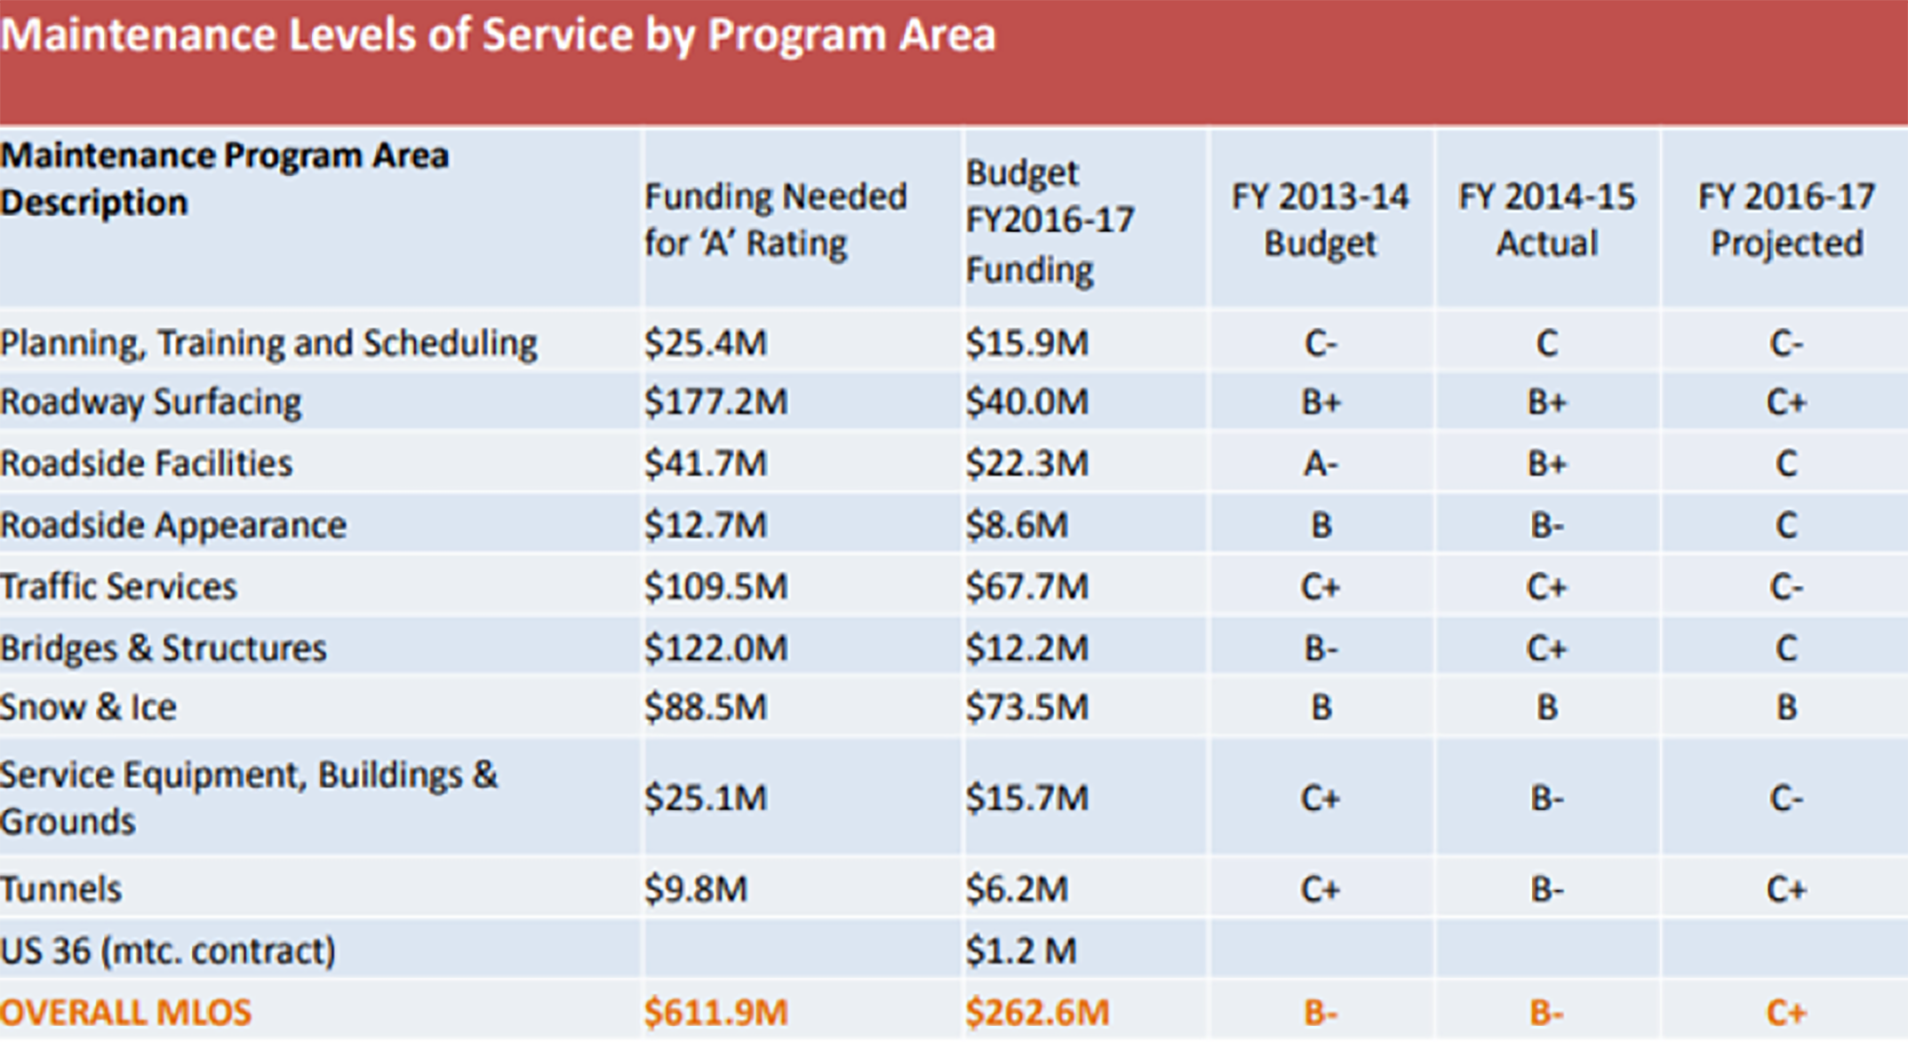
Each year, the Colorado DOT must report to its legislature on the statewide highway infrastructure and the agency’s ability to meet those needs with available resources. This requirement is met through the Annual Infrastructure Deficit Report, which addresses pavements, bridges, and annual maintenance. The agency supports the annual maintenance portion of this report with its Maintenance Level of Service Measure, which rates the delivery of services in nine program areas in terms of a letter grade from A to D and F. The agency has used historic data to develop deterioration rates for each service area that estimate the resources needed to improve the maintenance level of service by a given amount over a specific time period. These estimates are summarized in the Report, which is in turn used by the Legislature and the DOT to establish the annual maintenance budget. The figure provides an example of information on MLOS in the 2016 Report. Once the targeted MLOS is established, maintenance funding can be allocated to ensure that agency priorities are met.
Colorado DOT Example of Funding Needed to Support Maintenance Levels of Service
Source: Colorado DOT. 2016. https://leg.colorado.gov/sites/default/files/cdot_smart_2017_presentation.1.pdf
Washington State DOT
When seeking to establish the connection between investments and performance across a wide range of assets or roadway attributes such as litter, vegetation height, drainage, or functionality it is helpful to relate all of the various measures of performance to a common rating scale. Washington State DOT has developed its Maintenance Accountability Process to establish the relationship between maintenance level of effort and the resulting level of service. The process rates conditions and services in seven areas using a common letter-grade system, or MLOS.
- Roadway Maintenance & Operations.
- Drainage Maintenance & Slope Repair.
- Roadside and Vegetation Management.
- Bridge & Urban Tunnel Maintenance and Operations.
- Snow & Ice Control Operations.
- Traffic Control Maintenance & Operations.
- Rest Area Operations.
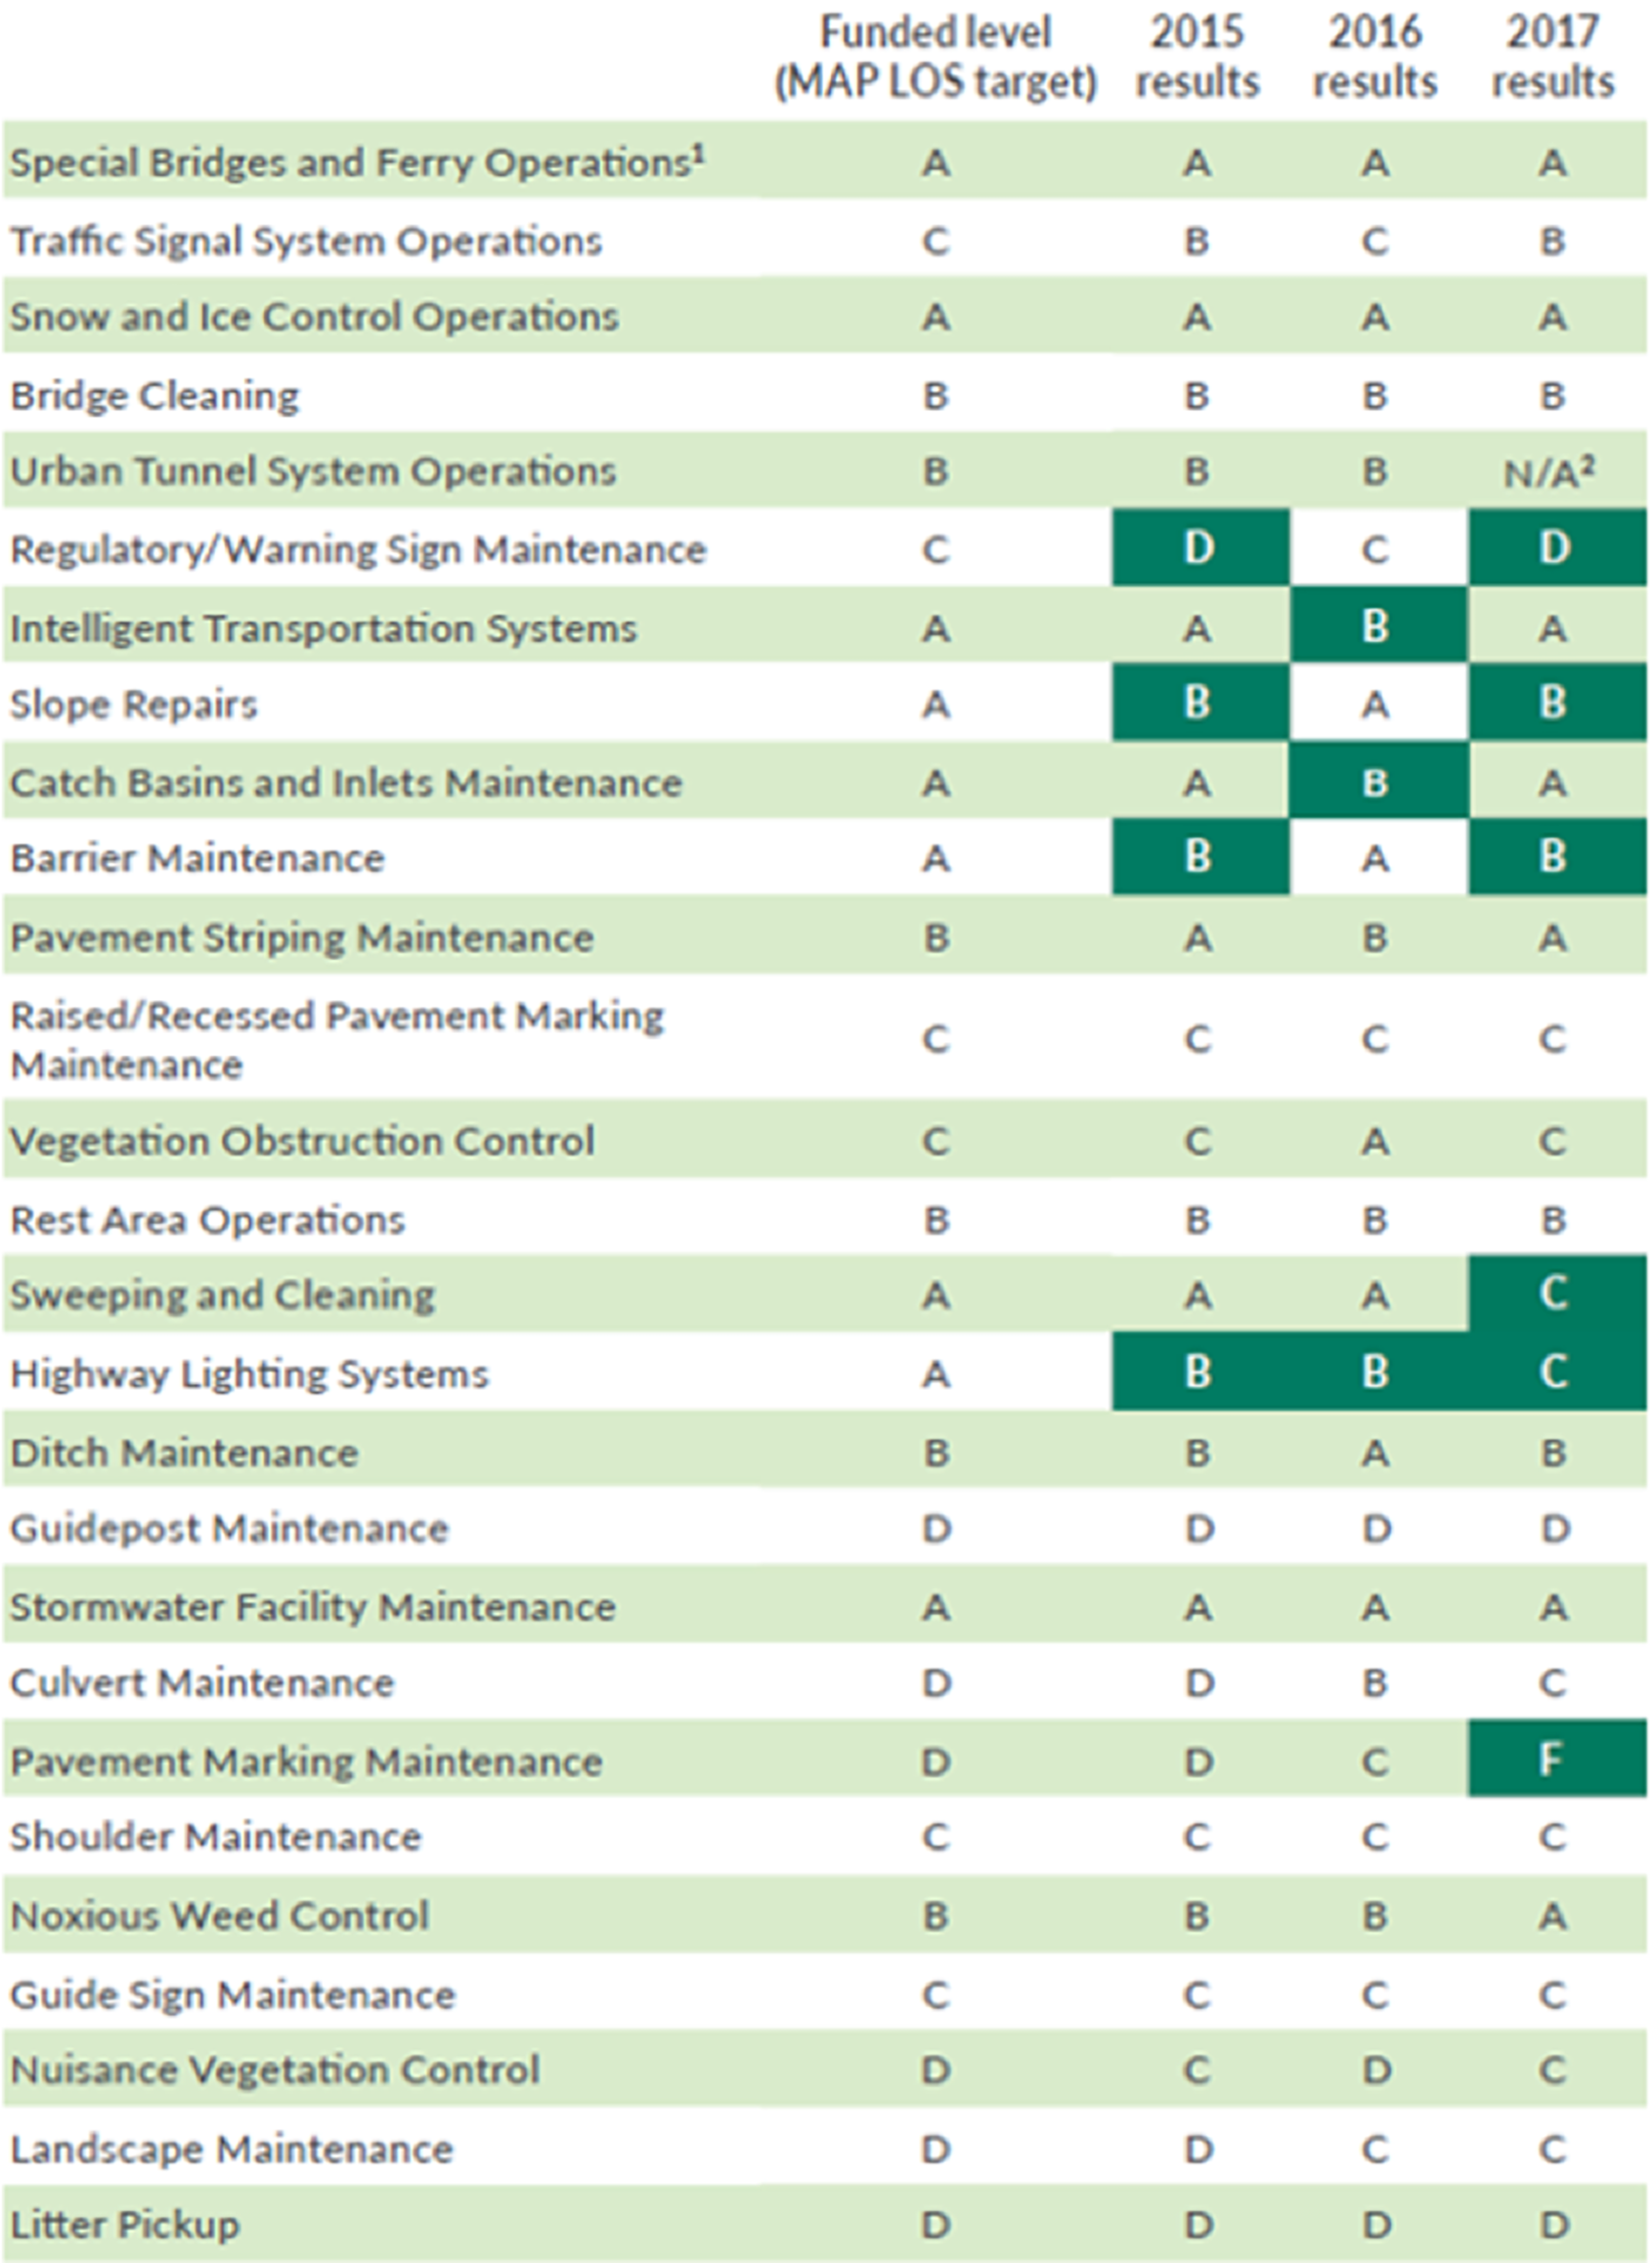
Each group of services or conditions includes several performance measures, which are translated to the MLOS grades of “A” (highest performance), “B”, “C” (adequate performance), “D” or “F” (unacceptable performance). Applying the MLOS grades allows for a consistent means of rating performance across services and geographic regions. Letter grades can also be represented in photographs of facilities that meet the criteria for each condition state to support communications with stakeholder groups. The MLOS are outcome-based measures that allow the agency to predict the expected level of service that can be achieved based on anticipated budget and work planning decisions. By tracking maintenance expenditures and MLOS results annually, Washington State DOT is able to adjust its maintenance priorities and budgets to address system needs and stakeholder wants.
Source: https://www.wsdot.wa.gov/Maintenance/Accountability/
New Zealand Transport Agency
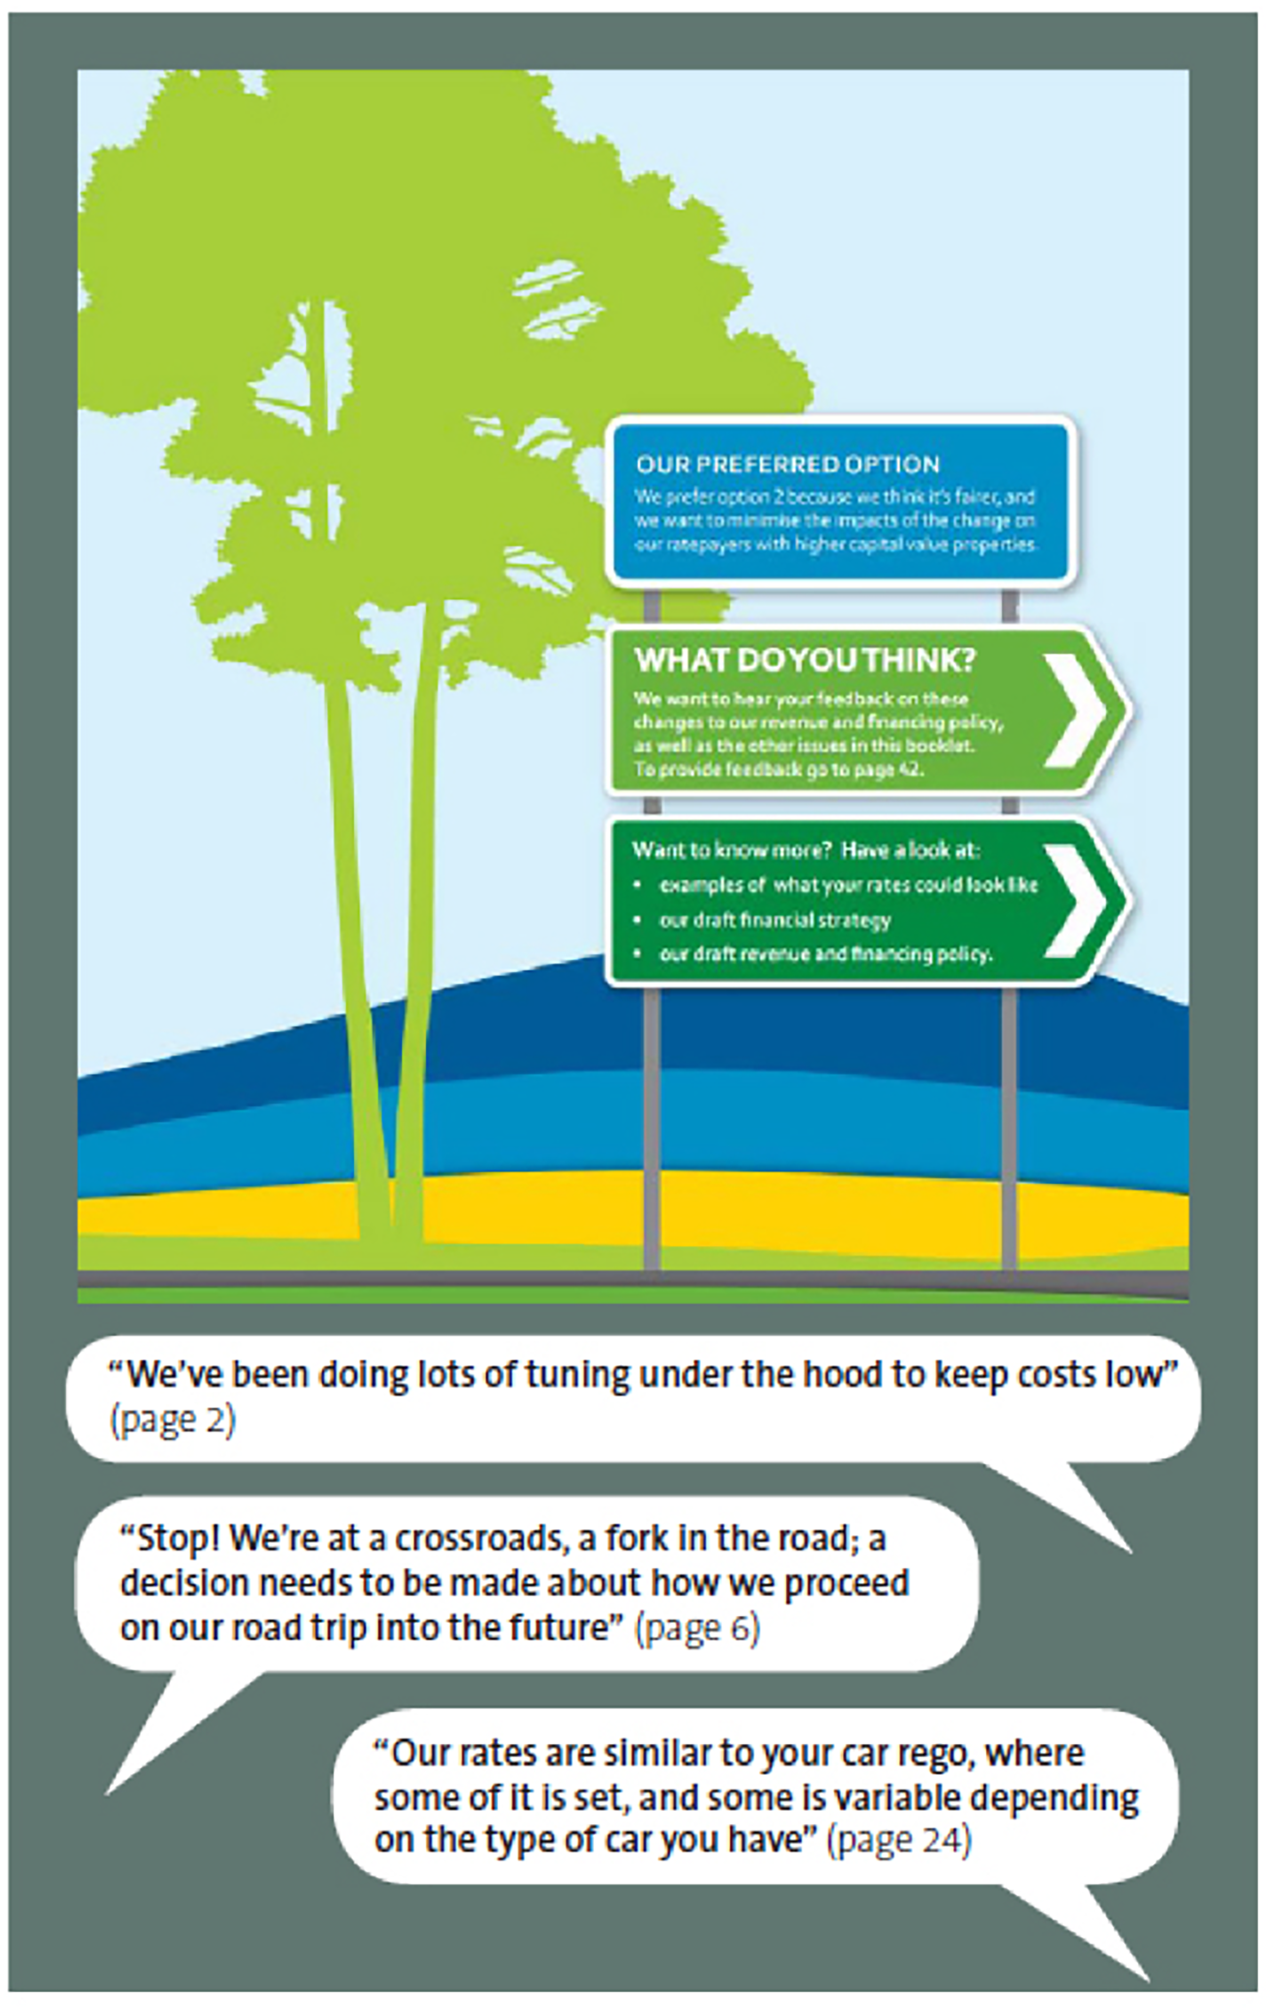
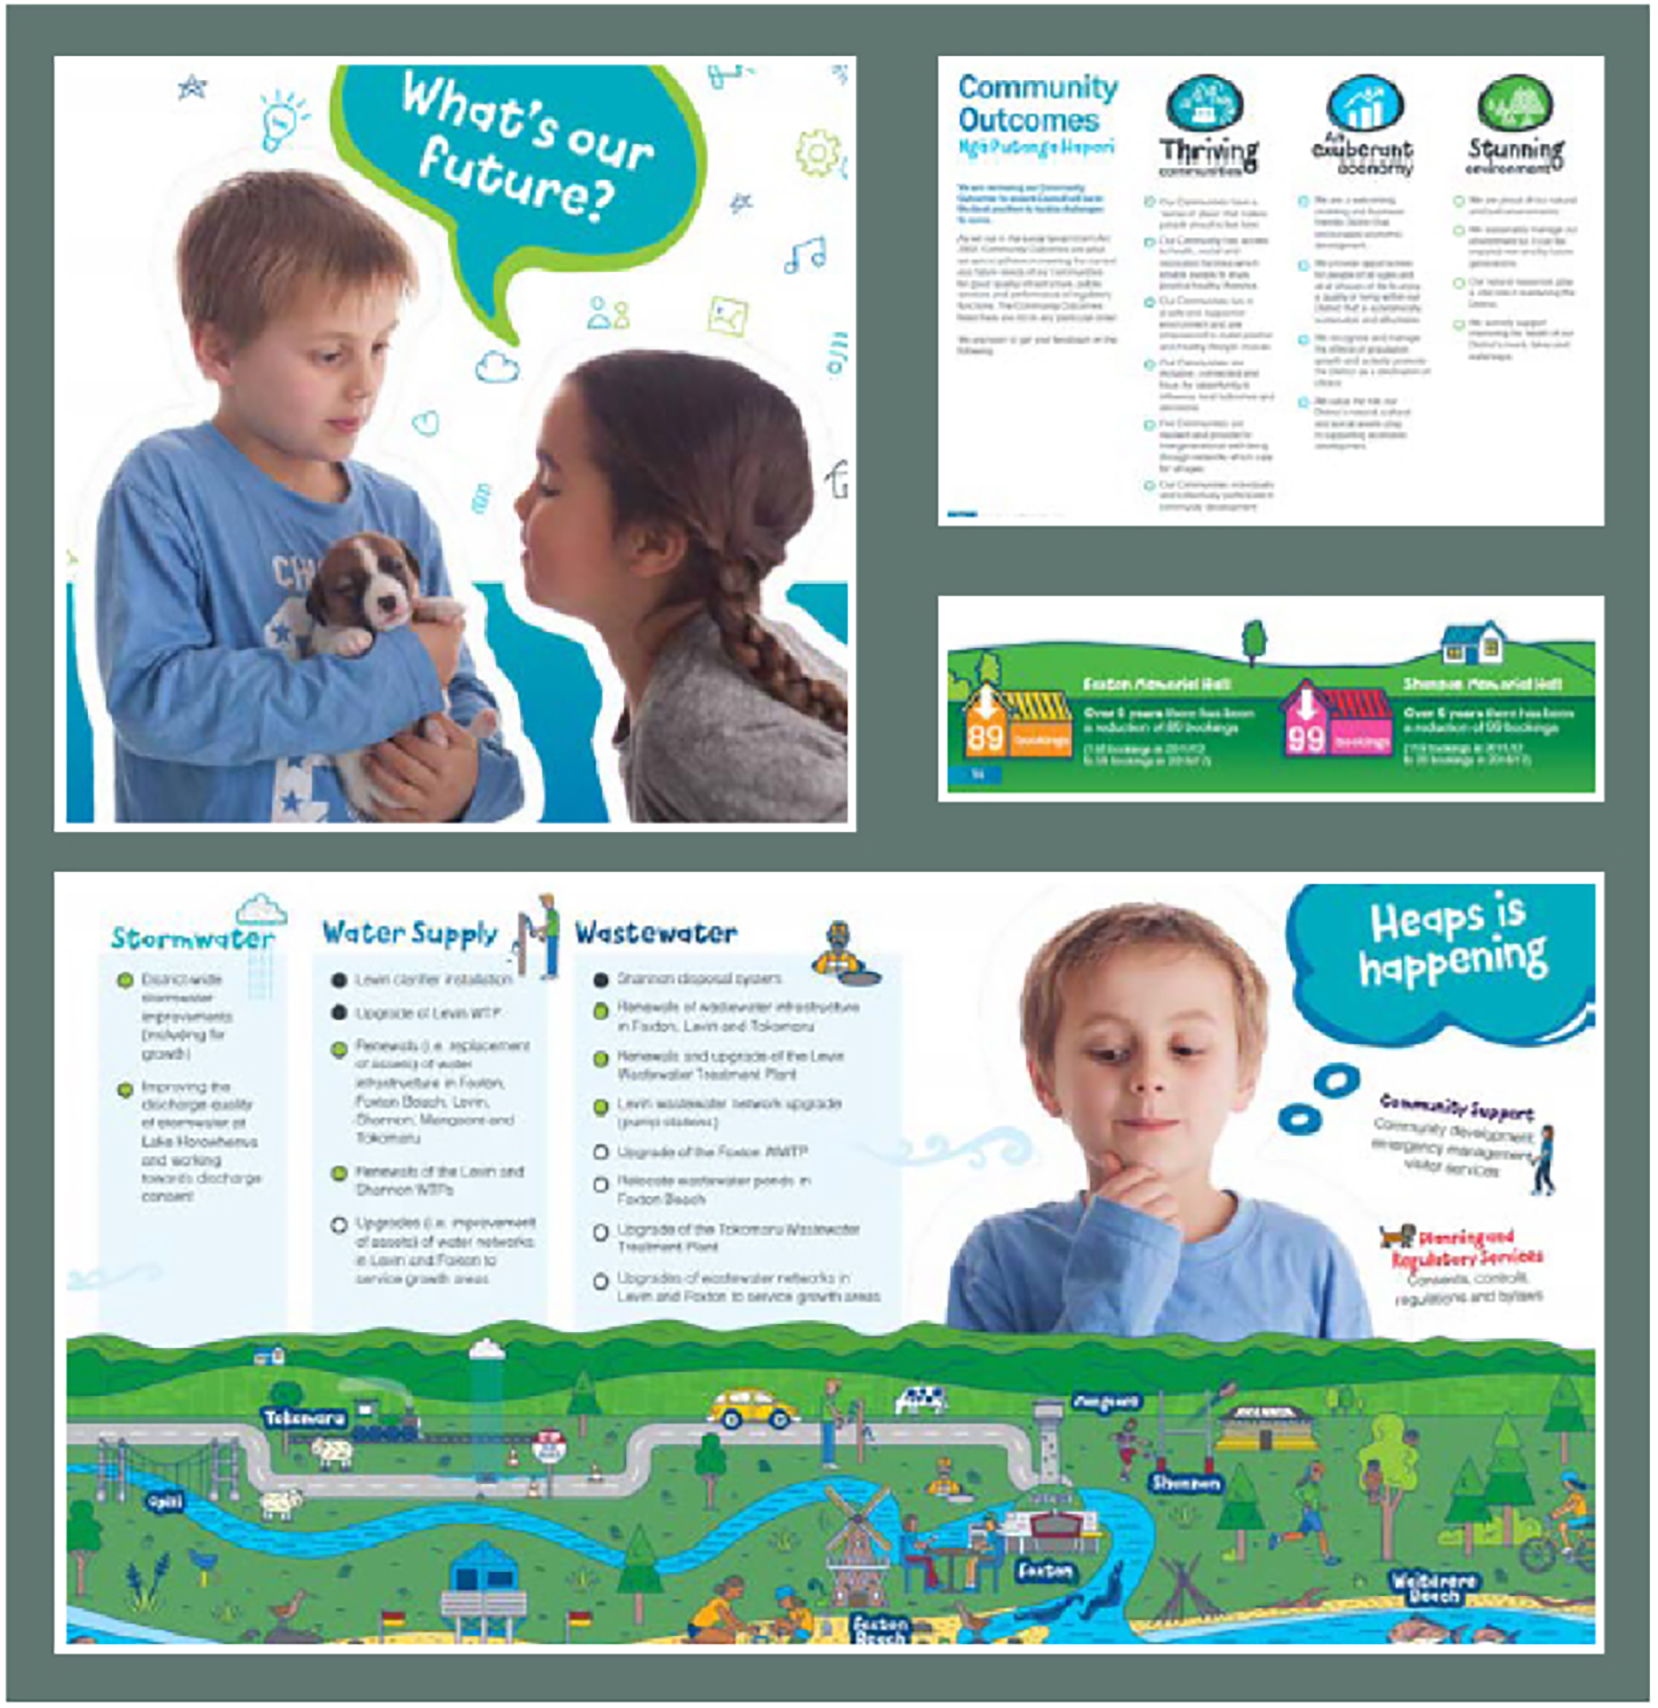
New Zealand Local Government Act legally requires councils to consult with their communities on their long-term plans. The consultation plan provides an effective basis for public participation in infrastructure decision-making associated with the long-term plan. It includes a fair representation of overall objectives, and how tax levels, debt, and levels of service might be affected by the intended plan and can be readily understood by interested or affected people. The Auditor General recently reviewed plans produced by communities across the country. Key findings highlighted aspects that help define good practice:
- Consultation documents present their information in a concise, readable and understandable way.
- Clear and unambiguous explanations on why proposed taxation and debt increases and significant changes in plans or intentions were considered “affordable” or “equitable” make consultation documents more effective.
- Some communities used a road-trip analogy throughout the document. The analogy makes technical subjects relatable without over-simplifying the issues.
- Some used a personalized approach that connected with people. For example, one uses two primary school children, Maia and Xander, who are pitched as the “champions of the Long Term Plan 2018-2038.”
By focusing on the inclusion of transportation customers, New Zealand municipalities are better able to address customer needs, inform customers of the actions they are taking, and refine work planning practices to address concerns critical to infrastructure operations and customer expectations.
Selecting and Using Performance Measures 6.1.1
This subsection discusses the importance of using performance data to make decisions. It highlights the role of performance measures and provides suggestions on selecting effective measures to meet agency needs. This section also introduces innovative new performance measures that agencies may consider in the future. A more detailed discussion of Transportation Performance Management can be found in Chapter 2.
Performance Management Framework
As discussed in Chapter 2, transportation agencies have embraced the use of performance data to drive investment decisions. A performance-based management approach enables agencies to select and deliver the most effective set of projects for achieving strategic objectives, while also improving internal and external transparency and accountability.
A typical performance management framework includes:
- A clear idea of the agency’s strategic objectives.
- The use of performance measures to assess performance.
- Methods to evaluate and monitor performance results.
- The evaluation of factors with capacity to improve long-term performance.
- The allocation of funding to achieve agency objectives.
- Ongoing processes to monitor and report progress.
A fundamental component of the framework is the use of performance measures to evaluate system performance and the importance of establishing business processes to evaluate, monitor, and use the data to influence agency decisions. These are achieved by aligning decisions at all levels of the organization with the agency’s strategic objectives and ensuring that the right performance measures are being used to drive decisions. This alignment helps to ensure that resource allocation decisions and the day-to-day activities of agency personnel support the agency’s priorities and the interests of external stakeholders.
The existence of a regular, ongoing processes to monitor and report results is critical to identifying and implementing improvements to system performance or to further the effectiveness of the performance management process. The continual monitoring and update of a performance management framework is reflected in Figure 6.1, which illustrates inputs to performance targets and how ongoing monitoring and adjustments are fed back into the framework to adjust future targets. The surveys conducted regularly to support a pavement, bridge or maintenance management system are examples of the types of performance monitoring activities fundamental to an effective performance management organization.
TPM Webinar #16 - Caltran's Performance Management Framework
Agencies with a performance management framework in place have benefited from:
- Maintaining a clear and unified focus for making agency decisions based on agency priorities, public input and available resources.
- Using available funding more effectively to preserve or improve system performance while lowering life cycle costs.
- Allocating available resources based on analysis of past performance and expected conditions to address areas most in need of attention.
- Having the data to confidently defend funding requests or explain the impact of reduced budgets.
- Building a transparent and accountable organization by communicating the basis for making resource decisions.
- Meeting legislative requirements.
Figure 6.1 Monitoring and Adjustment in the TPM Process

TIP
It is important to select performance measures that are meaningful to the agency and that can directly inform decisions. This may vary depending on the agency context, culture, and TAM maturity.
Arizona DOT
In 2001, during the development of a long-range transportation plan (LRTP), the Arizona DOT took a strategic approach to how investments should be made. Under the new approach, Arizona DOT established the following three investment categories:
- Preservation, including activities that preserve existing transportation infrastructure.
- Modernization, including improvements that upgrade the efficiency, functionality, and safety without adding capacity.
- Expansion, including improvements that add transportation capacity by adding new facilities or services.
To implement the new initiative, the Arizona DOT developed a report titled “Linking the Long-Range Transportation Plan and Construction Program” or "P2P Link” that applied financial constraints to the long-term vision. Through a collaborative process that involved a consultant, local and regional governments, and transit agencies, the Arizona DOT published an implementation plan for putting the P2P Link into practice. The resulting process includes scoring projects based on both a technical and policy score that are added together to determine a project’s ranking. The technical score is generated by the asset owner based on an analysis of the data while the policy score is determined based on each project’s contribution to LRTP goals and performance measures. The process helps to ensure that projects are ranked in accordance with the agency’s strategic objectives using only the most meaningful criteria in a transparent and defensible way.
Arizona DOT’s Link Between Strategic Objectives and Investment Decisions

Source: ADOT. 2014. Linking the Long-Range Plan and Construction Program P2P Link Methodologies & Implementation Plan.
https://azdot.gov/sites/default/files/2019/08/p2p-methodologies-implementation.pdf
Performance Measures
Performance measures are used within a performance management framework to allocate resources and provide feedback on the effectiveness of the activities in achieving overall objectives. Performance measures are indicators used for evaluating strategies and tracking progress. A performance measure can be an indication of asset condition, such as a pavement condition rating, or an indication of an operational characteristic, such as the annual number of fatalities on a facility.
The most effective performance measures drive decisions that are important to the success of the program. For example, maintenance departments may use performance measures that track actual expenditures to planned expenditures to ensure that available funding is directed towards the highest-priority items, as shown in the North Carolina DOT practice example.
It is also important that the measures drive the desired performance within an organization. For instance, a performance requirement that measures whether pavement or bridge designs are submitted on time might cause incomplete or incorrect submittals to meet a deadline, leading to an increase in construction modifications. A more effective measure might focus on a minimal number of design modifications during the construction phase of a project.
Effective performance measures should also primarily be outcome-based rather than output-based, meaning that they focus on the result or impact of an activity rather than the inputs that went into the activity. Outcome-based measures are generally preferred because they indicate the effect on the traveling public resulting from the actions taken, so they usually relate to user priorities such as the length of time for a road to be cleared after a snow event or the absence of litter and graffiti. They are developed based on a description of what an agency wants to achieve as a result of the actions undertaken. Outcome-based measures are commonly used for managing ancillary assets such as drainage assets and signs. For instance, the performance of drainage assets might be reported in terms of the percent of pipes/culverts greater than 50 percent filled or otherwise deficient and the performance of signs might be reported in terms of the percent of signs viewable at night.
Output-based measures, on the other hand, track the resources used to achieve the outcome, such as the number of hours of labor used or the number of light-bulbs changed in a month. While the data is important information for managing resources, it does not necessarily drive outcomes that would matter to the public. For instance, travelers on a highway are much more interested in knowing when the road will be cleared of snow than how much overtime went into the operation.
When possible, agencies should use performance measures that are leading measures rather than lagging measures to influence future decisions. A leading measure uses changes in performance to provide insights into potential changes that might influence a future decision one way or another. For example, knowledge that a ramp meter has exceeded the manufacturer’s suggested service life might drive a decision to replace that meter. Similarly, increases in equipment downtime might indicate risks due to an aging fleet are growing or that planned operational activities will not be performed as planned. A lagging measure, on the other hand, looks back on the results of past investment strategies after the decisions have been made. Because a lagging measure is recorded after the fact, there is a delay (lag) in the agency’s ability to adjust its practices and improve performance. Bridge and pavement condition measures are examples of lagging measures because the reported conditions reflect the impact of decisions made several years in the past. Lagging measures are commonly used to evaluate a program’s effectiveness or to verify that actual investments achieved projected results.
In transportation, an agency might have a lagging measure for tracking complaints responded to within a 48-hour window. The measure provides an indication of the public’s satisfaction with the road network and is easy to monitor and report. However, if an agency really wants to effect change, it might develop leading measures to track the percent of complaints not worked on within a two-hour window or the percent of complaints that can’t be resolved by the initial point of contact and must be passed to someone else. Focusing on these types of measures could drive agency decisions to ensure complaints are being worked on quickly and are being assigned to the right people. General characteristics of effective performance measures are presented in Table 6.1.
TIP
Outcome-based measures better relate to performance characteristics noticed by the public and other stakeholders than output-based measures.
Ancillary Asset Management
Table 6.1 - Desired Performance Measure Characteristics
| Desired Characteristics | Rationale/Purpose |
|---|---|
| Measurable with available tools/data | May require no additional cost for data collection |
| Forecastable | Enables data-driven target setting based on future conditions |
| Clear to the public and lawmakers | Allows performance story-telling to customers and policymakers |
| Agency has influence over result | Measures agency activities rather than impact of external factors |
North Carolina DOT
The North Carolina DOT authorizes its divisions to determine how funding will be used for maintenance activities and uses performance data to assist with this activity. Each year, Division Engineers submit annual plans detailing what work will be accomplished; these plans are reviewed quarterly with the Chief Engineer to discuss actual versus planned work. Their accomplishments are also displayed in a dashboard for internal use, as shown in the following image. Public-facing dashboards are also available showing overall conditions and performance trends. The Division Engineers are also held accountable for their performance, since their planned and actual performance data are incorporated into their annual evaluations.
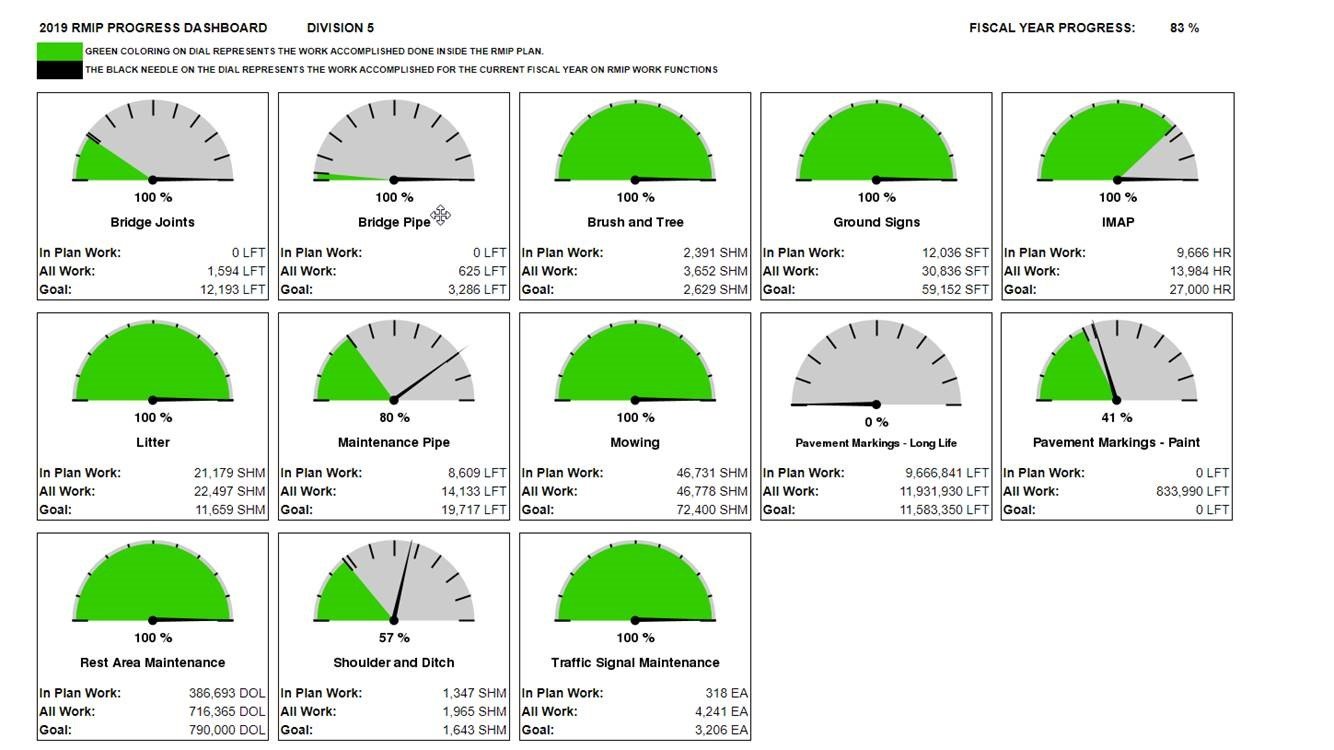
Source: Leading Management Practices in Determining Funding Levels for Maintenance and Preservation. Scan Team Report, NCHRP Project 20-68A, Scan 14-01, National Cooperative Highway Research Program, May 2016.
Use of Performance Measures
Performance measures are used to:
- Connect agency policies and objectives to investment decisions.
- Establish desired and targeted levels of service that consider past performance, current and future demand, stakeholder priorities, and anticipated funding.
- Align agency policies, investments, and day-to-day practices in a meaningful and easily understood manner.
- Prioritize investment needs.
- Monitor and report progress towards desired objectives to both internal and external stakeholders in a consistent, cost-effective, and transparent manner as illustrated in practice examples from the Washington State, North Carolina, and Virginia DOTs.
Washington DOT
The Washington DOT uses its Maintenance Accountability Process (MAP) to comprehensively manage maintenance budgets and to communicate the impacts of policy and budget to both internal and external stakeholders. Field condition surveys are conducted annually to assess the condition of 14 assets on the highway system such as signs and signals, ITS assets, tunnels, and highway lighting. For each asset, a level of service target is established, based on expected funding levels and importance of the asset to the agency’s strategic objectives. The targeted and actual performance is summarized on a statewide basis and presented to the legislature, media, internal stakeholders, and other DOTs in a format similar to what is shown in the figure (https://www.wsdot.wa.gov/NR/rdonlyres/8EC689DF-9894-43A8-AA0F-92F49AC374F5/0/MAPservicelevelreport.pdf). In 2018, Washington State DOT achieved 77 percent of its highway maintenance targets. Targets that were not achieved are shown as red bullseyes and areas where the targets were exceeded include a checkmark with the bullseye. The results illustrate where additional investment is needed on a statewide basis and provides a basis for setting maintenance priorities during the year.
Targeted and Actual Performance Results Used to Set Maintenance Priorities
Source: WSDOT. 2017. Multimodal Asset Performance Report. Washington State DOT. https://wsdot.wa.gov/publications/fulltext/graynotebook/Multimodal/AssetPerformanceReport_2017.pdf
Washington DOT
To support accountability, credibility, and transparency, the Washington State DOT publishes its quarterly performance report, referred to as The Gray Notebook. Each edition of the Gray Notebook presents updates on multimodal systems' and programs' key functions and analysis of performance in strategic goal areas based on information reported to the Performance Management and Strategic Management offices of the Transportation Safety and Systems Analysis Division. Washington State DOT also publishes its Gray Notebook Lite, which highlights key metrics referenced in the Gray Notebook in a format for quick reading. Examples from each of these documents are presented in the figures.
The Gray Notebook and the Gray Notebook Lite

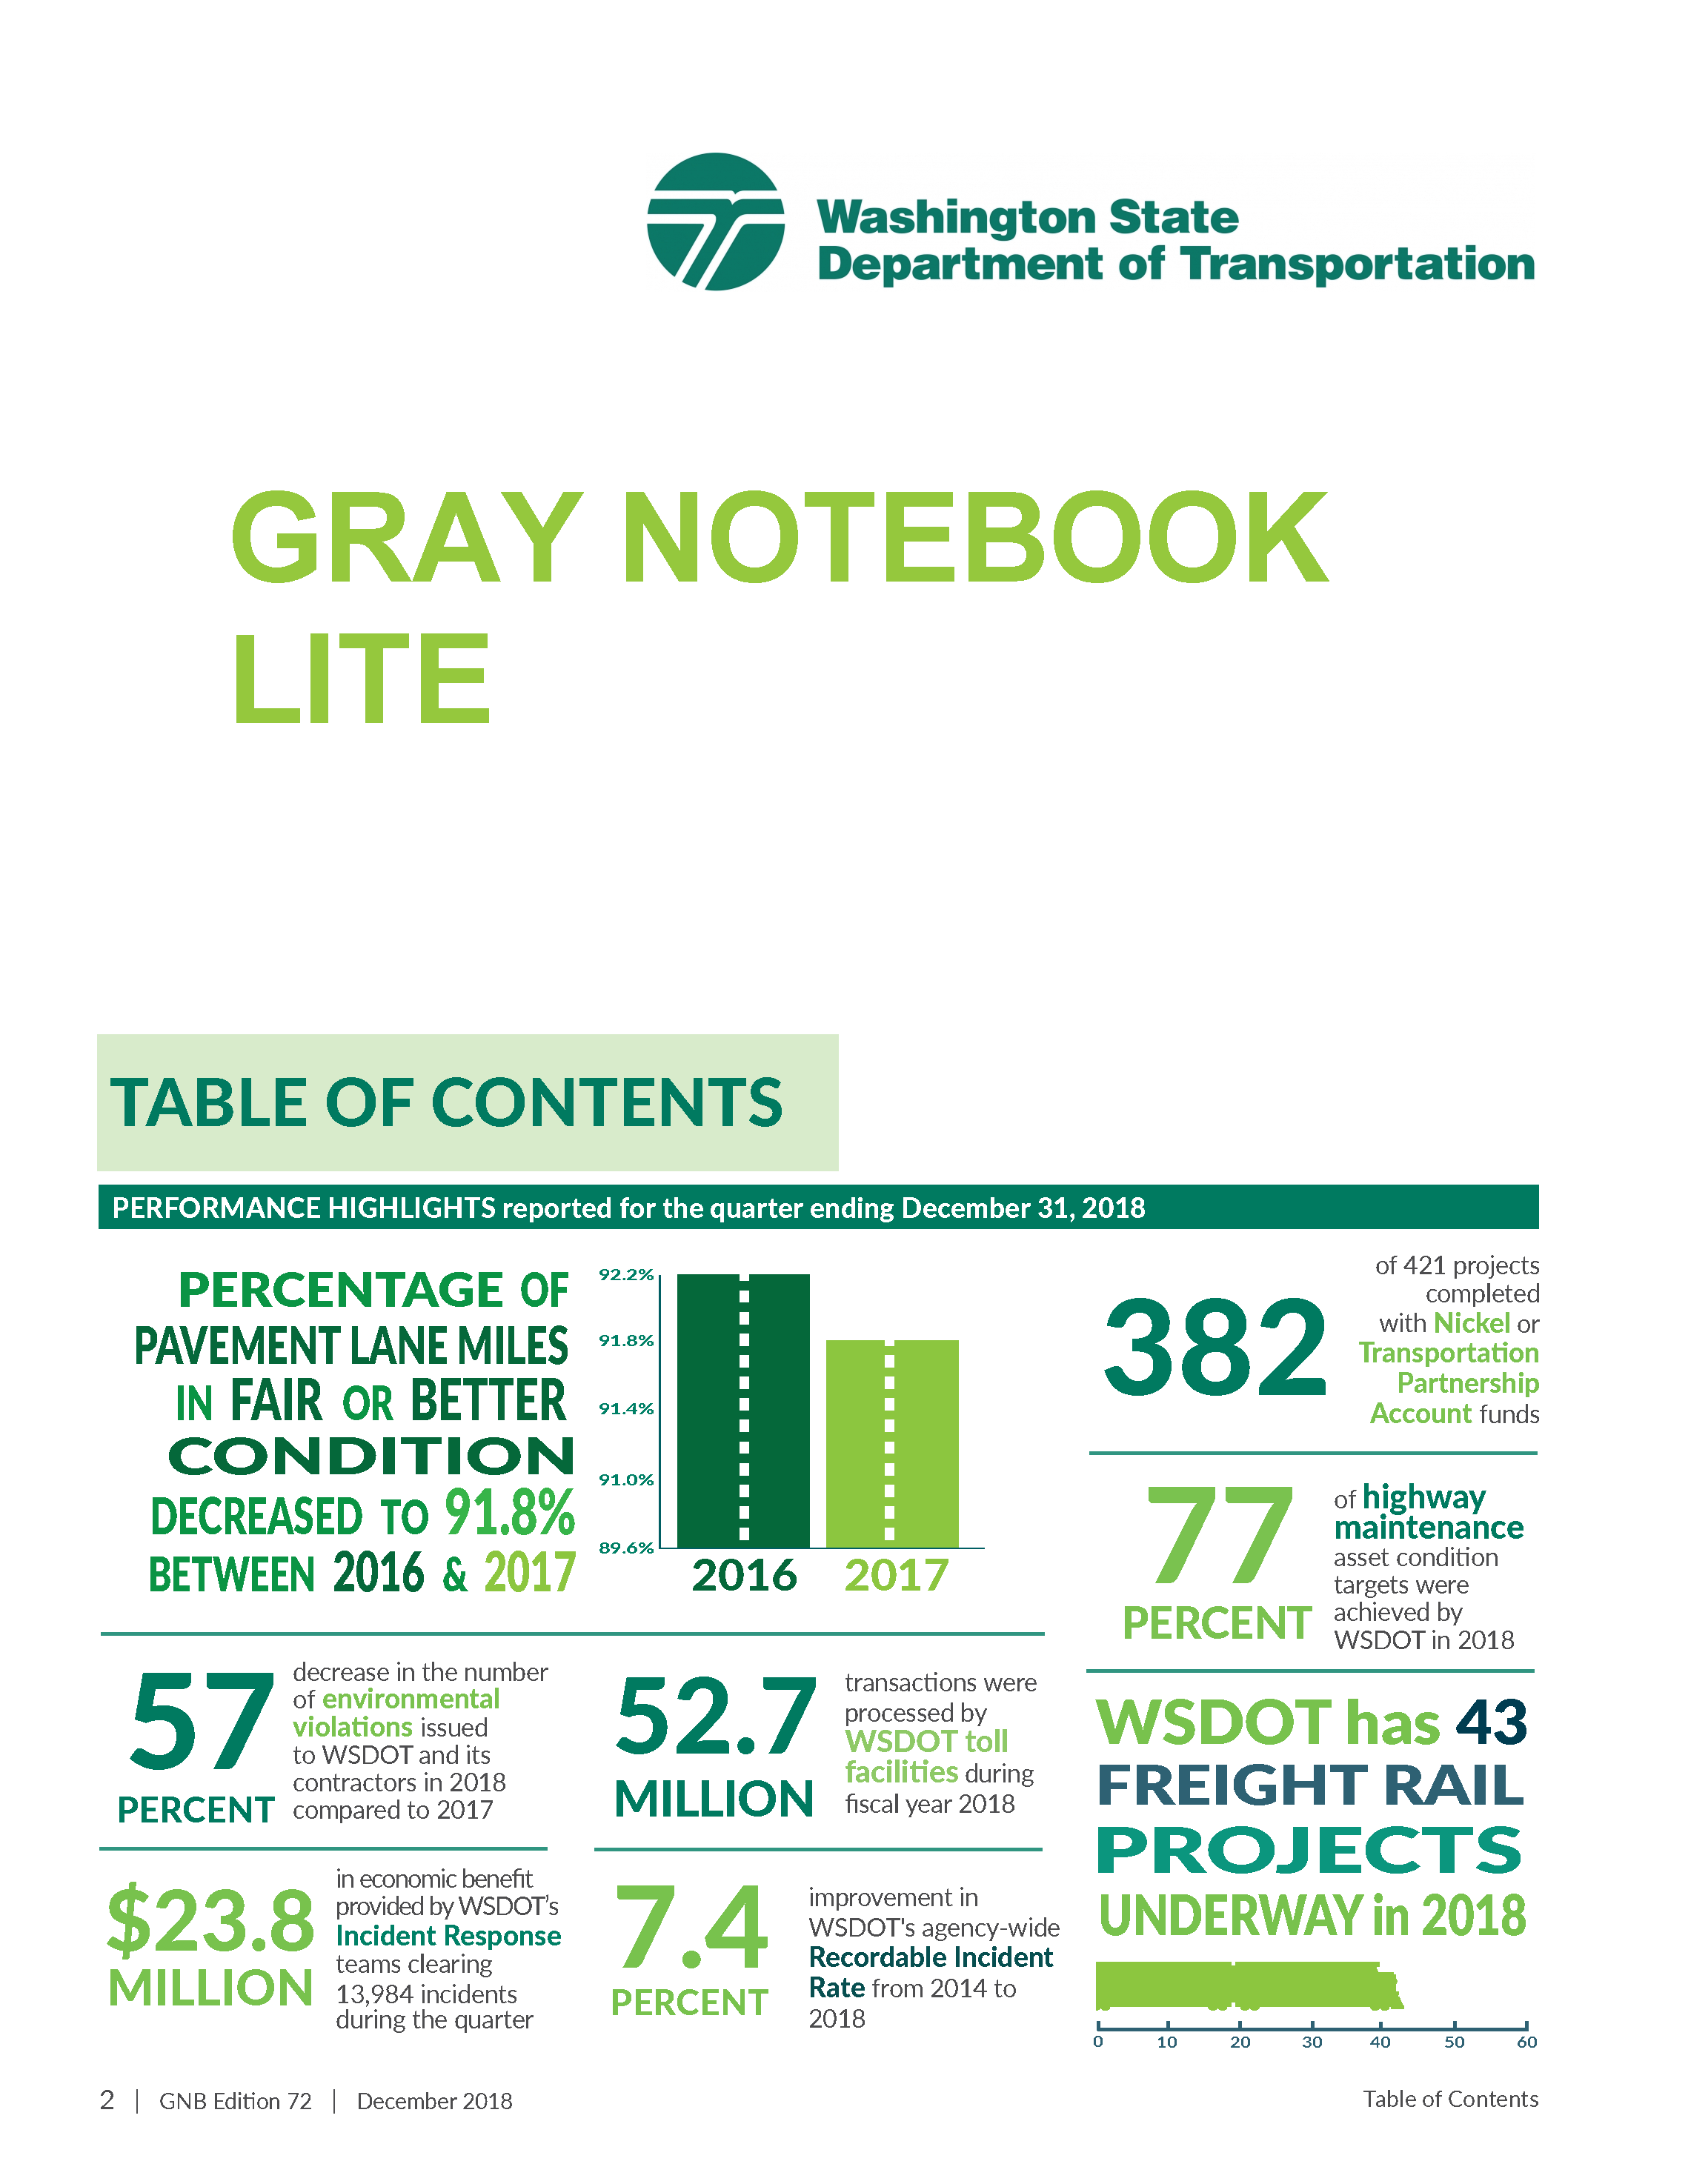
Source: WSDOT. 2019. https://wsdot.wa.gov/about/accountability/gray-notebook
Virginia DOT
Performance dashboards are also a popular way to present progress, using color-coded indicators similar to those on the dash of an automobile. An example of the interactive dashboard available from the Virginia DOT is shown in the figure. The screen reports performance in seven areas (performance, safety, condition, finance, management, projects, and citizen survey results) and the needles indicate whether the performance is within targeted ranges. Hyperlinks are available in each area if a user wants to explore historical trends or explore performance objectives in more detail.
Virginia DOT's Performance Dashboard

Source: Virginia DOT. 2019. http://dashboard.virginiadot.org/
Future Directions in Performance Measures
As agencies advance the maturity of their practices and move towards investment decisions across assets and modes (as discussed in Chapter 5), there is increasing interest in the use of leading measures and asset performance measures that can be used in concert with asset condition measures.
Asset management plans document the processes and investment strategies developed by an agency to manage its infrastructure assets. These asset management plans support an agency’s performance-based planning and programming processes for making long-term investment decisions and feed shorter-term project and treatment selection activities. Together, these activities ensure the investment decisions of an agency are aligned with performance objectives and goals.
Examples of innovative new performance measures include:
- Financial Measures – Internationally, financial performance measures have been used successfully to express whether the level of investment has been adequate to offset the rate of asset deterioration or depreciation. For example, the Queensland Department of Infrastructure and Planning uses an Asset Sustainability Ratio defined as the capital expenditure being made on asset renewals (e.g., improvements) divided by the depreciation expense (discussed further in Chapter 4). If the ratio is less than 100 percent, the level of investment is not adequately replacing the depreciation occurring each year. Queensland also uses an Asset Consumption Ratio comparing the current value of the depreciable assets to their replacement value in order to show the aged condition of the assets.
In the United States, some agencies are evaluating the use of an Asset Sustainability Index (ASI), which is the ratio of the budget allocated to address needed improvements identified by a pavement or bridge management system (FHWA. 2012. Asset Sustainability Index: A Proposed Measure for Long-Term Performance, Federal Highway Administration, Washington, D.C.). The ASI is a unitless measure that allows comparisons across asset classes and provides an overall assessment of the adequacy of an agency’s investment in its assets. Since it is unitless, an agency could individually calculate a Maintenance Sustainability Ratio, a Pavement Sustainability Ratio, and a Bridge Sustainability Ratio that are all combined into an overall ASI. One of the difficulties in calculating the ASI is defining the needed level of investment since needs are significantly impacted by targeted condition levels. Slight changes in targeted conditions can have a significant impact on the resulting ASI calculation.
- Life Cycle Measures - A life cycle performance measure is a relatively new leading measure, promoting the selection of sound, long-term strategies best able to maximize performance at the lowest possible cost. There are several life cycle performance measures under consideration, including the Remaining Service Interval (RSI), validated under an FHWA-sponsored research project. The RSI is based on identifying a structured sequence of the type and timing of various repair and replacement actions needed to achieve a desired LOS over a long timeframe at the minimum practicable cost. The results of the RSI evaluation may be used to generate a Life Cycle Impact Factor, summarizing the difference in life cycle costs associated with the various strategies being considered. Documentation from a pilot implementation of the RSI approach is available through the FHWA (https://www.fhwa.dot.gov/publications/research/infrastructure/pavements/21006/21006.pdf).
- Sustainability Measures – With an increased focus on identifying long-term sustainable solutions to transportation system needs, agencies may seek to develop new sustainability performance measures in order to properly indicate the impact a proposed solution may have on environmental conditions. The use of a recycling measure for gauging the amount of recycled material used in road construction is an example of this type of measure, as are measures for monitoring carbon dioxide emissions.
- Equity Measures -The increased emphasis on equity, inclusion, and diversity is impacting planning and investment decisions at several transportation agencies. As equity considerations are added, there has been some discussion related to the types of measurable performance measures that can be used without bias toward certain users or modes of transportation. In a case study prepared by the FHWA’s Transportation Asset Management Expert Task Group, a suggestion was made to further explore both quantitative and qualitative performance measures in this area.
TIP
Making performance measures publicly available through reports, scorecards, or dashboards increases transparency into agency operations, which can serve as motivation to improve staff’s desire to meet the standards established, thereby increasing the chance of success.
North Carolina DOT
The North Carolina DOT has an interactive Organizational Performance Scorecard that provides an online indicator of the Department’s success at meeting targets in the following six core goal areas:
- Make Transportation Safer.
- Provide Great Customer Service.
- Deliver and Maintain Infrastructure Effectively and Efficiently.
- Improve Reliability and Connectivity of Transportation Systems.
- Promote Economic Growth Through Better Use of Infrastructure.
- Make NCDOT a Great Place to Work.
An example of how the information is shown; it presents the target for an overall infrastructure health index and the most recent results. As shown by the red “x” in the box on the far right, NCDOT is not currently meeting its target of a health index of 80 percent or more.
North Carolina DOT’s Organizational Performance Scorecard Website – Excerpt
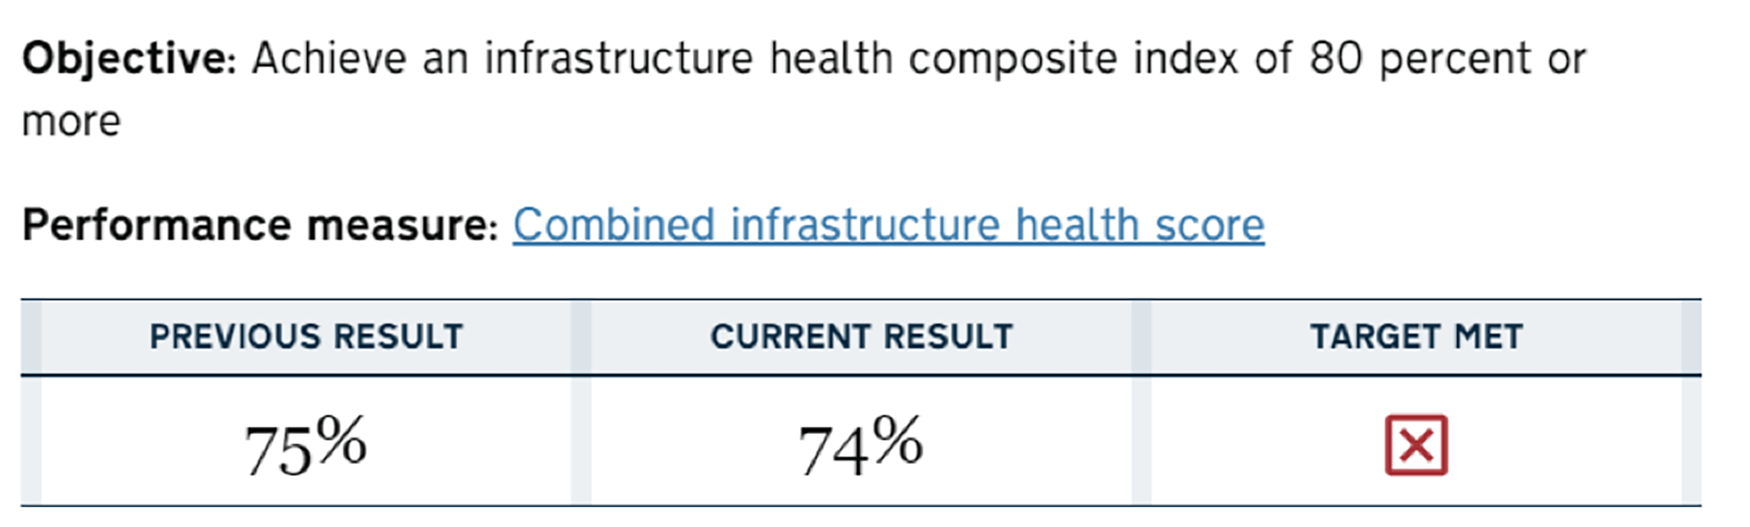
Source: NCDOT. 2019.https://www.ncdot.gov/about-us/our-mission/Performance/Pages/default.aspx
Evaluating the Effectiveness of Performance Measures 6.1.2
Because of the important role performance measures have in supporting performance-based decisions, agencies should use care in selecting measures that drive the right types of results. This section introduces several approaches to evaluate the effectiveness of an agency’s performance measures.
Assessment
TPM Webinar #17 - Agency Innovations and Improvements Blitz
In its handbook for agency executives, AASHTO suggests an assessment of performance measures should consider the following:
- Is the number of performance numbers reasonable? – An agency should retain performance measures addressing critical areas of importance that are maintainable with time. The Maryland and New Mexico DOTs have approximately 80 measures reviewed on a regular basis, but the Florida and Pennsylvania DOTs use approximately 15 to 20 measures to review strategic performance. Some agencies identify a small number (< 10) of KPIs selected from the pool of operational and tactical measures that best reflect an agency’s progress toward achieving its overall goals.
- Are the measures meaningful? – Some agencies choose only to use easily measured performance activities because the information is easy to obtain. However, other measures may do a better job of driving good decision making.
- Does the level of detail in data collection match the level of detail required to drive decisions? – Agencies should balance data availability with the analytic rigor used to make decisions. For instance, if pavement markings are replaced every year, it is not necessary to collect retro-reflectivity information annually. Similarly, collecting data on one lane of a two-lane highway may be enough for approximating the condition across the full width of the roadway.
- Do they support the right decisions? – The performance measures should drive decisions in support of strategic objectives. For example, a performance measure based on the amount of overtime incurred after a snow event is less effective than one able to monitor the number of hours until the roads are cleared.
- Are existing data sources reliable? – In most situations, existing data can provide the information needed for performance management, but it must be reliable and maintained regularly to be useful.
An assessment of performance measures can be important, since many organizations find that over time, the number of performance measures they are managing can become unwieldy.
Pennsylvania DOT
After using performance measures for years, the Pennsylvania DOT recognized that the number of measures being used had increased to a level that was difficult to manage. In 2011, the Pennsylvania DOT conducted an assessment of their performance measures using the following series of questions to guide their decisions as to which measures to keep, which to change, or which to delete:
- Who is using the measure?
- What exactly is being measured?
- Why is this particular measure needed?
- Whose performance is being measured?
- Is the performance goal defined?
- Does a similar measure already exist?
- Is the existing measure meeting the needs and intent or should it be modified?
If a measure was needed where no measure exists, the following additional questions were used:
- Does the measure affect continuous improvement?
- Is the data for the measure updated as frequently as needed? Should it be updated monthly, quarterly, or yearly?
- Is the measure easy to quantify?
- Is the measure easy to understand?
- Is it clear who owns the measure?
- Does the measure provide a means of comparison?
- Have unintended consequences been investigated?
- Can the unintended consequences be successfully mitigated?
The process has helped to ensure that the agency is focused on the right measures to drive desired results and behaviors. The analysis found several issues that could be addressed, including eliminating duplicate or overly complicated measures, modifying measures that were driving unintended consequences, and resolving data quality issues.
SMART Evaluation
As discussed earlier, performance measures are used to set desired or targeted levels of service. Targets may be short-term, such as the 2- and 4-year targets state DOTs are required to submit to FHWA, or they may be long-term targets, such as the desired State of Good Repair (SOGR) serving as the basis for an agency’s TAMP.
Performance targets are evaluated using the “SMART” method, which evaluates whether targets are:
- Specific. The performance is explicitly described.
- Measurable. Progress towards the target can be monitored in a consistent manner.
- Achievable. The target considers past performance, expected changes in demand, available resources and other considerations that make it realistic.
- Relevant (also referenced as results-oriented). The target should be meaningful to the agency and drive the right outcomes.
- Time-related (also referenced as timely or time-bound). There is a stated timeframe for achieving the target.
Nevada DOT
The Nevada DOT recognized that although performance measures were being reported regularly, they were not driving agency policies or decisions. The assessment evaluated the performance measures being used in each of the five key performance areas shown in the figure as well as the organizational culture to support performance management.
The study recommended improvements to emphasize the importance of messaging in order to advance the agency’s performance management culture, extend the performance culture beyond the headquarters office to field staff, and develop job performance plans emphasizing accountability at the division, office and unit levels. The study also recommended the periodic review of performance measures to ensure their continued relevance to agency business processes.
Nevada DOT’s five key performance areas and measures
Source: Nevada DOT. 2017. Adapting a Culture for Performance Management at the Nevada Department of Transportation.
Benchmarking
In simple terms, benchmarking is a process of comparing performance and practice among similar organizations as part of an agency’s continuous improvement activities. Benchmarking provides an opportunity to learn about approaches used by high-performing organizations to uncover noteworthy practices, inform target-setting activities, or to foster innovation and improvement within an agency. Benchmarking should focus on improvement and lessons learned rather than as a way to penalize underperformers.
As mentioned in Chapter 1, AASHTO has developed a comparative benchmarking tool for enabling state DOTs to compare performance outcomes and practices with peer agencies as part of their continuous improvement activities (http://benchmarking.tpm-portal.com/). This includes a peer selection tool, so agencies can compare practices to peers with similar characteristics. It also features a performance comparison tool with a number of chart options enabling agencies to compare results. For instance, an agency may elect to compare pavement smoothness characteristics with a neighboring state. There is also a portal to facilitate the exchange of practices among registered DOT users through a Notable Practice Narrative.
An example from the AASHTO TPM Portal showing a comparison of bridge deck percentage determined to be structurally deficient is shown in Figure 6.2. Similar comparisons are available for safety, environmental, and non-motorized (bicycle and pedestrian) performance measures. For transit agencies, Transit Cooperative Research Program (TCRP) Report 141, A Methodology for Performance Measurement and Peer Comparison in the Public Transportation Agency, provides specific guidance for comparing performance with other agencies.
Figure 6.2 Example Performance Comparison from the AASHTO TPM Portal
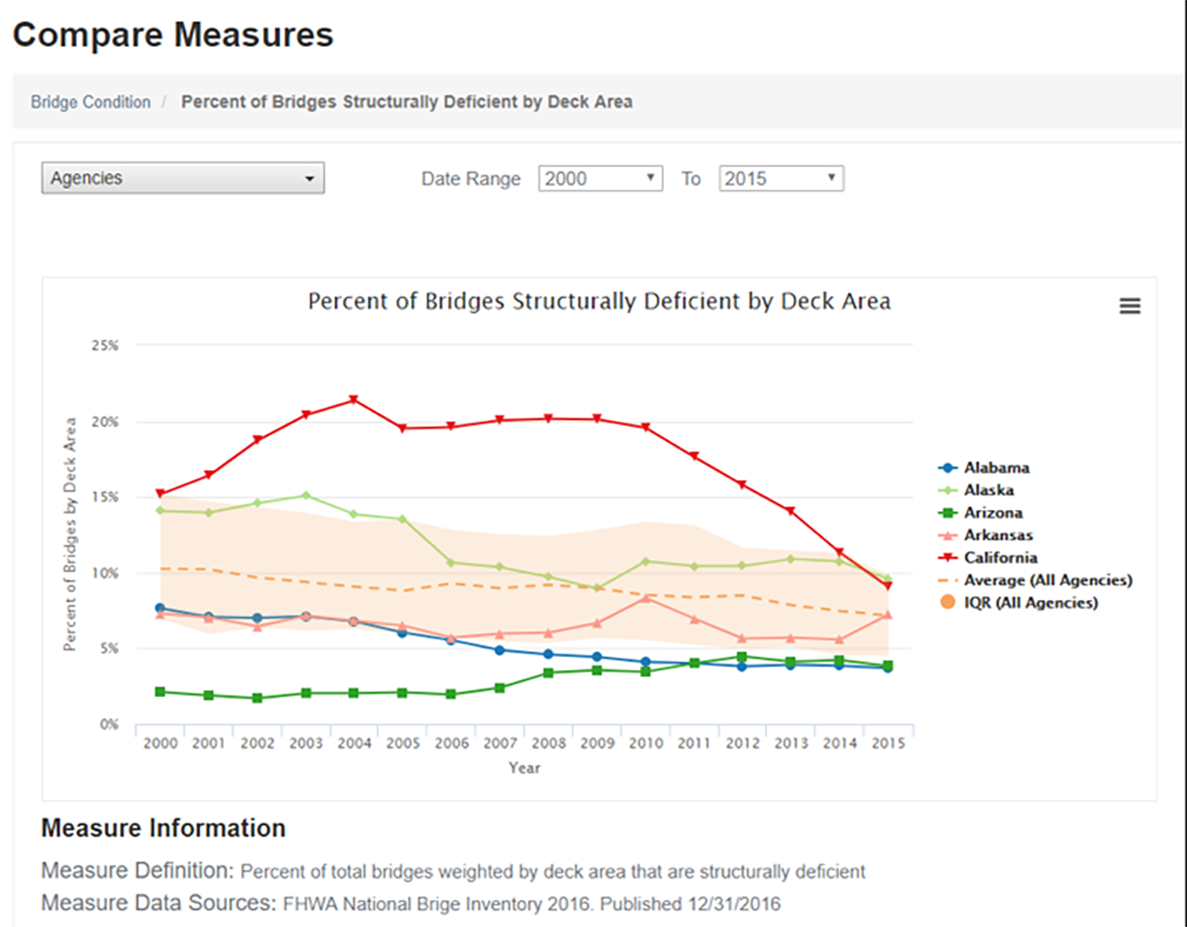
Source: TPM Portal. 2019. http://benchmarking.tpm-portal.com/compare/bridge-condition/deficient-bridges
Audits
Internationally, ISO standards include the conduct of periodic internal audits to help an agency evaluate whether its asset management program and components meet the agency’s needs, adhere to best practices and are being used to support decisions. In addition, agencies use auditing for service providers to confirm contract compliance in situations where road network maintenance and management activities have been outsourced.
TIP
The AASHTO TPM Benchmarking Tool (http://benchmarking.tpm-portal.com/) was designed to assist state DOTs with benchmarking TPM data, providing a data source and comparison tools.
Target Setting Methods 6.1.3
This subsection outlines methods for setting transportation performance targets, focusing on safety, infrastructure condition, reliability, and traffic congestion. It introduces quantitative target-setting approaches, such as policy-based methods, historical trends, probabilistic approaches, statistical models, and summarizes their ease of application, technical robustness, ease of communication, and support for agency policies. The guide also offers suggestions for selecting an appropriate target-setting approach.
Introduction
NCHRP Research Project 23-07, Guide to Effective Methods for Setting Transportation Performance Targets, presents several approaches for setting performance targets to support a TPM framework. It focuses on target setting for the national measures that are required under federal TPM requirements, including:
- Safety measures: Number of fatalities, rate of fatalities, number of serious injuries, rate of serious injuries, number of nonmotorized fatalities and nonmotorized serious injuries.
- Infrastructure condition measures: Percentage of the Interstate system pavements in good and poor condition, percentage of the non-Interstate NHS pavements in good and poor condition, and percentage of the NHS bridges in good and poor condition.
- Reliability (travel time and freight) measures: Percentage of person miles traveled on the Interstate and Non-Interstate NHS that is reliable and truck travel time reliability index.
- Congestion measures: Annual hours of peak hour excessive delay per capita and percentage of non-single-occupancy vehicle travel.
- Target setting for nonrequired measures, such as accessibility, greenhouse gas emissions, active transportation, transit ridership, and customer satisfaction are included in the final section of the guide.
TPM Webinar #12 - Target Setting
Target Setting Approaches
The guide recognizes that transportation agencies take different approaches to target setting. Some may prioritize setting realistic targets based on fiscal constraints. Other agencies may set aspirational (or fiscally unconstrained) or conservative targets.
Regardless of the approach to target setting, the guide recognizes that both quantitative and qualitative approaches may be considered. In some instances, qualitative approaches that are heavily influenced by politics or agency leadership may be appropriate. An annual target to reduce fatalities to address a long-term Vision Zero goal is an example of a qualitative target. Other approaches may use statistics or probabilities to define a quantitative target. The use of travel demand forecasts to set a mobility target illustrates the use of a quantitative approach to target setting. A combination of qualitative and quantitative approaches may also be used to set effective targets.
The following five quantitative methods for setting targets are presented in detail within the guide (Grant, M., et.al. 2023A):
- Policy-based approaches, such as establishing a maximum rate of change (e.g., annual increase of at least 2 percent).
- Historical trends (e.g., set a value based on a 5-year trend).
- Probabilistic and risk-based approaches that consider performance variability (e.g., performance based on the likelihood of increased storm frequency and intensity).
- Statistical models (e.g., rates of deterioration based on regression models).
- Other tools and models (e.g., output from a bridge or pavement management system).
When selecting the appropriate method for target setting, the guide offers the following tips (Grant, M., et al. 2023A):
- Understand the complexity of the methods - some methods require sophisticated data that may not be readily available and may result in marginal improvements in the target's effectiveness.
- Consider combining methods - by using several approaches, an agency has the benefit of considering the results from multiple methods in setting the final target.
The Guide (NCHRP Report 1035) presents several target-setting methods for each of the Federal performance measure categories along with a summary of their ease of use, robustness, ease of communication, and support for agency policies. A high-level synopsis of the information presented in the Guide is presented in the following table.
Table 6.2 - Features associated with different target-setting approaches (based on Grant, M., et.al. 2023A)
| Federal Performance Measure Category | Target Setting Approach | Description | Ease of Application | Technical Robustness | Ease of Communication | Allows for Policy Preference |
|---|---|---|---|---|---|---|
| Safety | Targeted Reduction | Defined decrease from baseline regardless of past trends | H | L | H | H |
| Safety | Time-Series Trend | Based solely on historical performance data | H | M | H | L |
| Safety | Trend Plus Other Factors | Adjustments made to results from other approaches | H | L | M | H |
| Safety | Multivariable Statistical Model | Statistical analysis considering multiple variables | L | H | M | L |
| Infrastructure Condition | Target Based on Change in Condition | Consensus decision | H | None | L | H |
| Infrastructure Condition | Time-Series Trend | Based solely on historical performance data | H | L | M | M |
| Infrastructure Condition | Time-Series Trend Plus Future Funding | Historical trends extrapolated into the future | H | L | M | M |
| Infrastructure Condition | Asset Management System | Condition forecasts based on expected funds | L | H | M | M |
| Infrastructure Condition | Scenario Analysis | Management system analysis of multiple scenarios | L | H | M | M |
| Reliability | Building off the Baseline with Assumptions | Qualitative approach to adjusting baseline values | H | L | H | M |
| Reliability | Time-Series Trend Analysis | Based solely on historical performance data | H | M | M | M |
| Reliability | Trend Plus Other Factors | Adjustments made to results from other approaches | H | M | M | M |
| Reliability | Performance Risk Analysis | Statistical analysis of variations due to risks | M | H | M | M |
| Reliability | Segment Risk Analysis | Analysis of individual segments to determine those that shift between reliable and unreliable | L | H | M | M |
| Reliability | Multivariable Statistical Model | Statistical analysis considering multiple variables | L | H | L | L |
| Traffic Congestion | Building off the Baseline with Assumptions | Qualitative approach to adjusting baseline values | H | L | H | H |
| Traffic Congestion | Time-Series Trend Analysis | Based solely on historical performance data | M | M | M | M |
| Traffic Congestion | Trend Plus Other Factors | Adjustments made to results from other approaches | M | M | H | H |
| Traffic Congestion | Travel Forecasting Model | Model used to estimate excessive delay for the base year and forecasted year | H | M | M | L |
| Traffic Congestion | Policy Based | Model based on regional policy goals | H | L | H | H |
Features Summary (L=Low, M=Medium, H=High)
New Jersey DOT
NCHRP Web-Only Document 358, which is a supplemental report to the Guide to Effective Methods for Setting Transportation Performance Targets, provides examples documenting how target-setting methods are being used by various transportation agencies. One of the examples illustrates how the New Jersey DOT piloted the use of a scenario analysis approach for setting its pavement infrastructure condition targets. An important consideration in the use of this approach was the availability of a pavement management system (PMS) capable of forecasting future pavement conditions. However, the New Jersey DOT had not established prediction models for the Federal cracking metric, so methods were developed to correlate forecasted conditions from existing models to the Federally-required cracking metric. Correlations were developed using three years of condition data collected in accordance with both the agency’s legacy Condition Status rating and the Federal measures in 0.1-mi segment lengths. Using both sets of data, correlations were developed based on the likelihood that a pavement section rated “Good” using the agency’s CS rating would also be classified as a “Good” pavement using the Federal definitions. The correlations found that 88.43 percent of the segments were rated “Good” based on both approaches (Grant, M., et.al. 2023B). A similar approach was used to correlate “Poor” conditions, but the analysis showed more variability in correlating segments at this condition level. To address the variability, New Jersey DOT decided to use 3-year averages to establish the final correlations, which are presented below (Grant, M., et.al. 2023B).
Table 6.A - Correlation between NJDOT CS and Federally-mandated condition ratings (Grant, M., et.al. 2023B)
| Federal Good | Federal Fair | Federal Poor | |
|---|---|---|---|
| NJDOT Good | 87.5% | 13.78% | 0.00% |
| NJDOT | 23.74% | 76.25% | 0.01% |
| NJDOT | 6.36% | 86.02% | 7.62% |
The correlations were applied to the predicted conditions generated by the PMS to determine the expected conditions using the Federally-mandated performance measures. Several scenarios were generated, allowing the NJDOT to use the results to set realistic Federal targets.
Addressing Disruptions to Performance in Target Setting
It is inevitable that agencies will face events that disrupt what might be expected to be typical performance. Sometimes these events alter performance for a short period of time before performance returns to typical patterns. In other situations, the event may alter performance for a long period of time, as the changes associated with working from home following the COVID-19 pandemic have had on traffic patterns, congestion, and safety. The guide provides examples illustrating times when an agency might choose to include or exclude the disruption or use the disruption to alter previous performance patterns.
Types of Performance-Based Data to Monitor 6.2.1
This section describes the types of information that should be collected and maintained to support performance-based decisions for physical assets. This section focuses on asset inventory and condition information for life cycle management, but recognizes that other operational performance characteristics may be important to determine whether an asset is fulfilling its intended function.
Differences in Performance and Condition
The terms ‘performance’ and ‘condition’ are often used interchangeably, although they have different meanings in a performance-based environment. The performance of an asset relates to its ‘ability to provide the required level of service to customers3’ while condition is generally considered to mean the observed physical state of an asset, whether or not it impacts its performance. For example, a bridge with scour may continue to perform adequately in the short-term even though it may receive a low National Bridge Inventory (NBI) rating because of the deterioration.
Inventory Information
An asset inventory provides information other than performance data important for estimating the amount of work needed, identifying the location of work in the field and determining characteristics capable of influencing the type of work to be performed. The RCM approach introduced in Chapter 4 can be used to help an agency determine what information is needed to support the management of each type of asset. The asset inventory requirements for those assets managed based on a specified interval for repair, such as pavement markings, is very different than those required for an asset managed using a condition-based approach, such as pavements or bridges. Regardless of how detailed the asset inventory is, it is important an agency establish processes to ensure data quality and keep the inventory current over time.
There are several basic data attributes essential to effectively managing transportation assets, including asset type, quantity and location. Additional information that is important is to differentiate between the types of work to be performed, which may also be added to the inventory, the type of material used to construct the asset, the last time work was performed and factors influencing the use of the asset (e.g. traffic levels, highway functional classification or climatic conditions).
As discussed in Chapter 7, managing asset inventory information using an integrated approach to data management helps promote consistency in asset data across an agency and provides access to help ensure the data is used by decision makers at all levels of the organization. An out-of-date inventory makes it difficult for an agency to estimate work quantities accurately for budgeting purposes.
Condition Information
Asset condition information is used to determine how assets are performing and how performance changes over time. The lack of condition information may lead to premature or unexpected failures with the potential to be very costly, negatively impacting system performance and increasing agency risks. Methods of collecting asset condition information are discussed further in Chapter 7. To ensure that condition information remains current, it is important that the information is updated on a regular basis.
Asset Condition
There are several approaches for assessing asset conditions, each of which is influenced by the type of asset and the resources available to support the process. Typically, an assessment of asset condition involves a method of evaluating the presence of deficiencies and/or deterioration at the time of inspection. The results are used to assign a rating or LOS used to determine the need for maintenance, rehabilitation or replacement now or in the future. Asset condition ratings may also be used to establish rates of deterioration, allowing an agency to forecast future conditions for planning purposes.
Examples of commonly used types of asset condition ratings are listed below.
- A pavement condition index based on the type, amount and severity of distress present, which could be on a 0 to 100 scale, with 100 representing an excellent pavement.
- The National Bridge Inventory (NBI), which assigns a rating between 1 and 9 based on the deterioration present in each element (deck, superstructure, substructure and culvert).
- A LOS rating of A to F for maintenance assets, such as the percent blockage in a culvert or the percent of guardrail not functioning as intended.
Maintaining asset condition information is important for evaluating performance to determine whether improvements are needed to achieve the agency’s strategic objectives. The lack of current condition information, or a lack of confidence in the condition information, makes it difficult to present investment needs to stakeholders with any degree of confidence.
Asset Performance
The results of condition surveys or inspections are used to evaluate the performance of each asset in terms generally understood by stakeholders, such as Good, Fair or Poor.
It is common for transportation agencies to report the percent of the network in Good or Fair condition or the percent of drivers traveling on roads in Good and Fair condition. Asset performance can also be reported in terms of a health index, such as the Remaining Service Life (RSL) used by some state DOTs to indicate the amount of serviceable life left in the asset. In the maintenance community, some state DOTs have developed a Maintenance Health Index or overall LOS grade to represent the performance of the entire Maintenance Division rather than report the grades of each category of assets separately.
Asset performance also influences overall system performance, as demonstrated by the impact on system reliability associated with unplanned road or bridge closures due to flooding or an on-going lack of maintenance. Performance data related to delay, unplanned closure frequency, GHG emissions, and crash locations may all be impacted by asset conditions and affect an agency’s ability to achieve its broader, strategic performance objectives such as system reliability, congestion reduction, environmental sustainability, and freight and economic vitality. For example, it is important to monitor performance characteristics such as travel time reliability to determine whether capital improvements are needed to add additional lanes or whether ITS assets could improve traffic flow during peak periods.
Ohio DOT
The Ohio DOT recognizes the importance of integrated management systems to support both life cycle and comprehensive work planning activities. One of the tools developed by the Ohio DOT is its Transportation Information Mapping System (TIMS), which enables planners, engineers and executives to access and manage key asset, safety and operational data in an integrated web-mapping portal (https://gis.dot.state.oh.us/tims). The portal is available to both internal and external stakeholders and allows users to access information about the transportation system, create maps or share information. The data integration efforts enabling TIMS are now underpinning all management system implementations.
Using Trend Data to Make Program Adjustments 6.3.2
This section illustrates how some agencies have successfully used historical trends to make program adjustments.
Adjusting a Program Based on Trends
TAM Guide Book Club #8: Strengthening How Data Supports Your TAM Program
The availability of historical trends is integral for making future projections as part of the planning and programming process. As shown by the examples included in this section, agencies have used trend data creatively to make program adjustments and more effectively align planned investments with strategic objectives.
Minnesota DOT
The Minnesota State Highway Investment Plan (MnSHIP) outlines a 20-year strategy for investing in the state highway system. The most recent document, published in 2017, outlines investment priorities for the period from 2018 to 2037 (http://minnesotago.org/application/files/3414/8431/5979/ MnSHIP_Final_Jan2017.pdf). One of the figures included in the plan uses historical inflation trends to illustrate the declining purchasing power of revenue due to construction costs growing at an annual rate of approximately 4.5 percent. This cost growth rate exceeds the projected annual revenue growth rate of approximately 2 percent, which is expected to erode over half of the buying power of revenues by 2037. As a result of this analysis, MnDOT was able to communicate its financial situation with stakeholders and could better manage the risks associated with continued construction cost increases over the planning period.
Anticipated Construction Revenue by Year Including Adjustments for Inflation
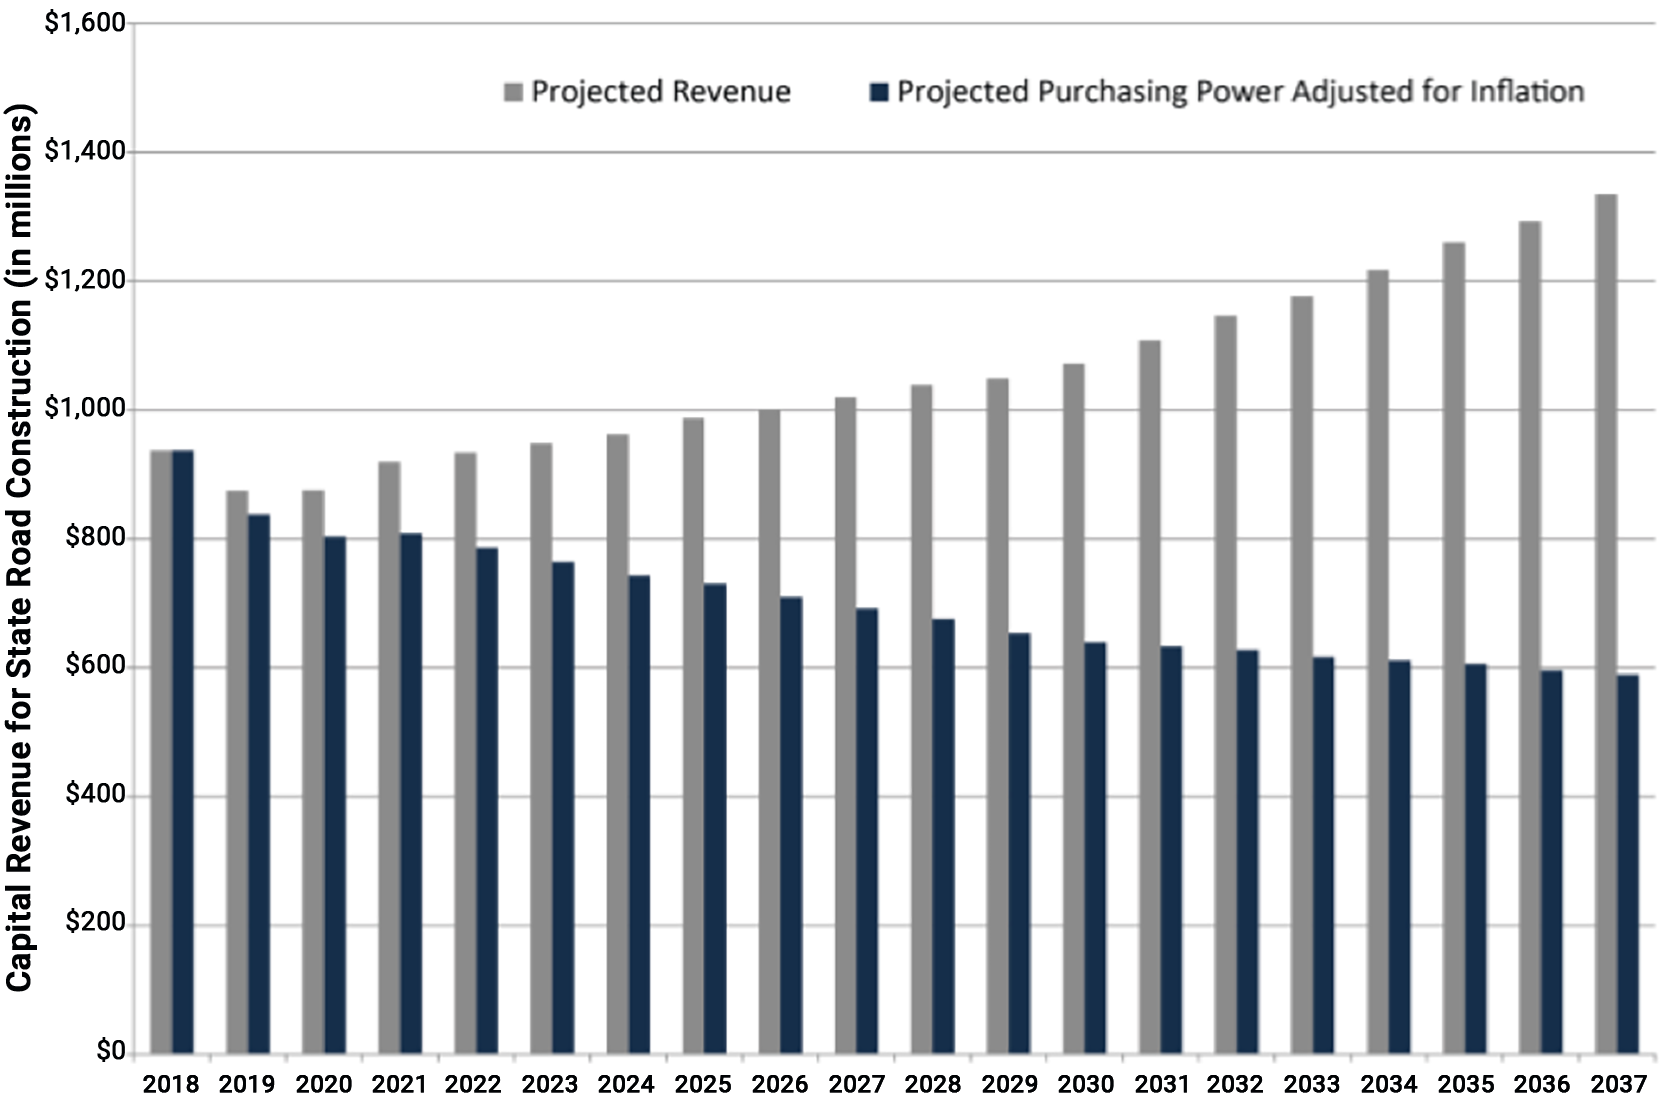
Source: Minnesota DOT. 20-Year State Highway Investment Plan 2018-2037.
Illinois DOT
The Illinois DOT used a graph showing the number of miles of state-maintained roads in need of unfunded rehabilitation or reconstruction, which was referred to as the backlog. The graph, shown in the figure to the right, illustrates the fact that the backlog was growing over time due to the inadequacy of funding. The increasing trend in backlog prompted the Illinois DOT to reconsider its approach to selecting projects and treatments, moving towards the increased use of preservation treatments to slow the rate at which pavement conditions drop into a backlog condition. In addition to the change in treatments, the Illinois DOT developed a new pavement performance measure based on the percent of the network in good enough condition to be a candidate for a preservation treatment. The change in performance measure was intended to shift funding priorities from deteriorated pavements to those that could be kept in good condition for a longer period of time. The changes were documented in the Illinois DOT’s April 2018 Transportation Asset Management Plan (http://www.idot.illinois.gov/transportation-system/ transportation-management/planning/tamp) and were used in developing the fiscal year 2019-2024 Multi-Year Proposed Highway Improvement Program. In addition, new software tools are being acquired to further support this improved approach to managing pavements and bridge assets.
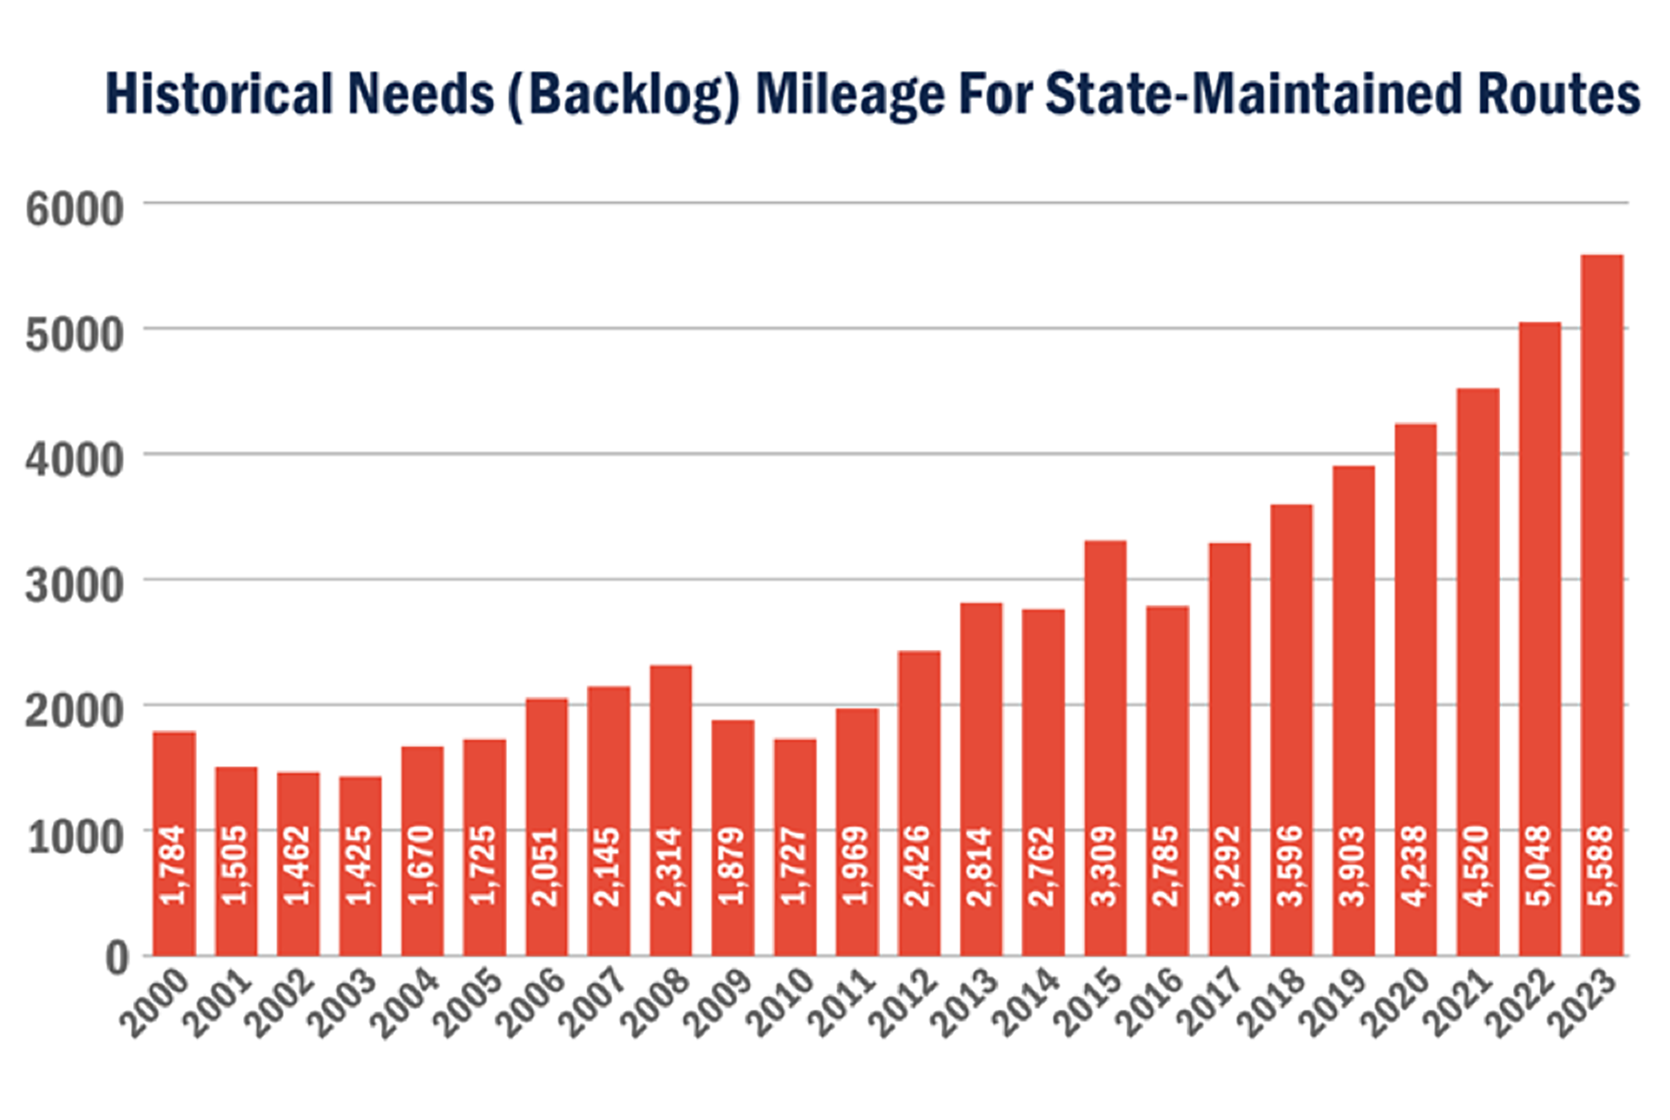
Source: Illinois DOT Transportation Asset Management Plan. 2018.
New Mexico DOT
In 2004, the New Mexico DOT realized that a significant percentage of state-maintained bridges were classified as structurally deficient. To address this issue, the agency targeted increased investments in bridge preservation. Going forward, the agency funded rehabilitation activities for bridges in poor condition and added preventive maintenance activities for bridges in good or fair condition to slow the rate of deterioration on these bridges. As shown in the figure to the right, the program has been very effective in improving bridge conditions. Adding a line to the graph showing the targeted conditions would help convey the impact that the increased preservation expenditures have had on achieving performance objectives.
Trend Showing the Decrease in Structurally Deficient Bridge Deck Area Resulting from Targeted Investments
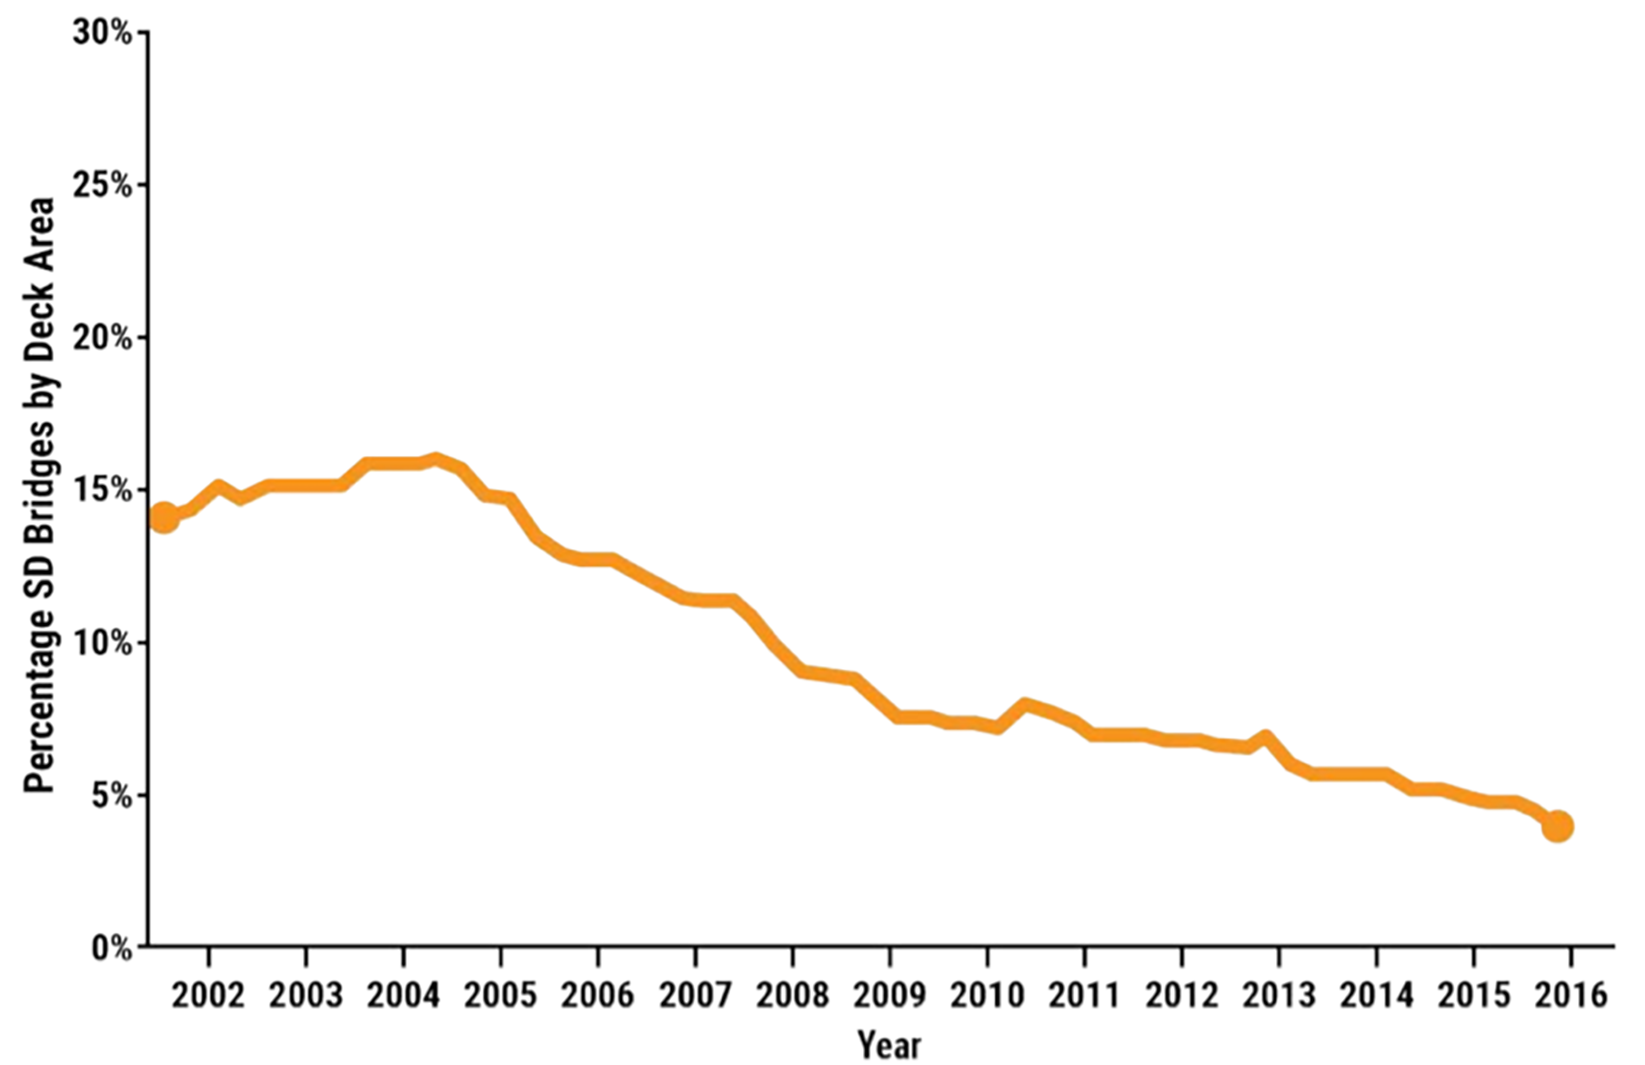
Source: New Mexico DOT Transportation Asset Management Plan. 2018.
South Dakota DOT
To determine the effectiveness of road investments, the South Dakota DOT uses historical trends and projects conditions for each road category to show whether targeted conditions can be achieved with planned investment scenarios. The figure to the right illustrates the type of graph developed for the Interstate network. As shown, the graph presents both historical and projected conditions based on a Surface Condition Index (SCI) that ranges from 0 to 5, with 5 representing a distress free pavement. Overlaid on the graph is the acceptable condition range, which in this case spans an SCI between 3.8 and 4.2. The graph shows that Interstate conditions gradually improved over time. Although it projects average future conditions to drop, they are expected to continue to fall into the acceptable condition range. The results of the analysis provide the agency with confidence that the planned investments will achieve the desired condition levels over the analysis period. In addition, the projections are updated annually to provide a picture of changing financial trends and funding availability. This allows the DOT to react to any downturn in the projections.
Past and Future Pavement Conditions and Goals
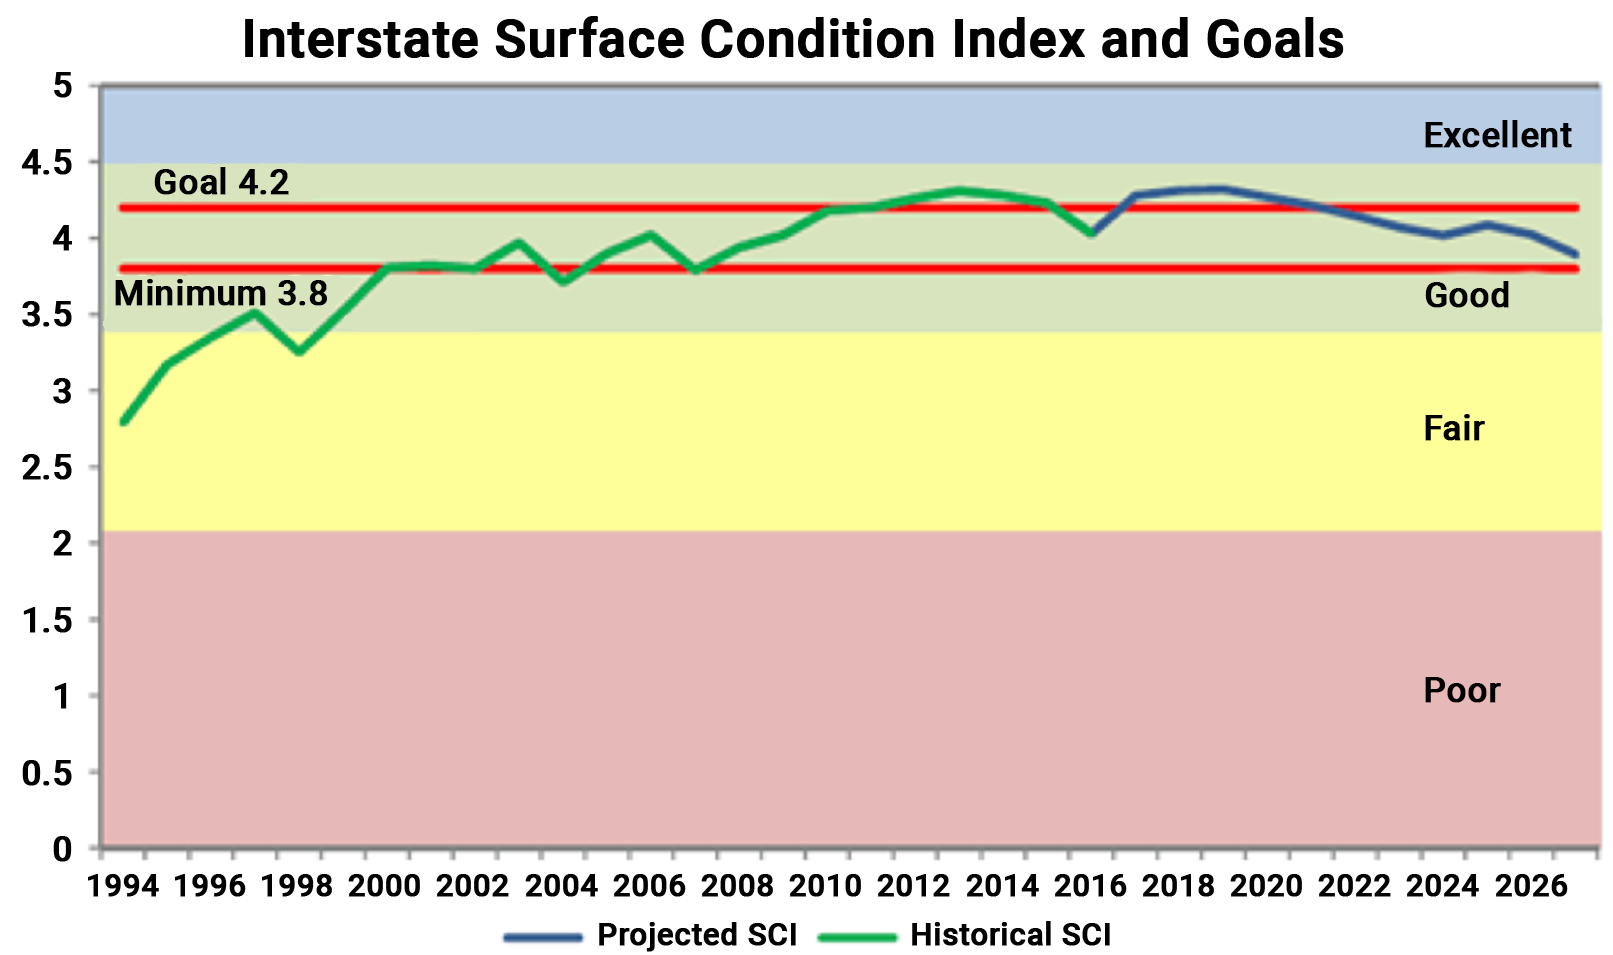
Source: South Dakota DOT Transportation Asset Management Plan. 2019. https://dot.sd.gov/media/documents/SDDOT2019TAMPFHWASubmittalrevised8-28-2019.pdf
Importance of Tracking Work Activities and Treatment Costs 6.4.1
This section describes the factors that should be considered for keeping
a management system current.
Why It Is Important to Track Work Activities and Treatment Costs
Asset management systems, such as pavement and bridge management tools, rely on the availability of complete, up-to-date inventory information to serve as the basis for all system recommendations. At a minimum, the most recent work activity and completion date are necessary for establishing an asset’s age or the length of time since work was last performed. These factors are key to setting a maintenance service interval or predicting the need for future work. Treatment cost information is used to estimate the cost of recommended work activities, so realistic numbers are important for planning and budgeting.
Work Activities
The level of detail required to track work histories is largely dependent on the sophistication and maturity of the asset management program. It is important to have access to information indicating when the asset was installed or constructed, or when the most recent major work activities were performed. Additional information about maintenance activities performed to preserve or improve the asset is beneficial if it can be provided efficiently and incorporated into decisions about managing an asset over its life cycle.
An agency should incorporate completed work activities into a management system at least annually, at the end of each construction season. At a minimum, the asset management database should be updated to reflect any changes to the asset properties, such as a change from a concrete to an asphalt pavement, and the date when the change was made.
Treatment Costs
Including the cost of maintenance and rehabilitation activities in a computerized maintenance system provides a historical record of how treatment costs have changed over time. The information from the management system, as well as bid documents, can be used to establish unit costs for each type of work activity possibly recommended by the system. Unit prices for each work activity included in the system are needed.
For many transportation projects, improving the condition of the asset is only one part of the total cost of a project. There are many other costs to incorporate into the unit price when estimating the cost of a treatment recommendation, including the cost of pavement markings, guardrails and signs on a pavement project. If these costs are ignored, the cost of a project will be underestimated, and an agency may program more work than can be constructed over a given timeframe. Some agencies inflate treatment costs by a factor of 30 to 40 percent to ensure the costs associated with project design and the improvement of ancillary assets are considered in the unit cost for a given treatment. Using this approach, $0.30 to $0.40 is added to every dollar associated with the cost of the work itself. The inflated cost (e.g., $1.40) is stored in the management system as the unit cost for estimating treatment costs.
Different unit costs may also be established to reflect different costs in urban and rural areas, or in different geographic regions of a state. These differences improve the accuracy of asset budgeting activities by reflecting the realities agencies face due to work activities in highly congested areas, differences in the availability of contractors and the scarcity of materials in certain areas.
In addition to being used to estimate budget needs, treatment cost information serves many other purposes. For instance, the cost of a proposed project and its expected life can be used to determine a Return on Investment to help ensure that the most cost-effective projects are being selected. The information can also be used to compare the effectiveness of one treatment over another, or one life cycle strategy over another. Cost information has also been used to demonstrate the benefits to using proactive maintenance across a transportation network rather than reactive maintenance.
Montana, Tennessee, and Utah DOTs
Several state DOTs are employing the use of technology to track maintenance work activities as noted below.
When new assets are installed as part of a construction project for the Montana DOT, Construction personnel are required to provide Maintenance with the information needed for updating the asset inventory. Maintenance verifies the information provided by Construction before inputting it into the system.
The Tennessee DOT uses an automated data collection van to establish its asset inventory for approximately 20 assets. The inventory is entered into a maintenance management system at a summary level for each county and a “ghosting” technique is used to identify differences in the inventory from one year to the next year.
The Utah DOT extracts is asset inventory every two to three years from the LiDAR collected as part of the agency’s annual pavement condition surveys; however, the DOT is moving towards a continuous inventory updating process that would be the responsibility of Maintenance supervisors.
Establishing Business Processes to Support Work History and Cost Tracking 6.4.2
To ensure that work history and treatment cost information is kept current, business processes should be established to maintain the data over time. This section stresses the importance of building business processes to update the data regularly.
Assign Responsibility
One of the first steps in establishing business processes to support the maintenance of work history and cost information is assigning responsibility to the appropriate person for managing the information. The individual assigned responsibility for updating work history and cost data in the management system is not always the individual responsible for providing the data. For example, some agencies assign responsibility for updating completed work history and treatment cost information to the maintenance or construction division, since they are typically involved in closing out a project. Regardless of who is assigned responsibility for the task, a clear line of accountability should be established as part of the business process.
Establish Processes to Update Work Activities
As discussed in Chapter 7, technology is improving agencies’ ability to track completed work activities, so the information is available for use in an asset management system. The access to handheld data entry devices with map interfaces linked to a centralized database helps ensure all users of the information have immediate access to current and consistent information. Business processes reliant on field personnel to remember to provide information to another data user are generally not sustainable.
To help establish a reliable approach for keeping asset data current, an agency may consider developing a data and process flow map illustrating the flow and use of data across the agency. This type of document helps an agency better understand where the data comes from, where it is stored, who uses the information and what levels of access various users need. A data and process flow map may become part of an agency’s data governance documentation in order to protect the integrity of asset data.
Build Buy-In To Support the Business Processes
Key to the success of any business process is establishing buy-in among the individuals responsible for each required step. This involves familiarizing the individuals with their responsibilities, providing tools and guidance for completing the activities efficiently and effectively and demonstrating how the information is used to support agency decisions.
Florida DOT
To ensure that the asset inventory remains current, the Florida DOT assigns district personnel responsibility for maintaining asset inventories and establishes guidance that no data in the inventory can be more than five years old. For new construction projects, it is required that the inventory be updated within 90 days of completion. The Florida DOT district offices develop a Quality Control (QC) plan and perform a QC check on the data at least once a year. The Florida DOT Central Office develops a Quality Assurance Review (QAR) plan and performs a QAR on the district’s QC process and spot checks the data in the field. As a result of these requirements, the Florida DOT has a high degree of confidence in the numbers used for budgeting activities.
Using Work History Information to Improve Models 6.4.3
The availability of current work history and performance data allows agencies to develop and improve models used in a management system to predict future conditions and determine treatment effectiveness. This section describes and illustrates the use of this data to improve existing models.
Developing and Improving Asset Deterioration Models
An important function of an asset management system is the ability to predict asset deterioration rates so changes in condition over time can be modeled for use in planning and programming activities. In the absence of data, models can be developed based on expert judgment, but as historical performance trends are established based on actual data, the expert models should be replaced by or calibrated against the real data.
The AASHTO Transportation Asset Management Guide: A Focus on Implementation (2011) introduced the following thought process to help an agency evaluate their deterioration models and determine whether improved data is needed to enhance future forecasts:
- If there is disagreement with the timing for recommending a treatment, what is the difference? Does a difference of one to two years make a substantial difference to the program? This type of difference is typically the result of the program optimization models.
- If there is disagreement with the treatment, are the differences substantial, such as deck repairs versus bridge replacement? These differences are often the result of treatment rules but may indicate that deterioration rates are not correct. The deterioration model parameters may need to change (e.g., change traffic considerations or geographic location) or there may have been some work performed that the model is not aware of.
- If the differences are irreconcilable, the agency may decide to investigate the model setup and analysis further or may conduct research to see how other agencies have resolved similar issues.
Determining Treatment Effectiveness
The availability of work history and performance data also makes it possible to determine the effectiveness of different types of treatments over time. By adding cost information to an effectiveness analysis, an agency can determine the long-term cost-effectiveness of different treatment strategies.
North Carolina DOT
The North Carolina DOT conducted an analysis to determine the effectiveness of an open-graded friction course and a surface constructed with a FC-2 (friction course) gradation. Data from the pavement management database was used, including inventory data, construction information and pavement condition ratings. The performance data were plotted against the survey year for each pavement section where one of the two types of surface friction courses was applied. The results showed the performance of the open-graded friction course dropped at year 10, while the FC-2 graded surface dropped in performance at year 8. The study also found that all FC-2 sections had received another treatment by year 11. The results from the analysis were used to increase the use of open-graded friction courses across the state.
South Dakota DOT
In 2011, the South Dakota DOT initiated a project to revise the pavement deterioration models developed in 1997 using 17 years of historical pavement condition data. The tool for developing the models included features allowing all the condition-versus-age data points for each pavement meeting the family description (based on surface type and pavement structure) to be plotted on a graph, facilitating a comparison of the historical model and the recommended model based on the updated pavement condition information. In this example, the blue line (labeled as the user-defined model) represents the model being used in the pavement management system for predicting faulting on a thick, short-jointed doweled concrete pavement and the gold line (labeled as the regression equation). The regression analysis on the historical data, represented by the red data points, indicates faulting is occurring at a much more accelerated rate than was previously predicted. As a result, recommendations for addressing faulting were likely lagging the actual need observed in the field.
Illustration Showing How Historical Data can be Used to Modify a Deterioration Model
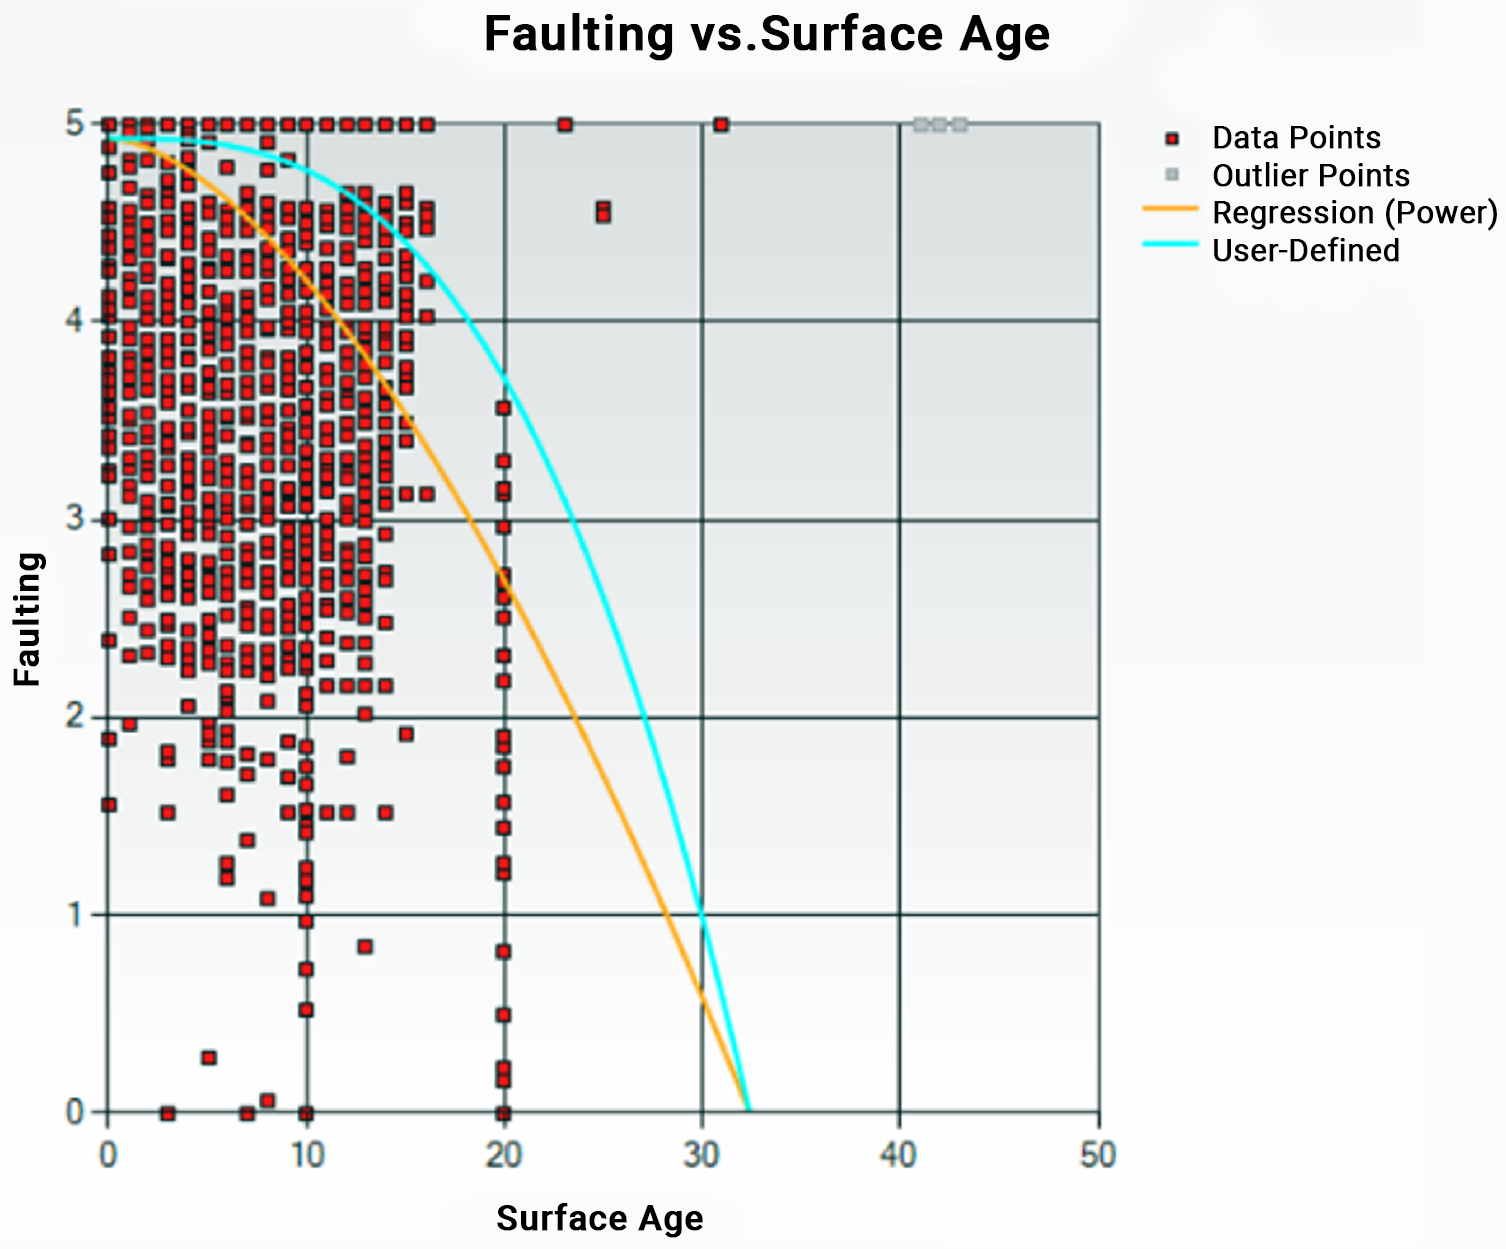
Source: South Dakota DOT. 2012. Technical Memo/Software Documentation
New Zealand Transport Agency
The Auckland Harbour Bridge corrosion protective coating system has been undergoing regular maintenance since the bridge opening in 1959. Historic practice was to spot abrasive blast corroded surfaces followed by spot painting and applying a full overcoat. While this process was effective in maintaining the protective coating, it also resulted in significant amount of contaminates being discharged into the Waitematā Harbour despite of the precautions being taken.
In an effort to reduce the discharge, various options have been considered taking into account the protective coating performance and longevity, with the aim to achieve the lowest practicable environmental discharge and whole of life costs.
One option involved collecting the abrasive blasting removal of the coating via the use of full scale containment to capture contaminants. However, it was found that this option would require strengthening of the bridge to safely carry the containment under wind loading at a cost of NZ$65M over a 10-year period.
As such, by undertaking a comprehensive review of the coating maintenance, a 40 years Coatings Maintenance Plan was developed. The identified lowest whole of life solution involved:
- On the land spans, use of full containment (where it could be supported from the ground), allowing for the full removal of the coating system via abrasive blasting, and its full reinstatement. These spans are to be left as long as possible before reinstating the protective coating, while ensuring minimal, if any section loss, to the steel superstructure.
- Spot repair and overcoating of other spans to maintain the existing coating for as long as practicably possible. A more proactive intervention approach is also adopted while using abseil techniques to minimise access costs.
- An outcomes based approach for consenting purposes that involved the establishment of low level discharge limits for contaminants deemed to be environmentally safe. This enables small areas of abrasive blasting without full containment for spans other than above land.
Thus, allowing for the continued corrosion protection of the bridge 125,000m2 external surface areas in a marine environment, while providing a cost effective and environmentally responsible solution.
Source: https://www.icevirtuallibrary.com/doi/abs/10.1680/jbren.18.00051
Toronto Transit Commission
The Toronto Transit Commission initiated a review to determine optimal bus life for their fleet as well as assess the potential for hybrid propulsion technology. Through specialized modelling methods, a data-driven approach was used to assess the total cost of ownership (TCO) for their fleet vehicles. This review analyzed historical asset work order records along with other capital and operating expenses to help identify the optimal asset life cycle. The four key areas analyzed were:
- Procurement/Installation: Asset Design Specifications & Procurement Cost
- Operations & Maintenance: Labor, Parts, Fuel (if applicable), Consumable Items and Outsourced Work
- Overhaul/Rehabilitation: Major Asset Refurbishment/Component Replacement Cost (ex. Transit Bus Transmission Rebuild or Facility Rehabilitation)
- Disposition: Salvage Value (End-of-Life)
The model provided insights on when the optimal time to dispose of a fleet vehicle to minimize overall fleet cost, the comparative TCO of different vehicle types, and the relative effect and up-time benefit gained for different operations and maintenance activities or rehab treatments, by engine or other component types used in the fleet. They advanced their understanding of treatment effectiveness and allowed them to make more informed decisions about fleet renewal.
Washington State DOT
The Washington State DOT conducted a pavement life cycle analysis using performance and cost data that demonstrated the cost-effectiveness of its pavement preservation projects. Based on the results that are documented in their Transportation Asset Management Plan (https://www.wsdot.wa.gov/sites/default/files/filefield_paths/WSDOT_TAMP_2019_Web.pdf), the DOT instituted a “one touch policy” requiring all capital projects to have had at least one pavement maintenance treatment by Maintenance or contracted work forces before it can be programmed for a pavement preservation project. This has enabled the DOT to defer capital improvements on pavements by two to three years, or in instances of multiple touches, by four to six years at a very low cost. In 2018, the agency received an additional $6 million to test a similar program on bridges. In addition to being a cost-effective use of available funds, the programs have helped build buy-in among maintenance personnel by demonstrating the importance of the data they collect.
Monitoring TAM Processes and Improvements 6.5.2
As discussed throughout this Guide, TAM is an on-going process that needs to be monitored regularly to ensure that it continues to support an agency’s business decisions. This section presents tools and methodologies used to accomplish this. It also builds on the application of some of the tools introduced in section 2.5.1, Assessing Current Practice.
Gap Assessment
A gap assessment is used to identify differences, or gaps, between an agency’s practices with those suggested as part of an established asset management framework. The results of a gap assessment can be used to identify changes in business processes that are needed or can serve as the basis for developing priorities as part of an asset management implementation plan. The gap analysis tool available through the AASHTO TAM Portal is an example of a tool that can be used by an agency to assess practices so they can be compared to desired, or more established, practices. A summary of the gap analysis tool and other frameworks for assessing current practice was presented in Figure 2.6. An example of a chart showing targeted and current ratings in eight assessment areas over a 2-year period is presented in Figure 6.6. While the agency’s targeted, or desired, scores remained consistently at a rating of 5 over both years, the graph is helpful for determining what assessment areas have improved over the 2-year period and which have not.
Figure 6.6 Example Comparing Assessment Area Scores from Two Different Rating Periods
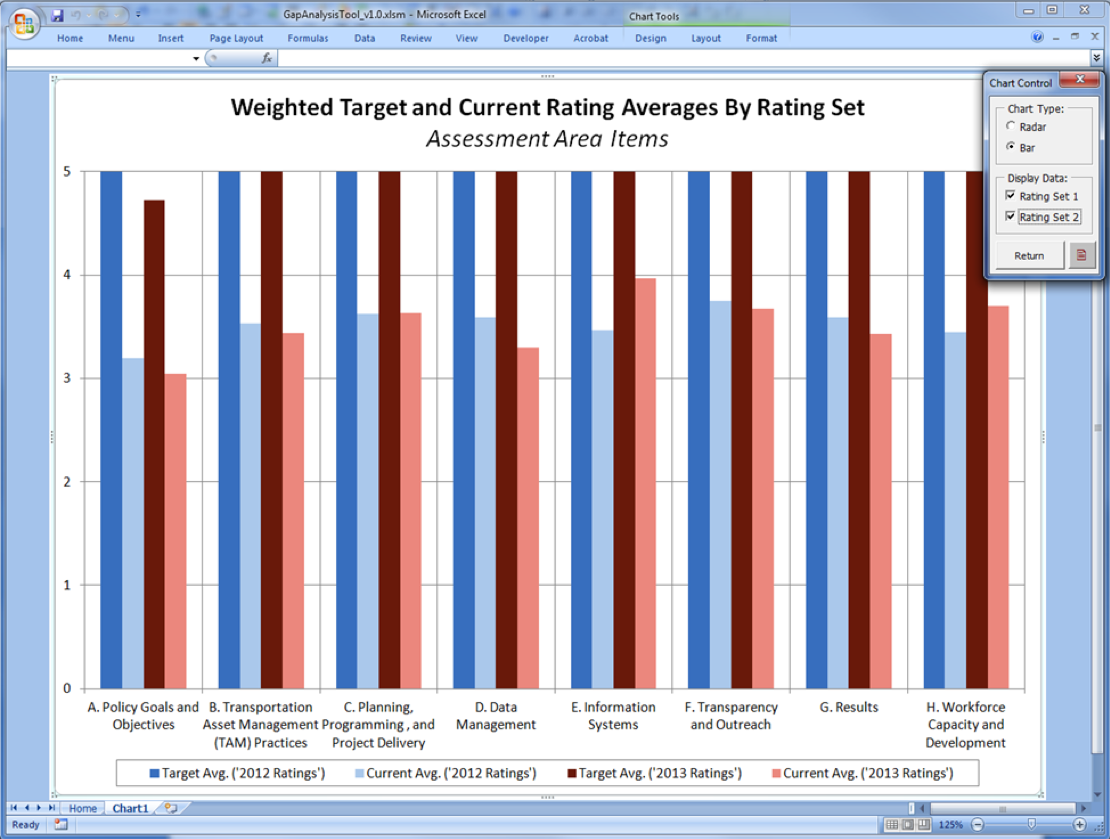
Source: AASHTO. 2015. Transportation Asset Management Gap Analysis Tool User Guide
TAM Webinar #29 - Process Improvements
Lean Six Sigma
A lean six sigma framework uses statistical analyses as part of a continuous improvement approach to evaluate the cause of defects and methodically make improvements to processes to eliminate them. Six sigma is widely used in manufacturing sectors, but can also be applied to many TAM functions. For instance, a six sigma analysis would be useful in analyzing the root cause of defects associated with a poorly-performing asset. Combining a six sigma approach with a Lean framework, which focuses on reducing waste, can help agencies develop more efficient and sustainable processes.
New Brunswick DTI
The New Brunswick Department of Transportation and Infrastructure (NB DTI) implemented Lean Six Sigma to better understand and document existing practices and identify where improvements could be implemented for savings or service improvement. The Lean Six Sigma methodology helps to improve performance through a collaborative process that systematically removes waste and reduces variation while improving customer satisfaction. For NBDTI, the application of this methodology has resulted in increased efficiency, cost savings, refined procurement methods, improvements to delivery of operational programs and services, and has supported the application of asset management decision-making to pavements, bridges, culverts, facilities and other transportation infrastructure.
ISO 33000 Process Assessment
The International Organization for Standardization (ISO) has introduced a variety of processes to support Asset Management. ISO 33000 is a standard for Process Assessment, providing a structured approach to help agencies better understand their processes, evaluate the suitability of their existing practices, and to determine the suitability of another organization’s processes as a way of improving practices.
TAM Webinar #63 - Consistency Reporting
The Balanced Scorecard
The Balanced Scorecard approach was initially developed to enable organizations to make complex tradeoff decisions that balanced different types of performance criteria. For example, the framework could be used to help determine the tradeoff between improving the level of service provided in a corridor with improving environmental sustainability on a statewide basis. The balanced scorecard analysis takes a holistic and balanced approach to these types of issues, by simultaneously evaluating competing and dissimilar needs (such as Customer Satisfaction, Sustainability, and Safety). The advantage to the balance scorecard approach is the fact that multiple measures are considered, rather than a single set of measures that might disregard an important factor in the decision. The results produce a rational set of investment decisions that considers all of the factors that the agency views as most important to the final selection.
Practice Examples:
British Columbia
Alignment Between Policies, Investments, and Practices
To support the alignment of agency policies, objectives and day-to-day practices, the Province of British Columbia established the tiered…
Minnesota DOT
Minnesota's Performance Management System
The Minnesota DOT’s performance management system consists of clear policies, performance trend data and performance forecasts to guide…
Clackamas County DOT
TAM Strategy: Implementing Actions to Close the Gap
Based on their gap assessment, Clackamas County Department of Transportation and Development established a Transportation Asset Managemen…
New Zealand Transport Agency
Monitoring TAM Program Improvements
The New Zealand Treasury stewards the NZ government’s Investment Management System to optimize value from new and existing investments …
Wyoming DOT
WYDOT is increasing the use of performance-based project selection in order to optimize funding expenditures and meet their performance t…
Colorado DOT
Change Management Success Factors
Colorado DOT’s (CDOT) change management program seeks to “help all members of Team CDOT be successful with each and every change whic…
New Brunswick DTI
Application of Lean Six Sigma to Manage TAM Skeptics
Despite a long history and legacy of existing practices and a strong internal institutional resistance to change, New Brunswick Departmen…
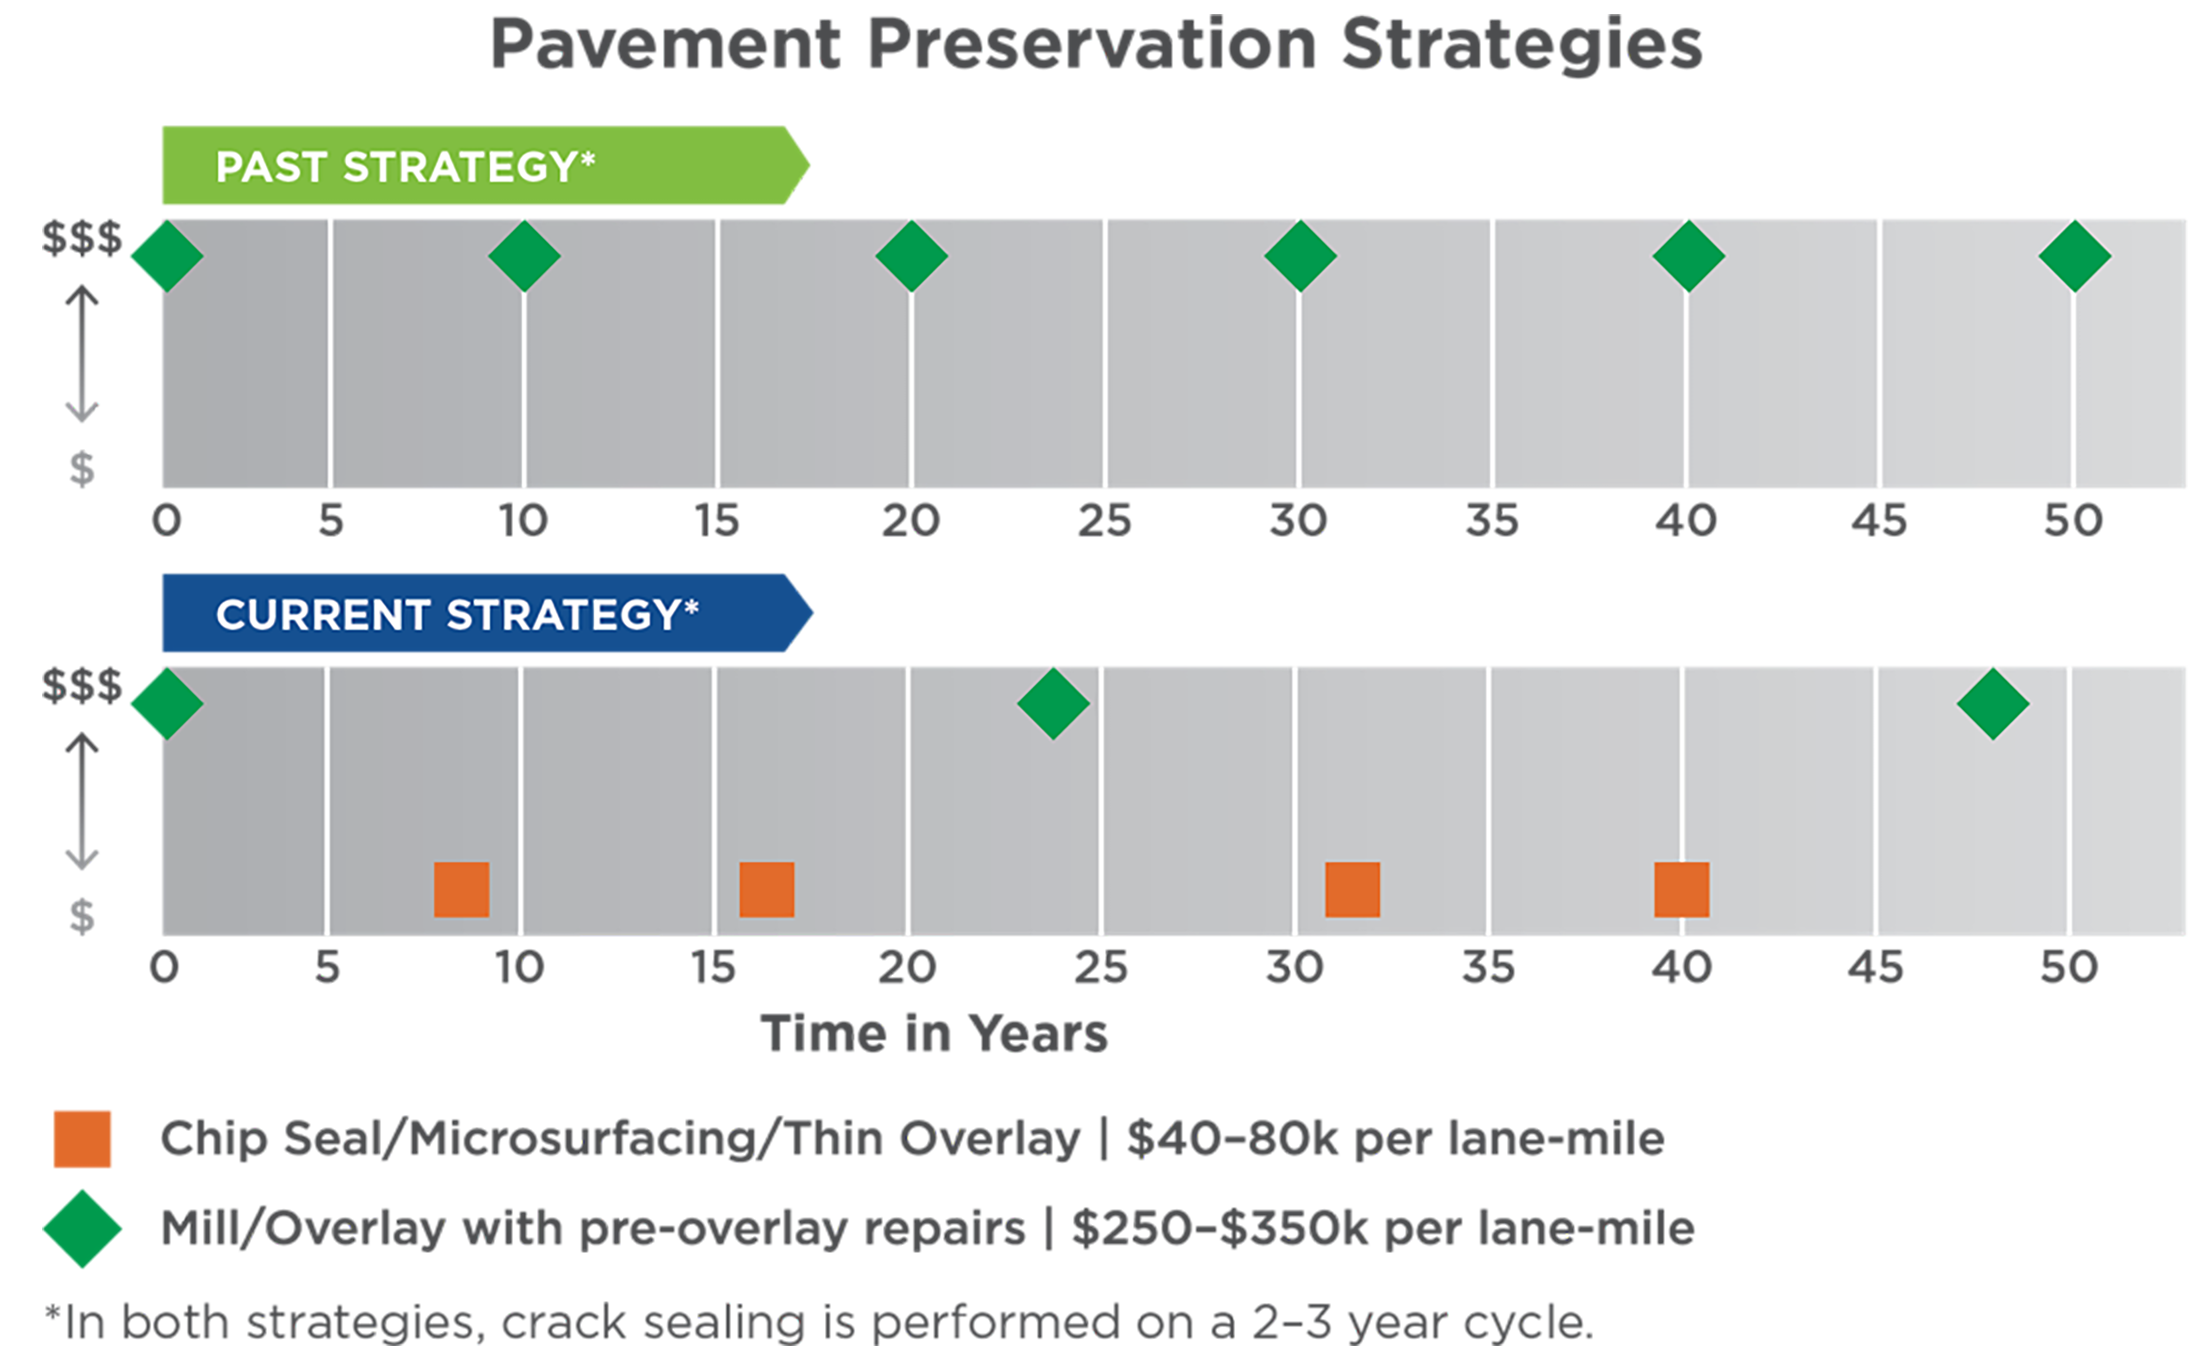
Ohio DOT
Use of a Pavement Management System to Establish a Life Cycle Strategies
As required under MAP-21, Ohio DOT conducted a risk assessment to identify the most significant threats and opportunities to its pavement…
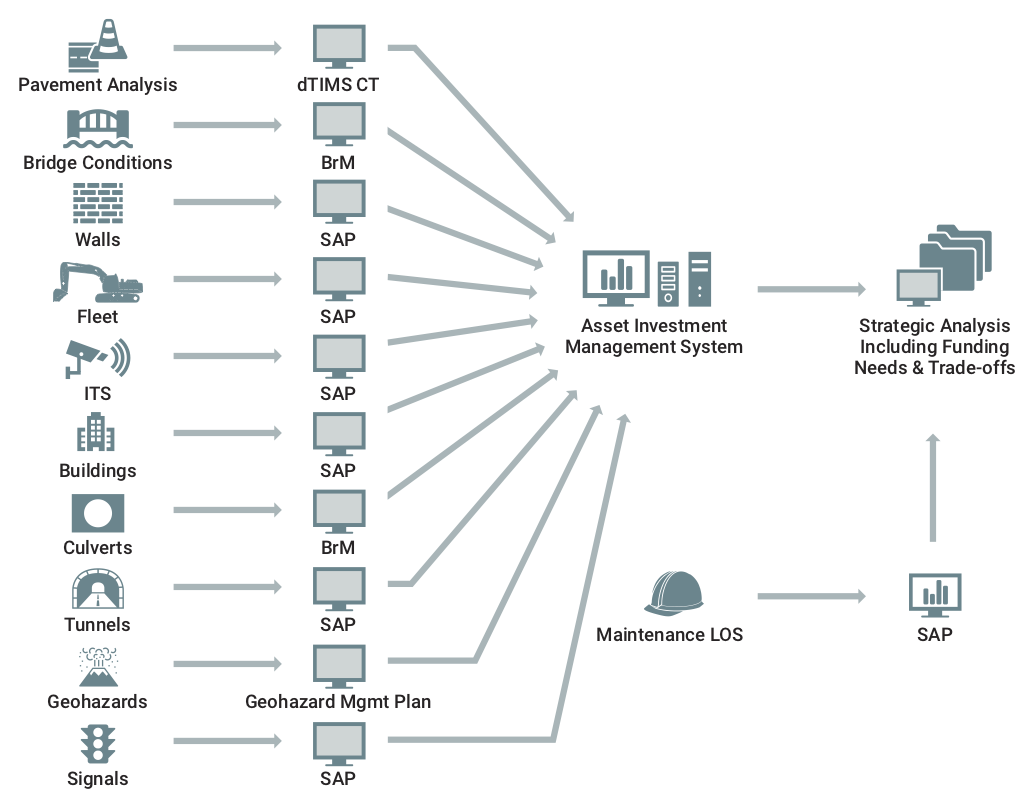
Colorado DOT
Use of Performance Targets to Support Resource Allocation
The budget-setting process used by CDOT and described in its 2018 TAMP is an example of a resource allocation process emphasizing use of …


Washington State DOT
Gray Notebook: Quarterly Performance Report
Washington State DOT (WSDOT) uses asset value-related performance measures for pavement assets to support responsible management of those…
Department of Transport and Planning
Melbourne Asset Management Plan
The City of Melbourne, the capital of the Australian state of Victoria, uses asset value to drive asset management in two ways:
Fi…
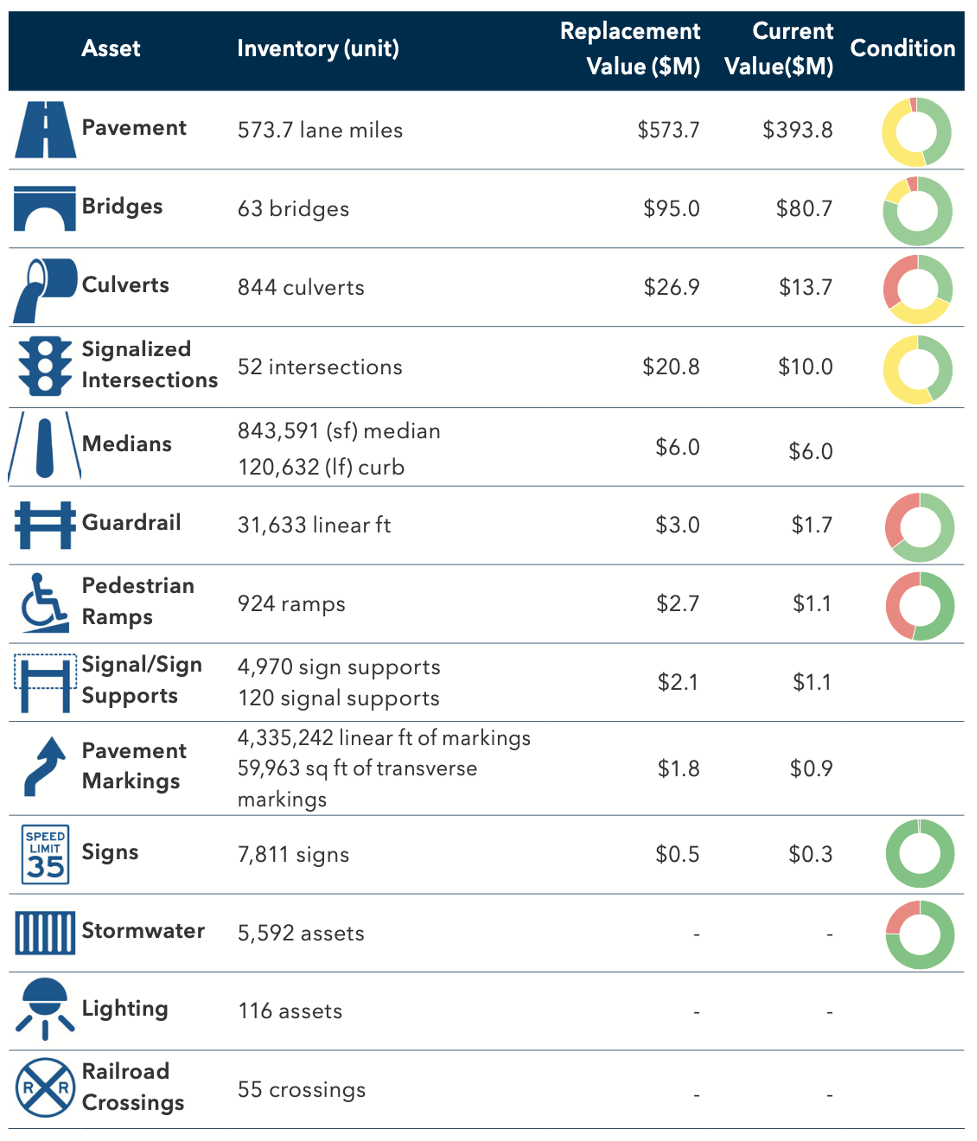
Carver County Public Works
Carver County, located in the Minneapolis-St. Paul metropolitan area, is responsible for managing a variety of transportation assets, inc…
Practices:
Levels of Service
- Customers are identified, but outreach is not formalized.
- Some technical levels of service or KPIs are defined and considered when intervention alternatives are being evaluated.
- Customer groups are defined and some communication practices are in place to assess wants.
- KPIs are established, but may not be tightly tied to business decisions.
- Maintenance levels of service are established, but there is not a tight connection to KPIs.
- Technical levels of service are defined, and measured to evaluate the effectiveness of past investment and operational decisions.
- Customer groups are defined and clear policies and procedures are in place to assess wants.
- Customer-based KPIs and maintenance levels of service are established at the strategic, tactical, and operational levels.
- Agency performance is routinely measured and reported to all internal and external stakeholders.
Managing Assets for their Life Cycle
- Alternative management strategies are considered for high value/critical asset classes in the portfolio and selected based on efficiency and effectiveness of the transportation network.
- Asset reliability is qualitatively considered in a systematic way for some asset classes.
- Reactive and interval-based approaches that are based on risk assessments are used where appropriate.
- Management strategies are periodically re-evaluated to determine if a change in management practice would be more effective.
- Deployment of maintenance crews, capital projects, and network operation resources are coordinated to ensure the right interventions are occurring in the right locations, at the right time on the transportation network to deliver mobility service levels at an acceptable cost and level of risk.
- Appropriate condition, interval and reactive based management strategies have been established for most asset classes.
- Asset reliability is well understood and is aligned with risk tolerance in the agency.
- Assets are planned, acquired and managed with an awareness of the costs, risks, and service performance characteristics over the entire life cycle.
- Appropriate management strategies are established and periodically re-evaluated to determine if a change in management practice would be more effective.
- Deployment of maintenance crews, capital projects, and network operation resources are coordinated to ensure the right interventions are occurring in the right locations, at the right time on the transportation network to deliver mobility service levels at an acceptable cost and level of risk.
- Appropriate condition, interval and reactive based management strategies have been established for every asset class in the portfolio, to support management of the transportation network efficiently and effectively.
- Asset reliability is well understood and is aligned with service expectations and risk tolerance in the agency.
- Strategic, tactical and operational activities directly consider alternatives that balance service delivery and investment of resources.
- Reactive and interval-based approaches that are based on risk assessments are used where appropriate.
- Management strategies are periodically re-evaluated to determine if a change in management practice would be more effective.
- Deployment of maintenance crews, capital projects, and network operation resources are coordinated to ensure the right interventions are occurring in the right locations, at the right time on the transportation network to deliver mobility service levels at an acceptable cost and level of risk.
Performance Measurement and Management
- Some key performance measures are established within the organization and are beginning to be measured.
- Performance measures are periodically reviewed and enhanced over time.
- Regular reporting of progress with trends tracked over time.
- Performance measures are established within the organization and provide a strong linkage between agency objectives and the processes for capital decisions.
- Regular reporting of progress with clear trends indicating improvement.
- Performance measures are well established within the organization and provide a strong linkage between agency objectives and the processes for capital and operational decisions.
- Performance measures are directly used to prioritize investment needs.
- Regular reporting of progress with clear trends indicating significant improvement over time.
Monitoring the State of Assets
- Asset data collection and management is in transition to better support timely and accurate performance reporting.
- The performance measurement framework is evolving to improve goal alignment and trend the agency to desired outcomes.
- Asset data collection and management supports performance reporting.
- Periodic review of performance measurement framework is carried out to confirm measures are appropriate, aligned with objectives and suitable to trend the agency to desired outcomes.
Monitoring Funding and Resource Allocation Methods
- Trend analysis is employed by the agency to help identify potential adjustments to improve performance targets.
- Trend analysis and other analytical tools are being trialed by the agency to help identify potential adjustment actions to improve performance.
- Current status is understood by all internal stakeholders, and resource allocation in some departments is supported by informed decision-making.
- Trend analysis, performance forecasting and other analytical tools are employed by the agency to help identify potential adjustments to operational, tactical or strategic actions to help achieve performance targets.
- Current status is understood by all internal and external stakeholders, and resource allocation is supported by informed decision-making.
Information and Systems
- Agency information systems are unintegrated, however the current portfolio of systems are well mapped, and an improvement plan is in progress to improve integration toward a clearly defined future state that is suited to agency requirements.
- Agency information systems are partially integrated, interconnected and a plan is being implemented to create a system that is suited to agency requirements.
- Agency information systems are fully integrated. Systems supporting inventory management, data warehouses and statistics, inspections and condition assessments, maintenance management, performance modeling, analytics, forecasting and financial systems are interconnected and are suited to agency requirements.
How To Guides:
Building a Stronger TAM Organization
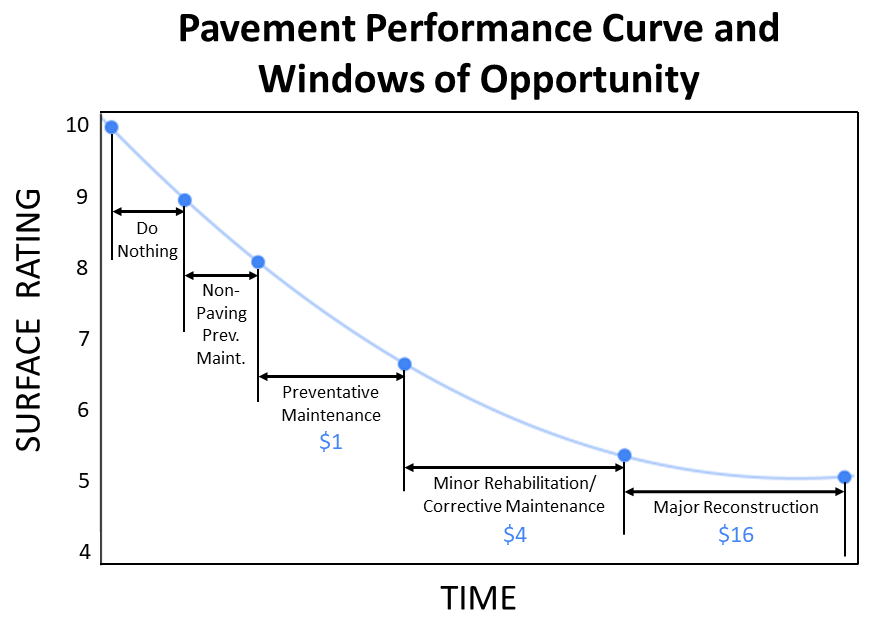
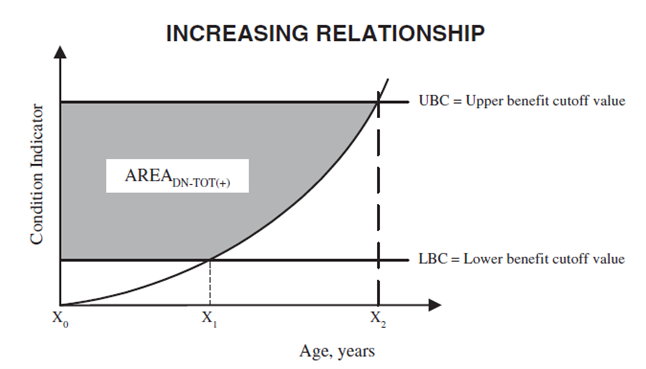
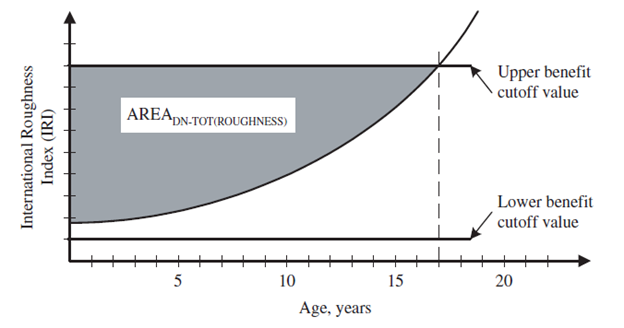

How to Optimize Treatment Timing
Implement a Multi-Objective Decision Analysis (MODA) Approach

Benchmarking Performance Using the FHWA's TPM Dashboards
Selecting a Method for Setting Effective Performance Targets
Benchmark Performance
Perform a Data Management Maturity Assessment
Evaluate Current Maturity to Support BIM and Identify a Future Target
Perform a TAM Data Value Assessment
Checklists:
Characteristics of Strong Performance Measures for Managing the Condition of Ancillary Assets
Making Effective Targets - Tips for Success
June 1, 2006 | Prosci Learning Center Publications
Details the ADKAR Model, a tool for planning change management activities. Outlines the goals and outcomes of successful, wide-spread change.
External Link: https://www.prosci.com/adkar/adkar-model
June 1, 2003 | John Wiley & Sons, Inc.; 2nd Edition
The Balanced Scorecard is a methodology for implementing performance management systems and improving efficiency. Focusing directly on the public and not-for-profit sectors, this book helps these organizations overcome the unique challenges they face when implementing a Balanced Scorecard.
External Link: https://www.wiley.com/en-us/Balanced+Scorecard+Step+by+Step+for+Government+and+Nonprofit+Agencies-p-9780471475446
August 2, 1996 | Harvard Business Review Press
The Balanced Scorecard translates a company's vision and strategy into a coherent set of performance measures. The four perspectives of the scorecard--financial measures, customer knowledge, internal business processes, and learning and growth--offer a balance between short-term and long-term objectives, between outcomes desired and performance drivers of those outcomes, and between hard objective measures and softer, more subjective measures.
External Link: https://hbr.org/product/the-balanced-scorecard-translating-strategy-into-action/6513-HBK-ENG
April 15, 2018 | Mango Publishing
This book provides a step-by-step approach to transforming governmental organizations and provides valuable insights into change management, strategic planning, and thriving workplace cultures.
External Link: https://mango.bz/books/building-a-winning-culture-in-government-by-patrick-r-leddin-and-shawn-d-moon-376-b
May 11, 2022 | Pipefy, Isabelle Salemme
Guide to process management. Describes best practices such as the Lean Six Sigma model, and explains how to create process maps (workflow diagrams).
External Link: https://www.pipefy.com/blog/process-mapping/
February 1, 1992 | Harvard Business Review
This resource provides a framework for performance management, challenging conventional strategies developed for assessing performance measurements. The "Balance Scorecard" method includes both financial and operational measures, creating a more accurate and holistic evaluation of efficiency.
External Link: https://hbr.org/1992/01/the-balanced-scorecard-measures-that-drive-performance-2
March 19, 2004 | AASHTO
This guide links together, using strategic performance measures, strategic planning and performance measurement to translate organizational vision into a small group of measurable, meaningful, and accurate performance measures.
External Link: https://trid.trb.org/View/696635
September 1, 2010 | Transportation Research Board
Measuring Transportation Network Performance explores ways to monitor transportation network performance by developing new or integrating existing performance measures from different transportation modes and multiple jurisdictions.
External Link: https://nap.nationalacademies.org/catalog/14425/measuring-transportation-network-performance
January 1, 2019 | Transportation Research Board
Benchmarking and Comparative Measurement for Effective Performance Management by Transportation Agencies presents guidance and examples for selection of peer groups to ensure that benchmarking is effectively applied to enhance transportation system performance.
January 1, 2010 | Transportation Research Board
A Methodology for Performance Measurement and Peer Comparison in the Public Transportation Industry explores the use of performance measurement and benchmarking as tools to help identify the strengths and weaknesses of a transit organization, set goals or performance targets, and identify best practices to improve performance.
External Link: https://www.nap.edu/catalog/14402/a-methodology-for-performance-measurement-and-peer-comparison-in-the-public-transportation-industry
April 14, 2023 | FHWA
This website serves as a central database for FHWA resources surrounding the topic of Transportation Performance Management.
External Link: https://www.fhwa.dot.gov/tpm/
September 30, 2015 | Transportation Research Board
The objective of Communicating Performance Management—State DOTs Continuing to “Tell Their Story” is to provide a resource base for guiding state departments of transportation (DOT) performance management (PM) and communications professionals in communicating transportation system performance. The hope for this resource is to advance PM communications practices, particularly with respect to Moving Ahead for Progress in the 21st Century (MAP-21) reporting requirements.
External Link: http://onlinepubs.trb.org/onlinepubs/nchrp/docs/NCHRP20-24(93)B02_FR.pdf
August 22, 2023 | Metropolitan Transportation Commission
Vital Signs is an interactive website by MTC and the Association of Bay Area Governments (ABAG) that offers data, visual representations of that data and written explanations about important trends in the Bay Area.
External Link: https://mtc.ca.gov/tools-resources/vital-signs
January 10, 2022 | Transportation Research Board
Research and practice in the areas of transportation performance, risk, and asset management have added to the tools, methods, and strategies available to state departments of transportation and other transportation agencies. Fundamentally changing the culture of a transportation agency and integrating those changes into historically siloed management practices requires the earnest focus of the entire organization, including participation of practically every individual.
External Link: https://www.trb.org/Publications/Blurbs/182511.aspx
July 1, 2019 | FHWA
This paper by the FHWA Transportation Asset Management Expert Task Group (TAMETG) builds upon an earlier paper produced in 2012 by the American Association of State Highway and Transportation Officials (AASHTO/Cambridge Systematics). That paper addressed how, in general, asset management and performance management are linked. This paper seeks to build upon that earlier work and explores how the specific regulations in 23 CFR 450, 490, and 515 support a performance-based asset management approach nationally.
External Link: https://rosap.ntl.bts.gov/view/dot/67127
January 1, 2021 | Transportation Research Board
Prioritization of Public Transportation Investments: A Guide for Decision-Makers provides practical advice for transportation agencies looking to improve their prioritization practice for public transportation projects.
External Link: https://nap.nationalacademies.org/catalog/26224/prioritization-of-public-transportation-investments-a-guide-for-decision-makers
January 1, 2018 | Transportation Research Board
Investment Prioritization Methods for Low-Volume Roads documents current practices used by transportation agencies to make investment decisions about low-volume roads.
External Link: https://nap.nationalacademies.org/catalog/25142/investment-prioritization-methods-for-low-volume-roads
January 1, 2022 | Transportation Research Board
Integrating Effective Transportation Performance, Risk, and Asset Management Practices is designed to be a process framework that is resilient to the expected evolution of an agency as it matures in its management integration.
External Link: https://www.trb.org/Publications/Blurbs/182511.aspx
December 30, 2022 | Transportation Research Board
Guide to Effective Methods for Setting Transportation Performance Targets, from TRB's National Cooperative Highway Research Program, is designed to help state DOTs and metropolitan planning organizations identify effective methods for setting transportation performance targets based on established national measures.
External Link: https://apps.trb.org/cmsfeed/TRBNetProjectDisplay.asp?ProjectID=4788
June 28, 2017 | FHWA
This resource defines and positions terminology used when discussing the concept of asset sustainability.
External Link: https://www.fhwa.dot.gov/planning/processes/statewide/practices/asset_sustainability_index/page01.cfm
November 16, 2018 | EDP Sciences
The present paper reports different applications which have a common data source: Automatic Road Analyzer (ARAN) of the Transport Infrastructure Laboratory of the University of Catania. Data surveyed with ARAN were used to develop performance indicators of the road asset, as well as develop a BIM model.
December 31, 2020 | FHWA
This resource includes all the implementation plan activities with scheduled completion dates between 2018 and 2020. There are 38 of these activities in the plan, 37 of which are completed.
External Link: https://www.fhwa.dot.gov/tpm/plan/
June 1, 2018 | FHWA
National Performance Measures for Congestion, Reliability, and Freight, and CMAQ Traffic Congestion: General Guidance and Step-by-Step Metric Calculation Procedures presents recommended steps for calculating the National Highway System performance metrics, the Truck Travel Time Reliability metrics, and the Peak Hour Excessive Delay metric.
External Link: https://www.fhwa.dot.gov/tpm/guidance/hif18040.pdf
July 1, 2019 | FHWA
This paper examines how the transportation asset management processes in 23 CFR 515, the transportation performance management processes in 23 CFR 490, and the planning requirements in 23 CFR 450 increase the linkage between asset management and performance management.
External Link: https://www.fhwa.dot.gov/asset/etg/pubs/whitepaper2.pdf
January 1, 2021 | TRB
Collaborative Practices for Performance-Based Asset Management Between State DOTs and MPOs documents DOT practices for collaborating with MPOs relative to target setting, investment decisions, and performance monitoring of pavement and bridge assets.
January 1, 2023 | Transportation Research Board
Guide to Effective Methods for Setting Transportation Performance Targets, from TRB's National Cooperative Highway Research Program, is designed to help state DOTs and metropolitan planning organizations identify effective methods for setting transportation performance targets based on established national measures.
External Link: https://nap.nationalacademies.org/catalog/26764/guide-to-effective-methods-for-setting-transportation-performance-targets
March 1, 2021 | Transportation Research Board
This white paper outlines, in simple terms, the fundamental concepts associated with the RSI framework. The document leads the reader through the basic process of RSI application and uses simple examples to illustrate how the RSI framework can be used to support investment decisions.
External Link: https://trid.trb.org/view/1833123
September 20, 2023 | FHWA
This resource summarizes the Federal Highway Administration (FHWA) report Development of Next Generation Pavement Performance Measures and connects the effort to a broader project to develop Performance Management Objectives. Furthermore, the resource describes key findings from the research and explores how they can be used to support agency decision-making strategies.
External Link: https://trid.trb.org/View/2259800
September 20, 2023 | FHWA
This TechBrief serves as a follow up to Next-Generation Pavement Performance Measures (FHWA-HRT-23-102). It outlines the Federal Highway Administration (FHWA) report Development of Next Generation Pavement Performance Measures and Asset Management in an ongoing effort to develop and refine Performance Management Objectives.
External Link: https://trid.trb.org/View/2259801
June 9, 2022 | FHWA
The purpose of the project is to identify, analyze, communicate, and deploy a set of leading indicators of transportation performance. The project will produce a report that shows how transportation agencies can deploy leading indicators to monitor and adjust performance measure targets for the national performance-measurement areas (including infrastructure condition), and lays out an approach that transportation agencies can use to identify, analyze, and select their own leading or lagging indicators to inform investment decision-making.
External Link: https://highways.dot.gov/research/rtportfolio/infrastructure-performance-management
January 1, 2022 | Transportation Research Board
Managing Performance to Enhance Decision-Making: Making Targets Matter offers a set of feedback enrichment strategies illustrated by case studies of how agencies are effectively incorporating people- and data-based feedback into decision-making on transportation issues ranging from long-term strategy development to medium-term program development to day-to-day operations.
External Link: https://nap.nationalacademies.org/catalog/26600/managing-performance-to-enhance-decision-making-making-targets-matter
January 17, 2017 | FHWA
The objective of this study is to identify or conceptually develop methodologies to enable full implementation of a comprehensive asset management plan, including trade-off analysis from a common ground among disparate assets that are traditionally individually assessed and managed. The proposed framework starts with the basic objectives and management concerns common to practically all highway agencies, using these as the foundation for a common set of cross-asset methodologies to support decision making in all of the fundamental business processes necessary to implement TAM Plans.
External Link: http://www.pdth.com/images/NextGenTAMphase1.pdf