7.4.3
Assessing Data Management and Governance Maturity
Data management and governance implementation can be viewed as a long term process of maturation. Several models and assessment tools are available to help agencies identify their current state, set goals for where they want to be, and create plans for moving up the maturity scale.
There are several different assessment tools tailored to DOT data programs that can be used or adapted as needed. In addition, several DOTs have created their own tools. Most of these tools are based on a maturity model.
A typical maturity model could include the following levels:
- Level 1-Initial
- Level 2-Repeatable processes
- Level 3-Defined and documented processes
- Level 4-Measured and managed processes
- Level 5-Optimizing processes (continuous improvement)
TIP
Use a maturity model to identify gaps, prioritize initiatives and track progress over time.
For TAM information and systems, maturity levels can be assigned to different aspects of data management and governance. Assessments can also be conducted at different levels of the organization – from the agency-wide level, to the level of individual information systems (or even data elements).
Figure 7.5 Example Maturity Model
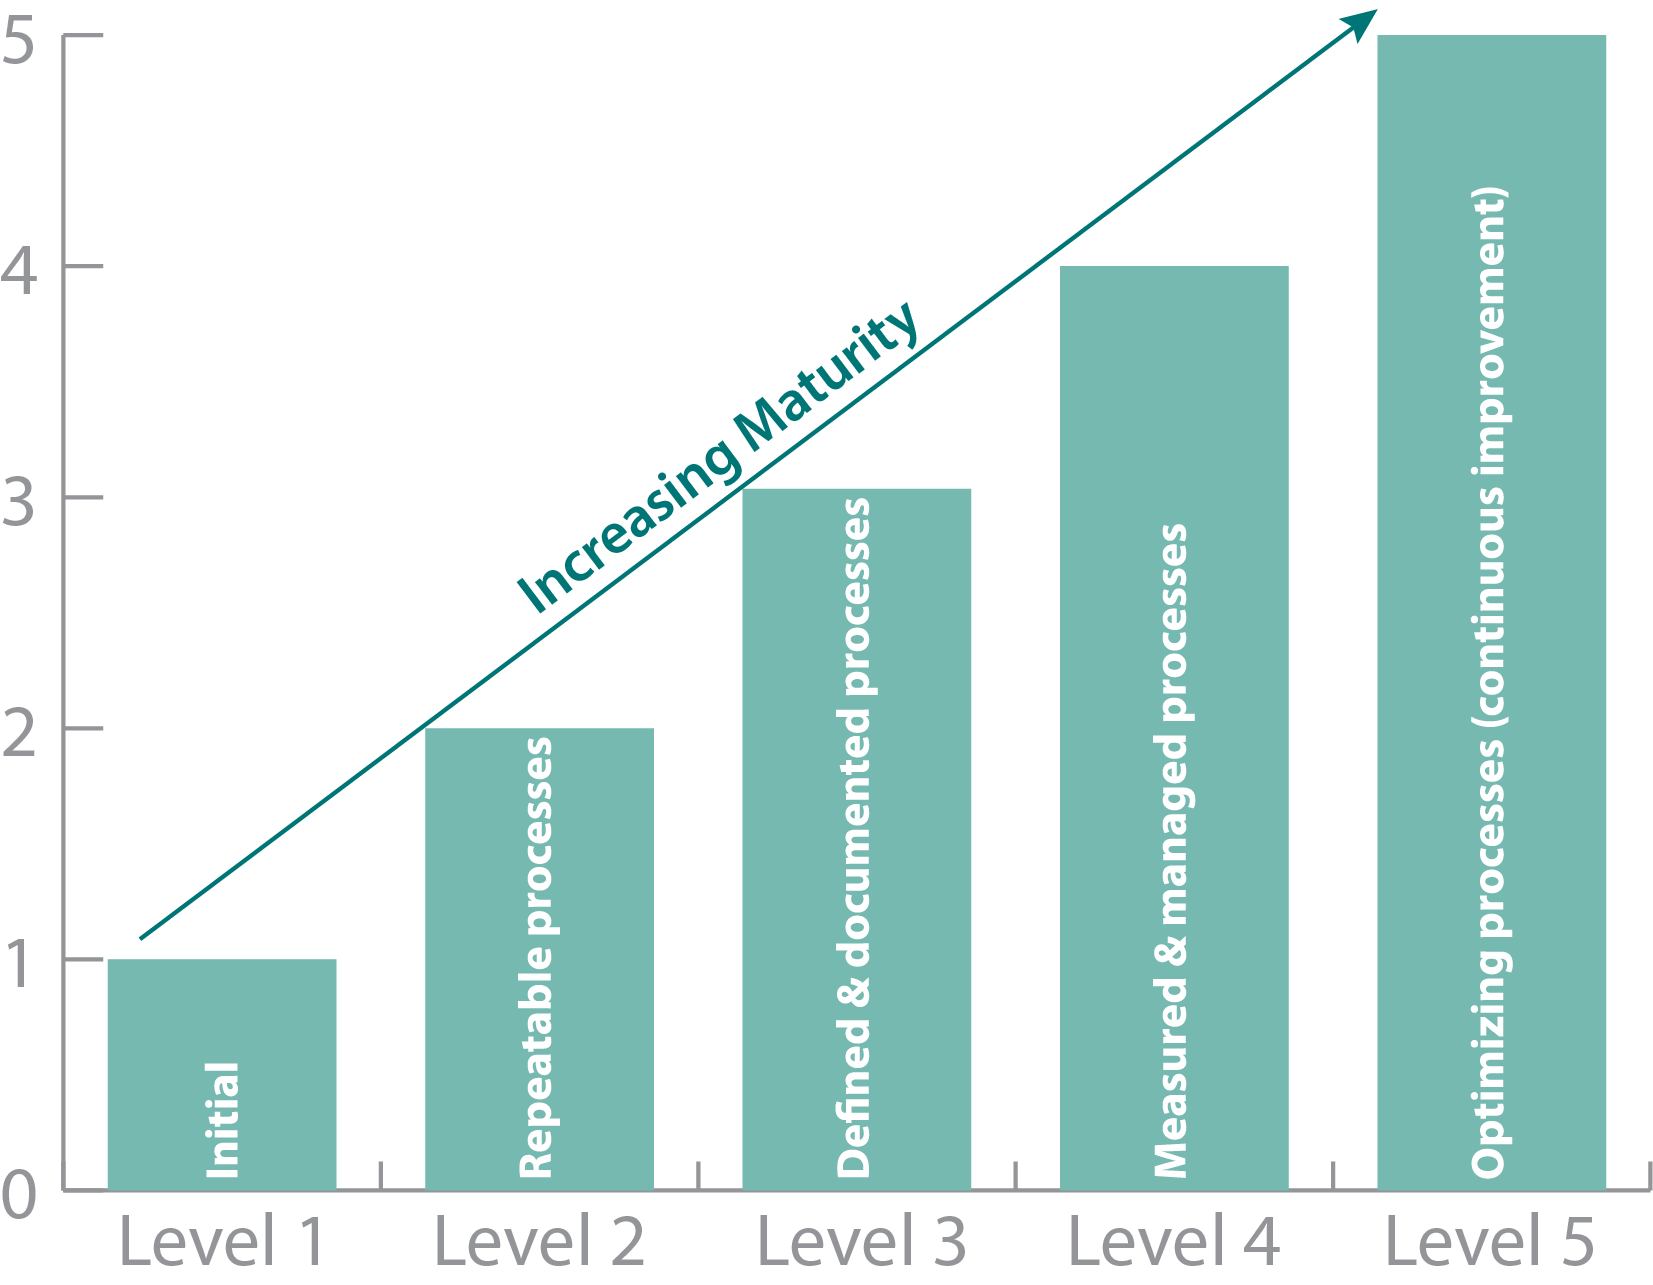
Table 7.6 shows the data management and information system-related assessment elements from the TAM Gap Analysis Tool, developed under NCHRP Project 08-90.
Table 7.6 - TAM Analysis Tool Assessment Elements
| Element | Sub-element | Sample Assessment Criteria |
|---|---|---|
Data Management| Asset Inventory |
| |
| Asset Condition and Performance |
|
|
| Data Governance |
|
|
| Information Systems | System Technology and Integration |
|
| Decision-Support Tools |
|
|
| System Features |
|
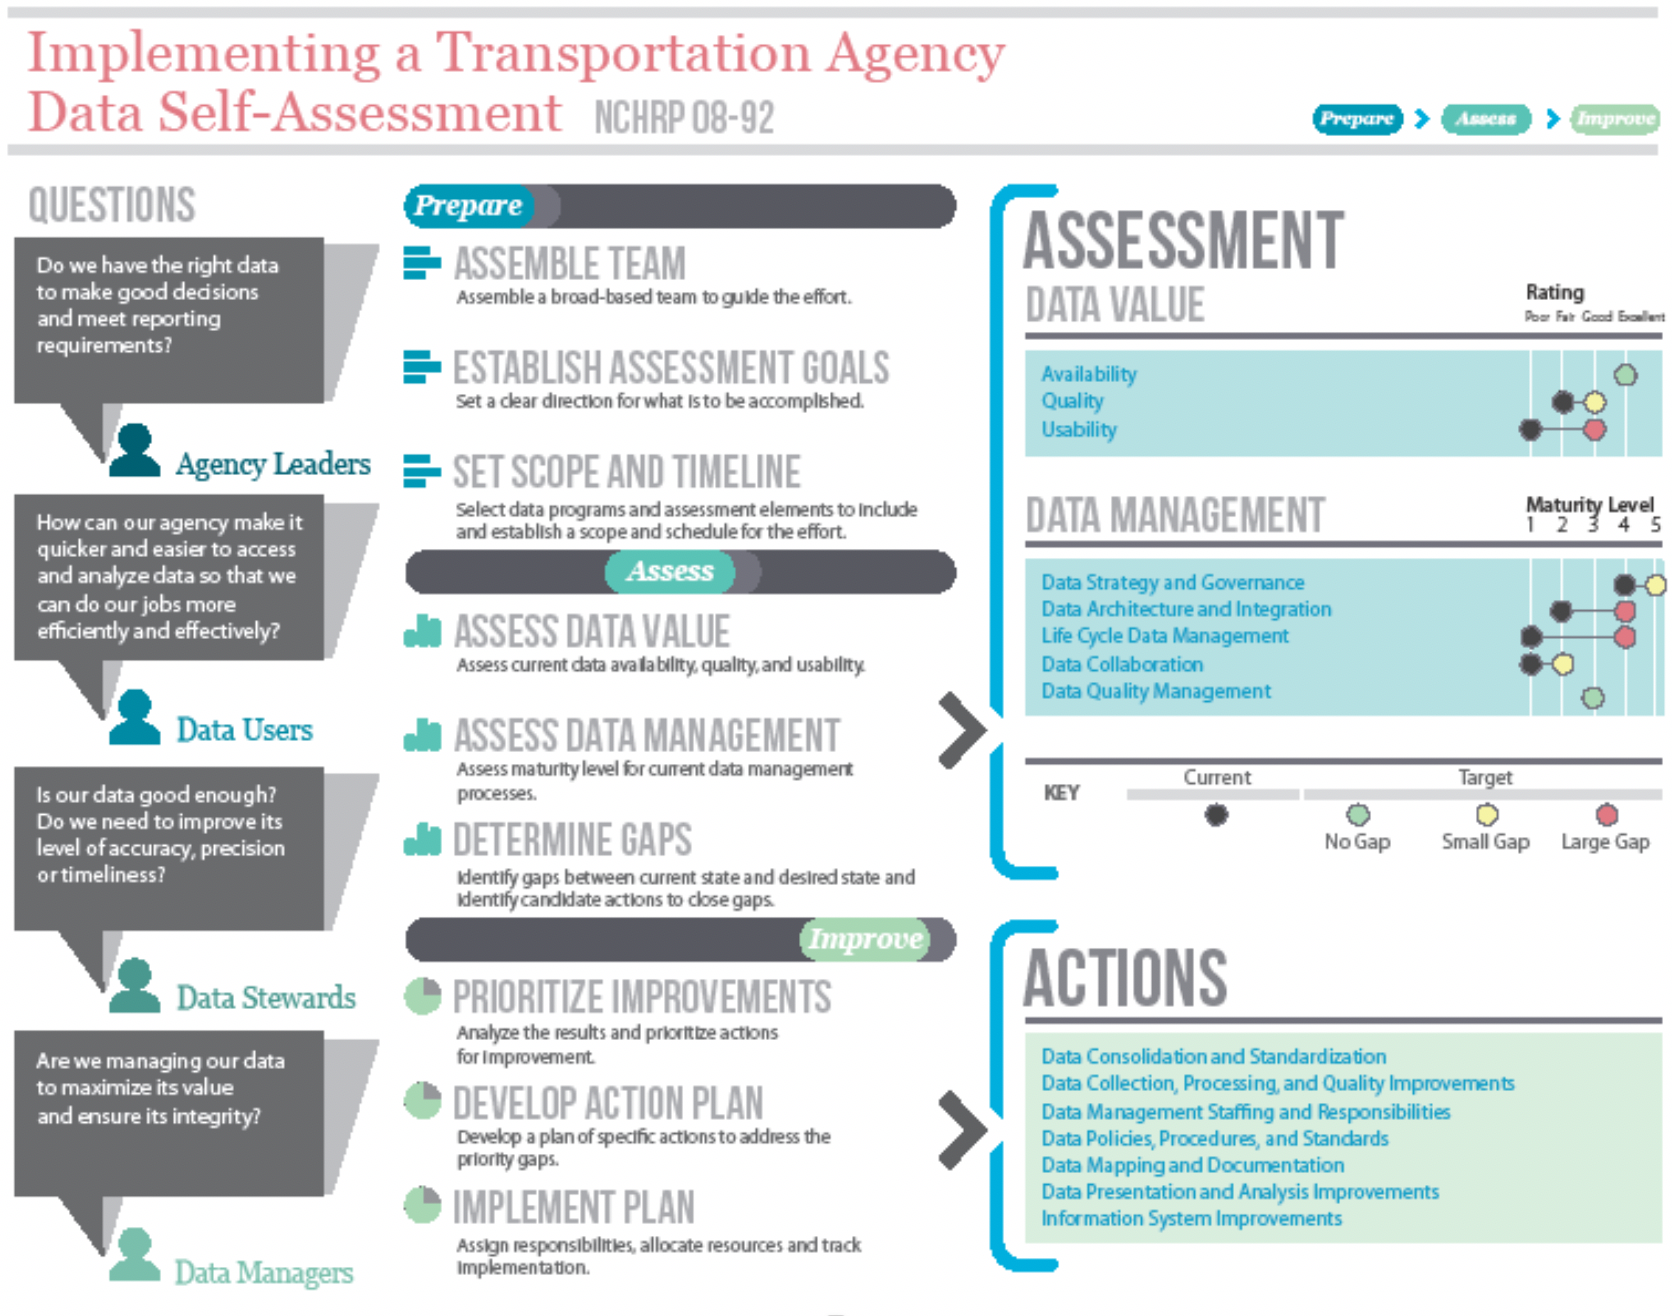
Figure 7.6 illustrates the data assessment guidance created under NCHRP 08-92. This process is suitable for application either at the agency-wide level, for an individual data program, or for a business process. It goes into greater depth than the TAM Gap Analysis Tool.
Figure 7.6 Folio Describing the Transportation Agency Data Self-Assessment Process
Iowa DOT
Iowa DOT conducted a detailed data maturity assessment for over 180 data systems. Assessments were based on a standardized questionnaire administered to data stewards and custodians. The questions covered data quality, availability of metadata, whether a data retention plan was in place, the degree to which data collection was automated, and several other factors. Charts were produced showing maturity scores for each system, with roll-ups at the division level. This tool helps the agency track their progress over time and identify specific data improvements to pursue.
Sample Data Assessment Summary Radar Chart
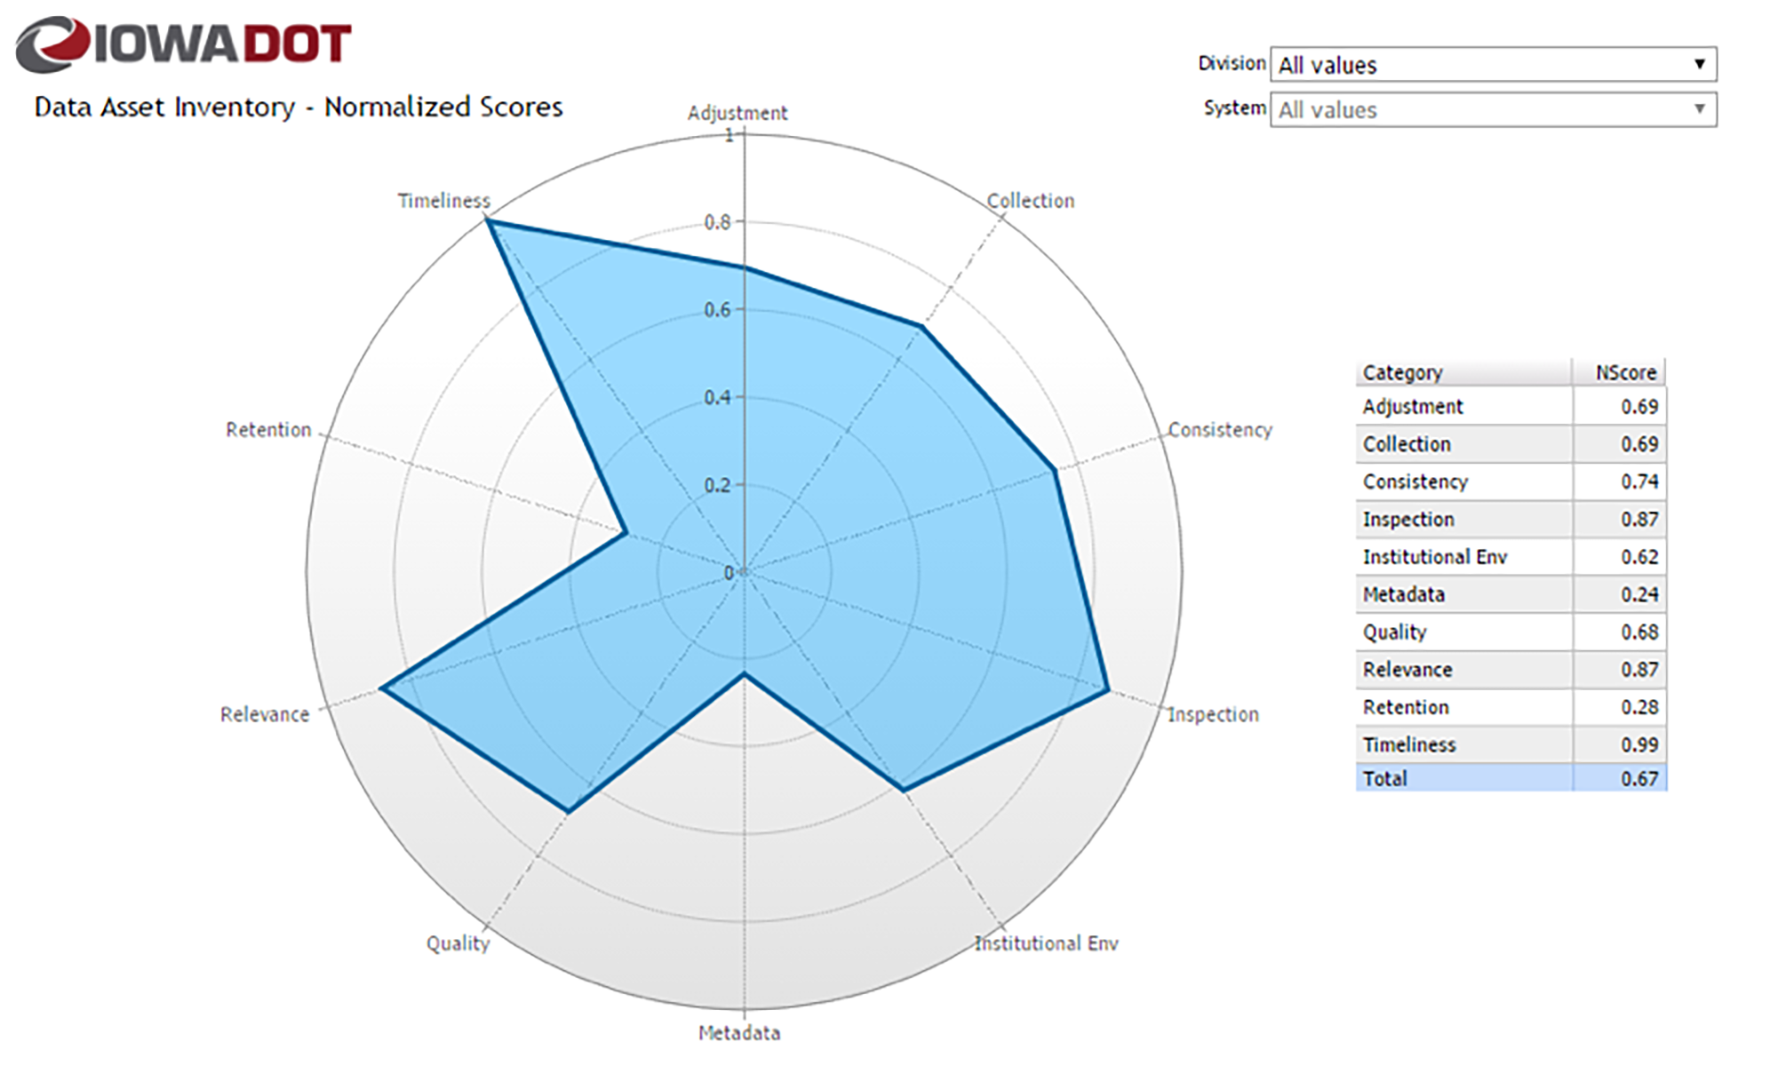
Source: Iowa DOT. 2019
AASHTO
AASHTO Digital TAM Guide Update Hackathon — Kickoff Meeting