7.1.3
Planning for TAM Information Integration
There are different levels of integration. In the short term, agencies can integrate the information they already have. In the longer term, agencies can modify and consolidate their information systems. Integrating data for TAM should be approached systematically to ensure agencies achieve a solution that meets their needs and is ultimately sustainable.
Step 1: Establish Requirements
What is the purpose of the integration? To create a publicly available map showing asset conditions and projects for both internal and public use? To create a BI environment for answering a range of questions about asset performance and cost? To integrate asset data across different systems used for planning, design, construction, and maintenance?
Based on the identified needs, determine what data will be integrated and at what frequency. Consider whether this will require historical data, current data, future projections, or a combination.
Early collaboration between business units and information technology units is important to establish a shared understanding of both business needs as well as technical requirements and constraints. A strong business-IT partnership is essential for successful information integration initiatives.
Step 2: Identify and Evaluate Data Sources
Identify the available data sources to meet requirements. Determine where the data reside, and in what form – such as engineering design systems, relational databases, spreadsheets, document repositories, etc. Assess the current level of data quality to make sure that the source is ready for integration, based on discussions with the data steward or through examining the data. For design files/models a key quality consideration is whether established standards have been consistently applied. It is also important to determine the level of spatial and temporal granularity – or what does each record represent (such as a pavement condition observation for a 0.1 mile section for April 2019; a paving project on a 1.5 mile section due to open for traffic sometime in 2020).
Step 3: Analyze Linkages
Identify how different data sources will be linked. Spatial linkages are a good place to begin. If GPS coordinates are used, make sure that the Coordinate Reference System (CRS) used is documented, along with positional accuracy. If a Linear Reference was used, determine what method was used to establish the measure along the route, and what version of the agency’s LRS was used to establish route identifiers and reference points. Find out if the linear reference has been updated to reflect changes in the LRS since the data were last collected (if applicable).
TIP
Set standards for how assets and work activities will be linked to GIS/LRS locations. Then create processes and tools to make sure these standards are followed.
Identify other types of (non-spatial) linkages that may be needed to join different data sources – for example, project numbers, account codes, work order numbers, etc. Agencies may want to profile the data for these elements to understand variations in coding and formats.
Step 4: Design Data Flows and Select Technology Solutions
Based on the requirements, available data, the linkage analysis and the tools and resources available within the agency, design how the data will flow from sources to target systems, and select the technology solutions to be used for performing the integration itself. The target system might be a general purpose enterprise geodatabase, an enterprise asset management database, a BI tool reporting data source, data warehouse, or a data lake. Data Extract-Transform-Load tools are available from data warehouse vendors; simple integration tasks may be accomplished through scripting. There are also a variety of specialized tools available for transforming and combining spatial data, and for extracting data from CAD/3D models.
Step 5: Design and Implement Integration Methods
Develop the technical approach for transforming link fields so that they are consistent across databases and if applicable, joining the different data sets and combining common data elements from the different sources. This may involve spatial processing (such as dynamic segmentation), aggregation, coding conversions, and other transformations.
Short term integration strategies include:
- Creating GIS data layers and making them accessible in available web and desktop-based GIS software. This strategy requires that each data source uses compatible spatial referencing, or can be converted to a common referencing system.
- Creating a database or view combining data from various source systems, and using available BI/Reporting tools to create reports and data visualizations. This strategy requires identifying common “dimensions” across source systems and/or normalizing data so that it can be summarized. For example, if the agency wants to report asset quantities by district or county by year, it will be necessary to make sure that each source has these data elements and that the data can be converted to a consistent set of values.
- Exposing data from authoritative sources as services via Application Programming Interfaces (APIs).
In the longer term, agencies can consider re-architecting or consolidating their systems so that they work better together. A logical way to approach this is to document the “as is” situation and then map out a “to be” architecture. This will allow the agency to chart a path from the current state to the desired future state. It will also provide a framework for capturing requirements for any new systems that are brought into the agency.
Integrated asset management systems are not a new concept and there are several commercial systems that support information management and work planning for multiple asset types. However, some agencies are challenged to integrate information about major assets (pavements and bridges) with information about various other ancillary assets – given that approaches to planning and budgeting for major assets are more sophisticated and require a greater level of detailed information and analysis. Also, it can be a challenge to integrate information about operations and maintenance with capital projects given differences in how work is categorized, performed, and tracked.
TIP
Find opportunities to save on data collection costs by capturing asset information during project design and construction.
Kansas DOT
KDOT’s architecture was based on a value chain model that represents the agency’s business components and relationships. It included a set of “context diagrams” showing information flow across systems and actors for major subject areas including highway asset systems, long range planning, pre-construction, construction and maintenance. While an architecture does require significant effort to create and maintain, it provides a more global and stable view of business processes and information needs than what would be produced through a piecemeal, incremental approach to system upgrades and replacements. This view can be used to plan the path from the existing set of systems to a more efficient and integrated set.
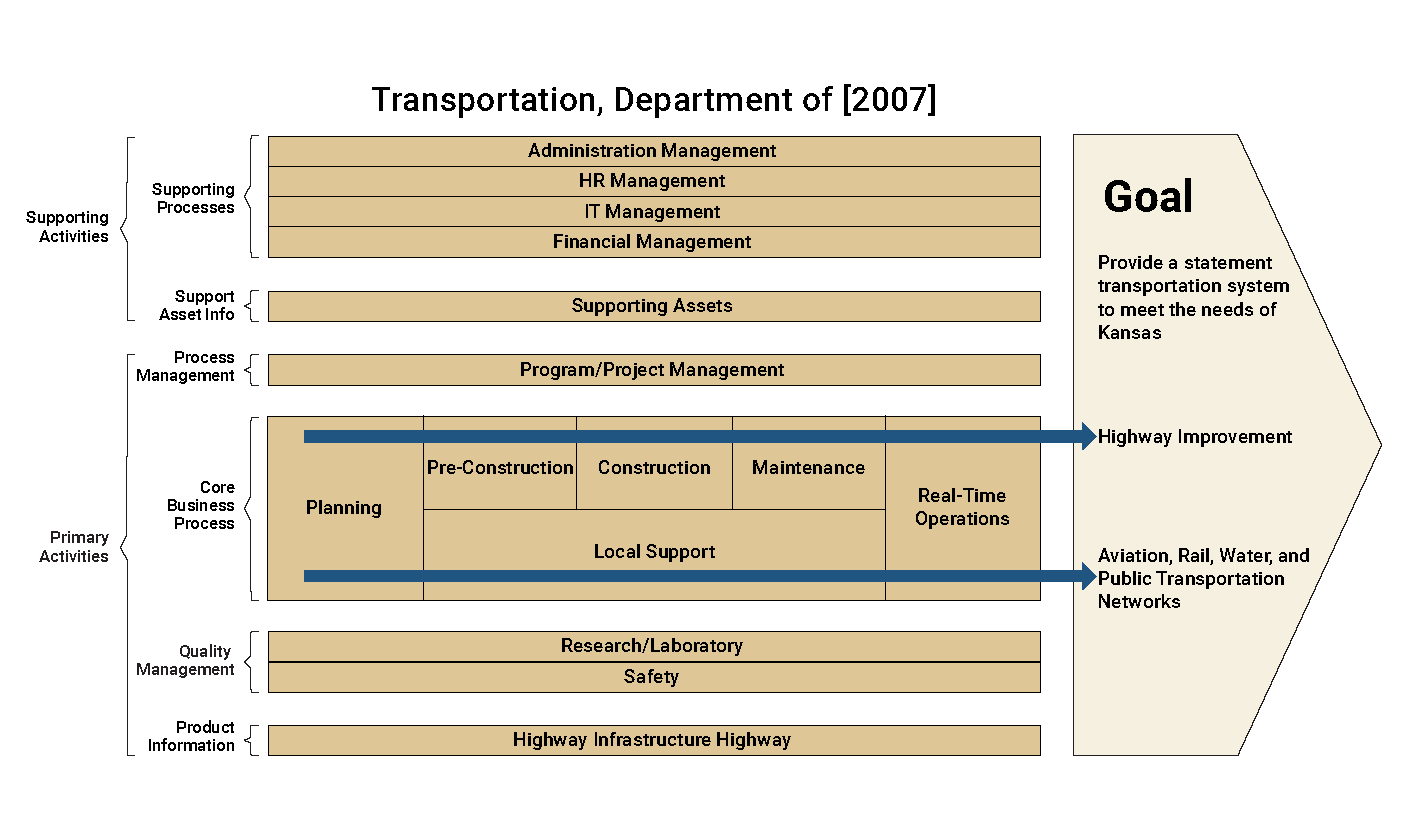
Source: Adapted from Kansas Department of Transportation. 2003. Enterprise IT Architecture