Section 4.1
Introduction to Life Cycle Management
This section introduces life cycle planning and describes its importance for TAM through examples of agency practice and a how-to guide.
Introduction to Life Cycle Management
This section introduces life cycle planning and describes its importance for TAM through examples of agency practice and a how-to guide.
4.1.1
Defining Life Cycle Management
Through life cycle management, agencies employ data on asset condition, treatment options, costs, deterioration rates, replacement cycles, and other factors to determine the most cost-effective, long-term strategies for managing assets throughout their lives.
All transportation infrastructure assets have a life cycle, which includes several stages from initial construction to removal or replacement (see figure 4.1). Life cycle management is an investment approach that considers maintenance, renewal, replacement, or repair options through an asset’s service life with the intent to maximize the benefit provided by the asset at the minimum practicable cost. It employs data on asset condition, treatment options, costs, deterioration rates, replacement cycles, and other factors to evaluate trade-offs between possible investment strategies and treatment timings. Effective life cycle management requires knowledge of the agency’s strategic priorities and an understanding of the performance criteria driving investment decisions, so the right management strategy can be identified and implemented for each asset class. Aligning asset management measures with agency priorities ensures the investments made to extend asset service life provide the maximum impact to the agency’s long-term goals.
Figure 4.1 illustrates a variety of interventions that occur over an asset life cycle. The larger circles represented in the figure are service life altering, and represent a capital investment in infrastructure. Capital investments provide significant life extension, and may alter or enhance the operational nature of the asset, e.g. expand capacity, without fully replacing the asset. Maintenance (reactive, interval based and routine) activities are required throughout the life cycle to ensure the asset achieves its service life.Preservation treatments restore condition or performance to achieve service life, and may extend service life as well, but do not significantly alter the operational nature of the asset. Some agencies may capitalize investment in these preservation activities; however, regardless of the timing and character of the selected interventions, all of them are part of the life cycle management process. More (lower cost) maintenance interventions can offset the number and cost of the larger (and more costly) interventions. Balancing the right intervention, at the right time, can greatly reduce the overall investment needed for infrastructure to be reliably available for providing service.
Figure 4.1 Stage of an Asset Life Cycle
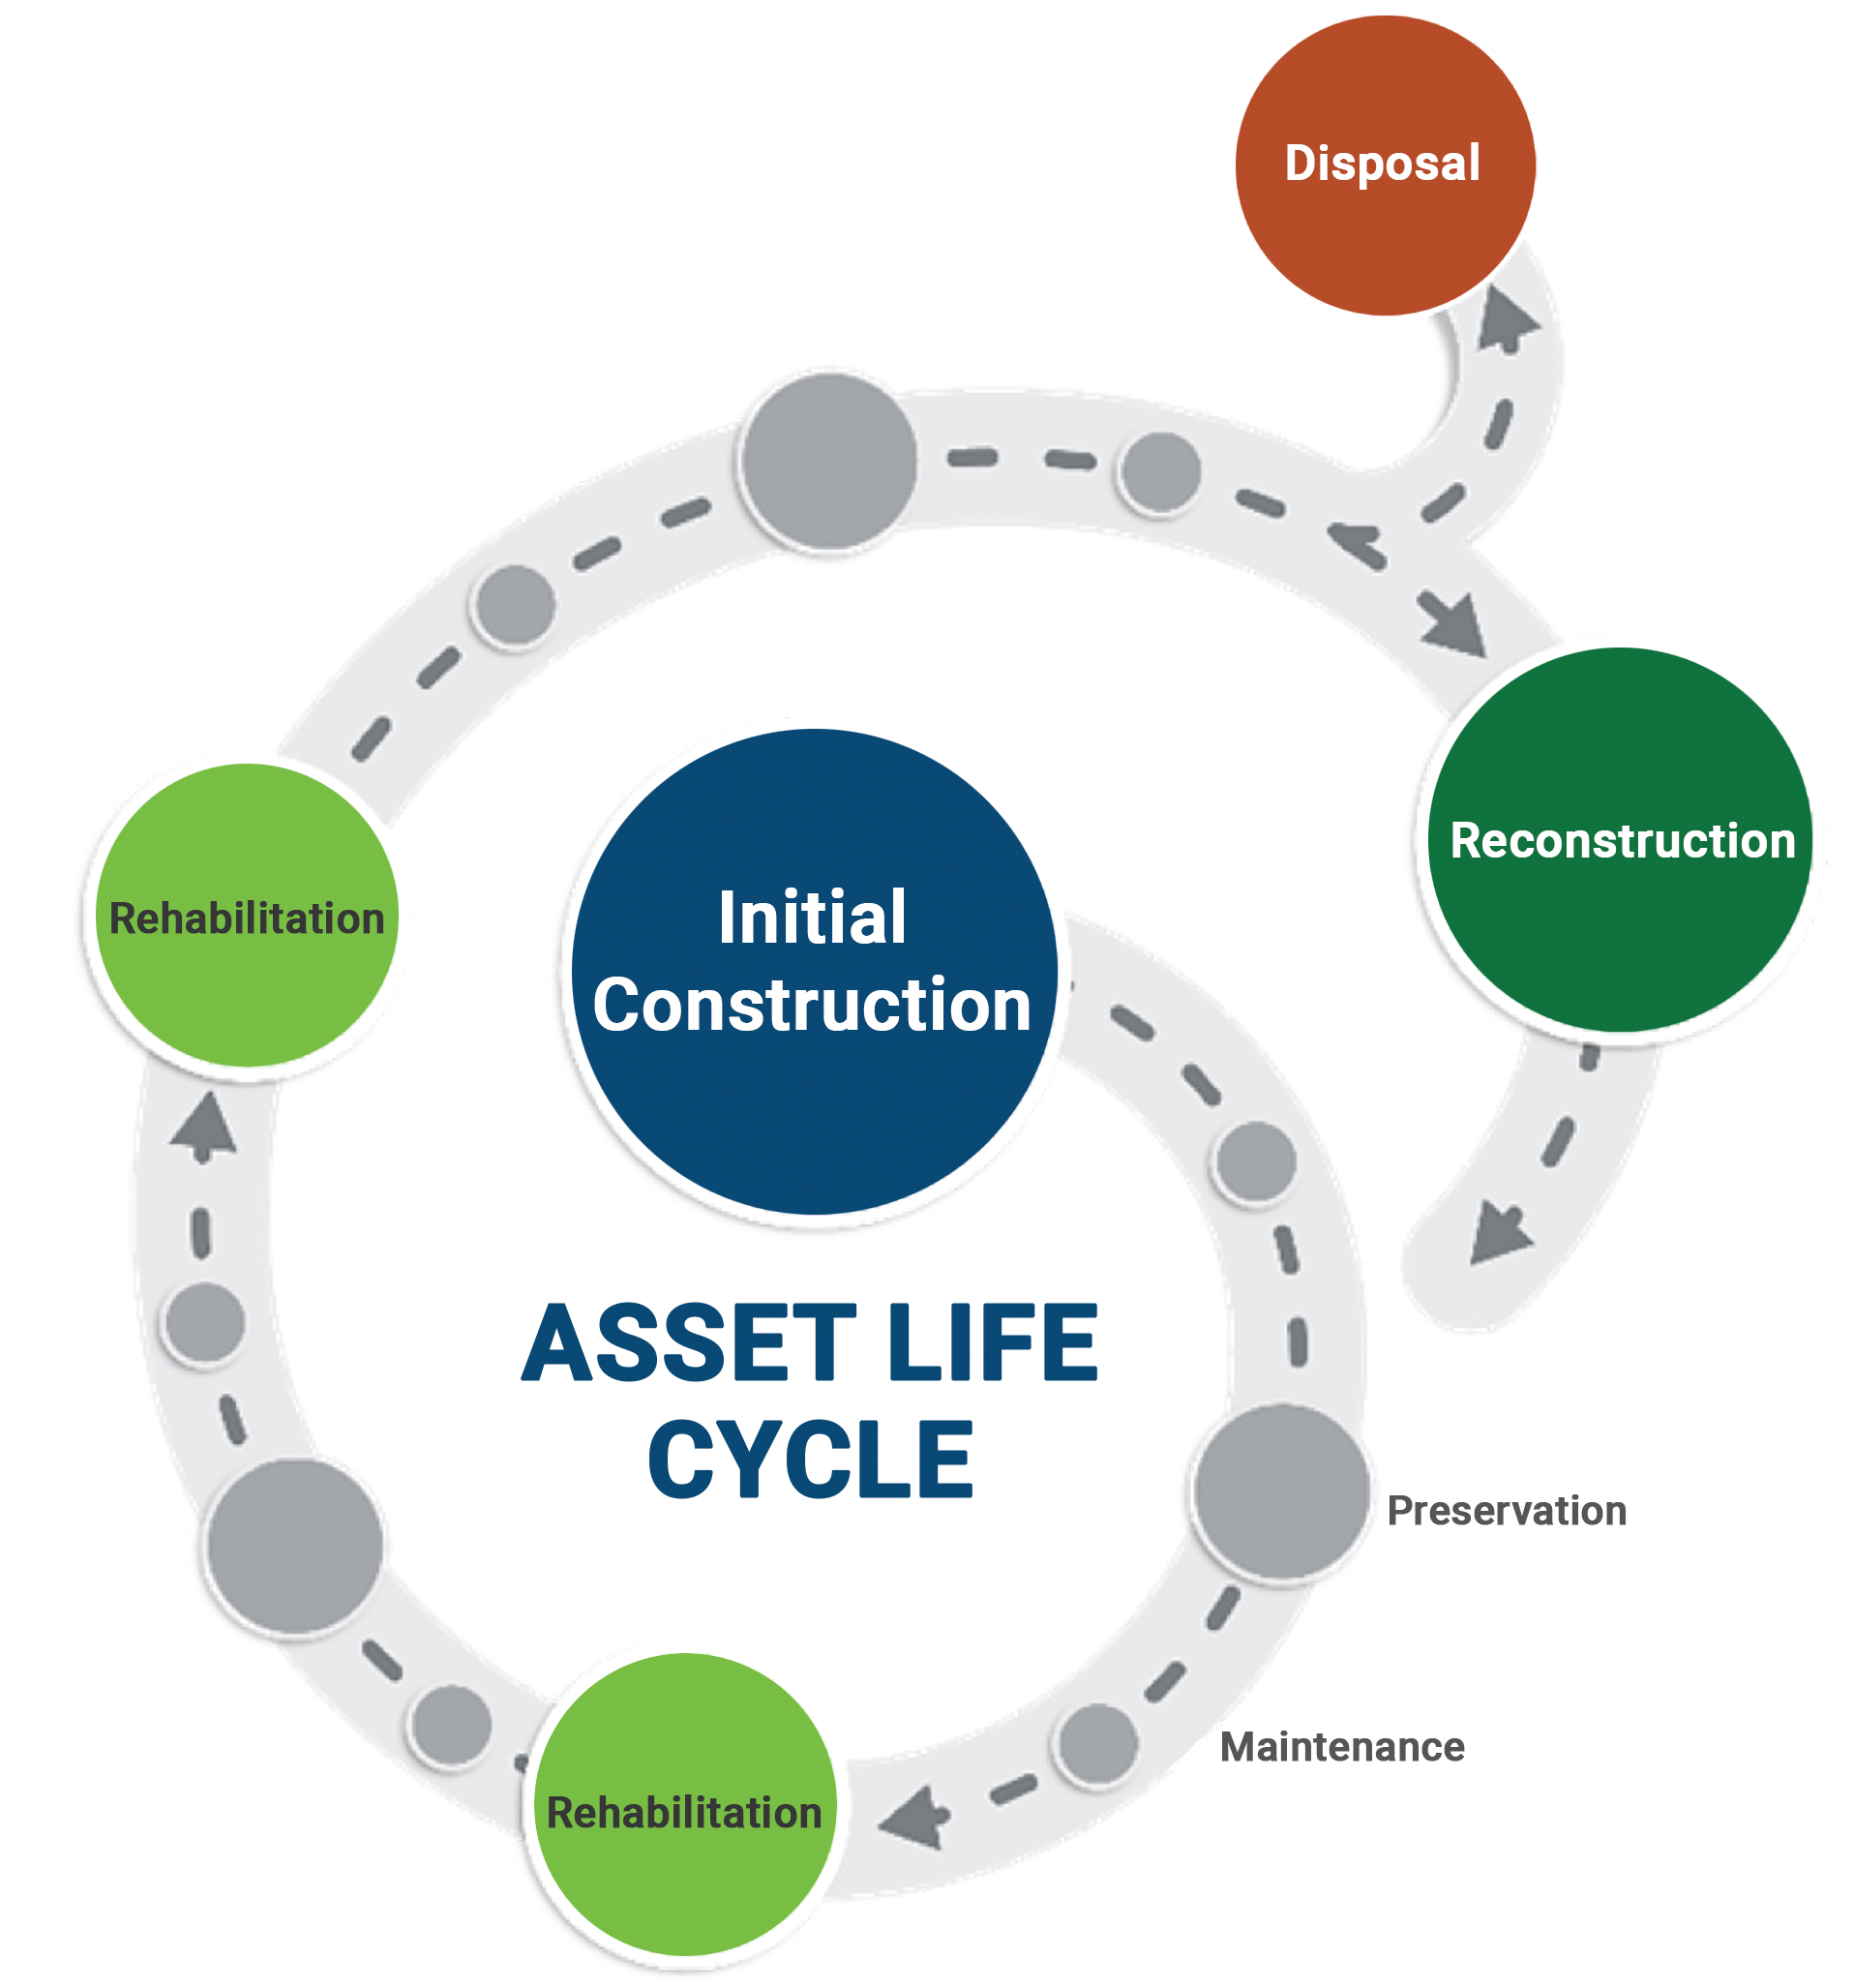
Source: Applied Pavement Technology, Inc. 2017
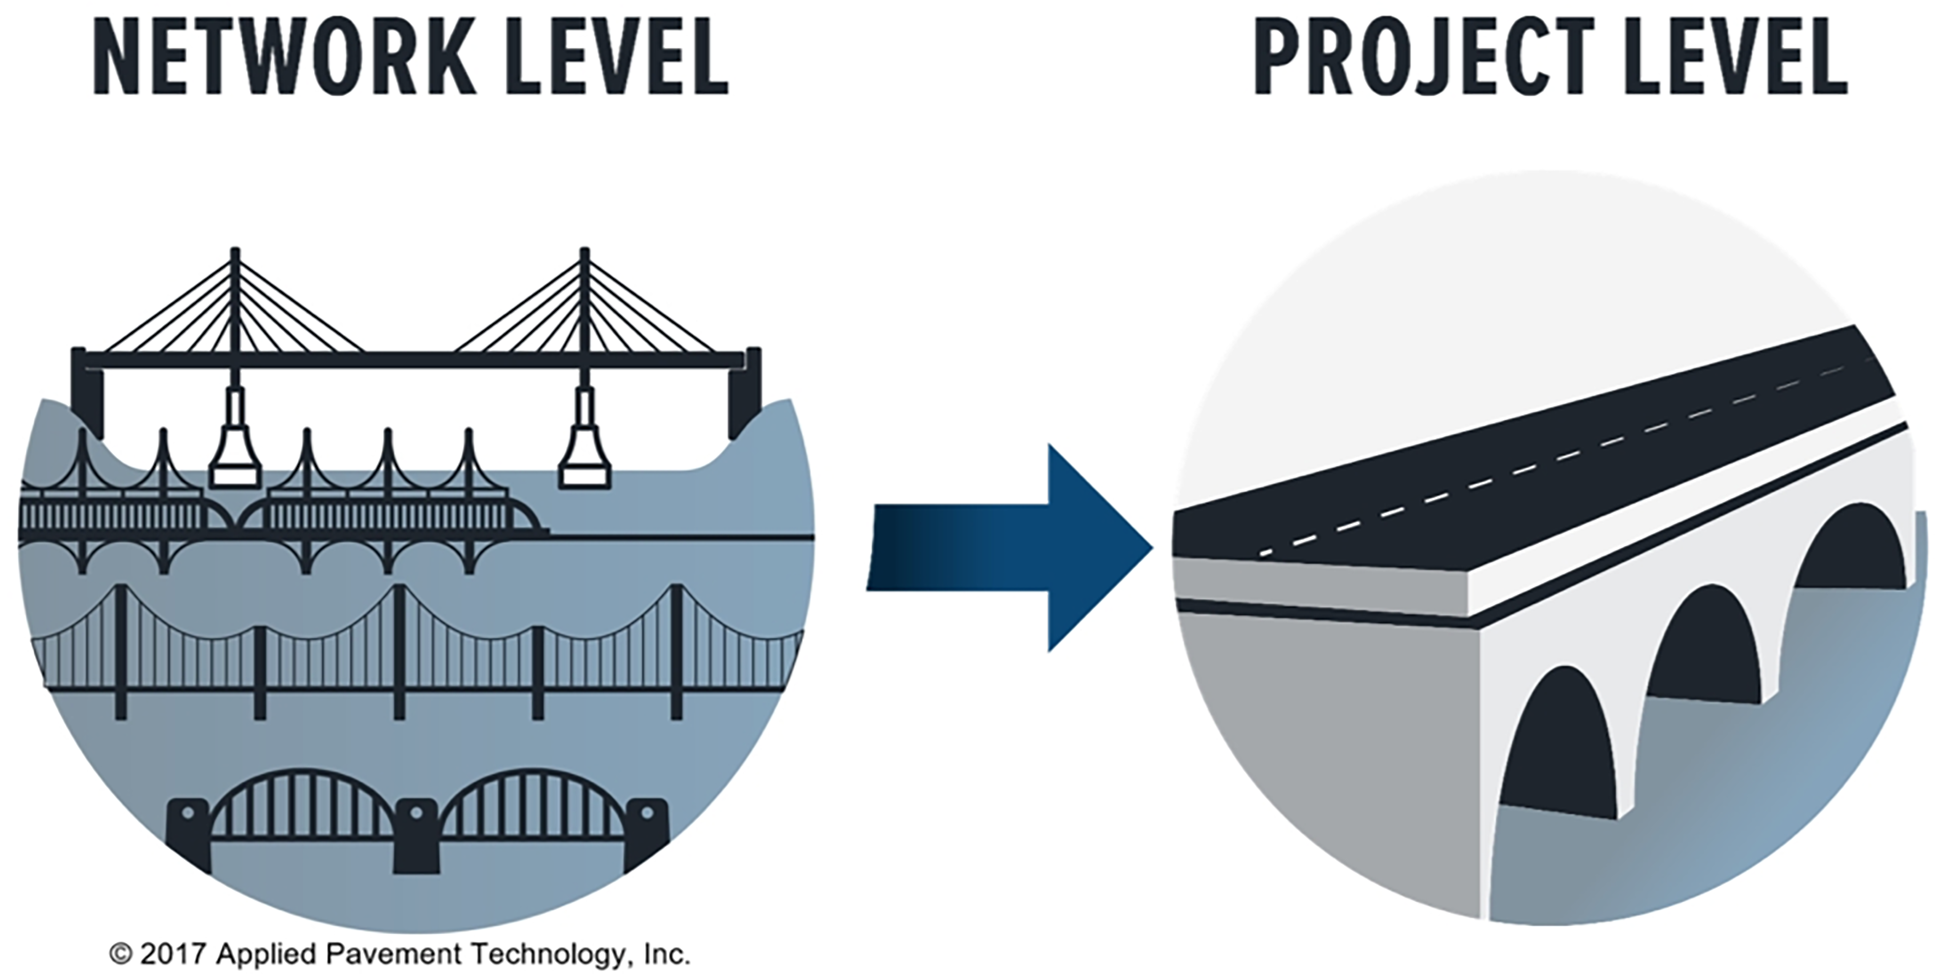
Life cycle management can be used at both network level and at project level. At network-level, life cycle management considers the needs of an entire asset class, as well as the available funding, to determine the most appropriate life-cycle strategies. For example, analysis can establish the optimal proportions of overall investment that should be allocated to different types of interventions over the network, to minimize investment to achieve performance targets or an average condition level. At a project level, life cycle management is commonly used to develop asset-specific strategies. Project level life cycle plans provide input into the network level life cycle plans. Large bridges or other distinct network components are often planned and managed in this manner.
Life Cycle Cost Analysis (LCCA) is an engineering-economics approach that can be used to quantify the differential costs of alternative design approaches. Network level life cycle management, while a more wholistic process that manages every stage of an asset’s life, may employ LCCA or other forms of analysis to inform management decision-making. Figure 4.2 highlights some of the major differences between life cycle management and life cycle cost analysis. At the network level, LCCA can be used to understand how to best manage the network as it ages. At a project level, it is used to understand what are the most effective actions to be taken on the assets within the project scope at the time of project delivery. Both network level and project level analyses contain many aspects of engineering economic analysis, such as consideration of user benefits, user costs, and the time-value of money to identify alternatives that represent the lowest practicable life cycle cost over the analysis period to achieve the desired objectives.
Figure 4.2 Attributes of network level life cycle management and project level life cycle cost analysis
- High level.
- One asset class or subclass.
- Multiple locations.
- Looks at impacts of varied treatment timing.
- Considers future cost changes.
- Detailed.
- Multiple asset classes.
- Single location.
- Treatment timing fixed for all options.
- Uses discount rate.
Source: Applied Pavement Technology, Inc. 2017
Decision Making Context
Life cycle management is driven by the need for owners to provide consistent service to those that use the transportation system with the resources available. Infrastructure decision making can take place at several levels within an organization, and in each case, considers different but often interrelated factors. These are illustrated in table 4.1.
Figure 4.3 Analysis of KYTC Future Costs Under Two Strategies
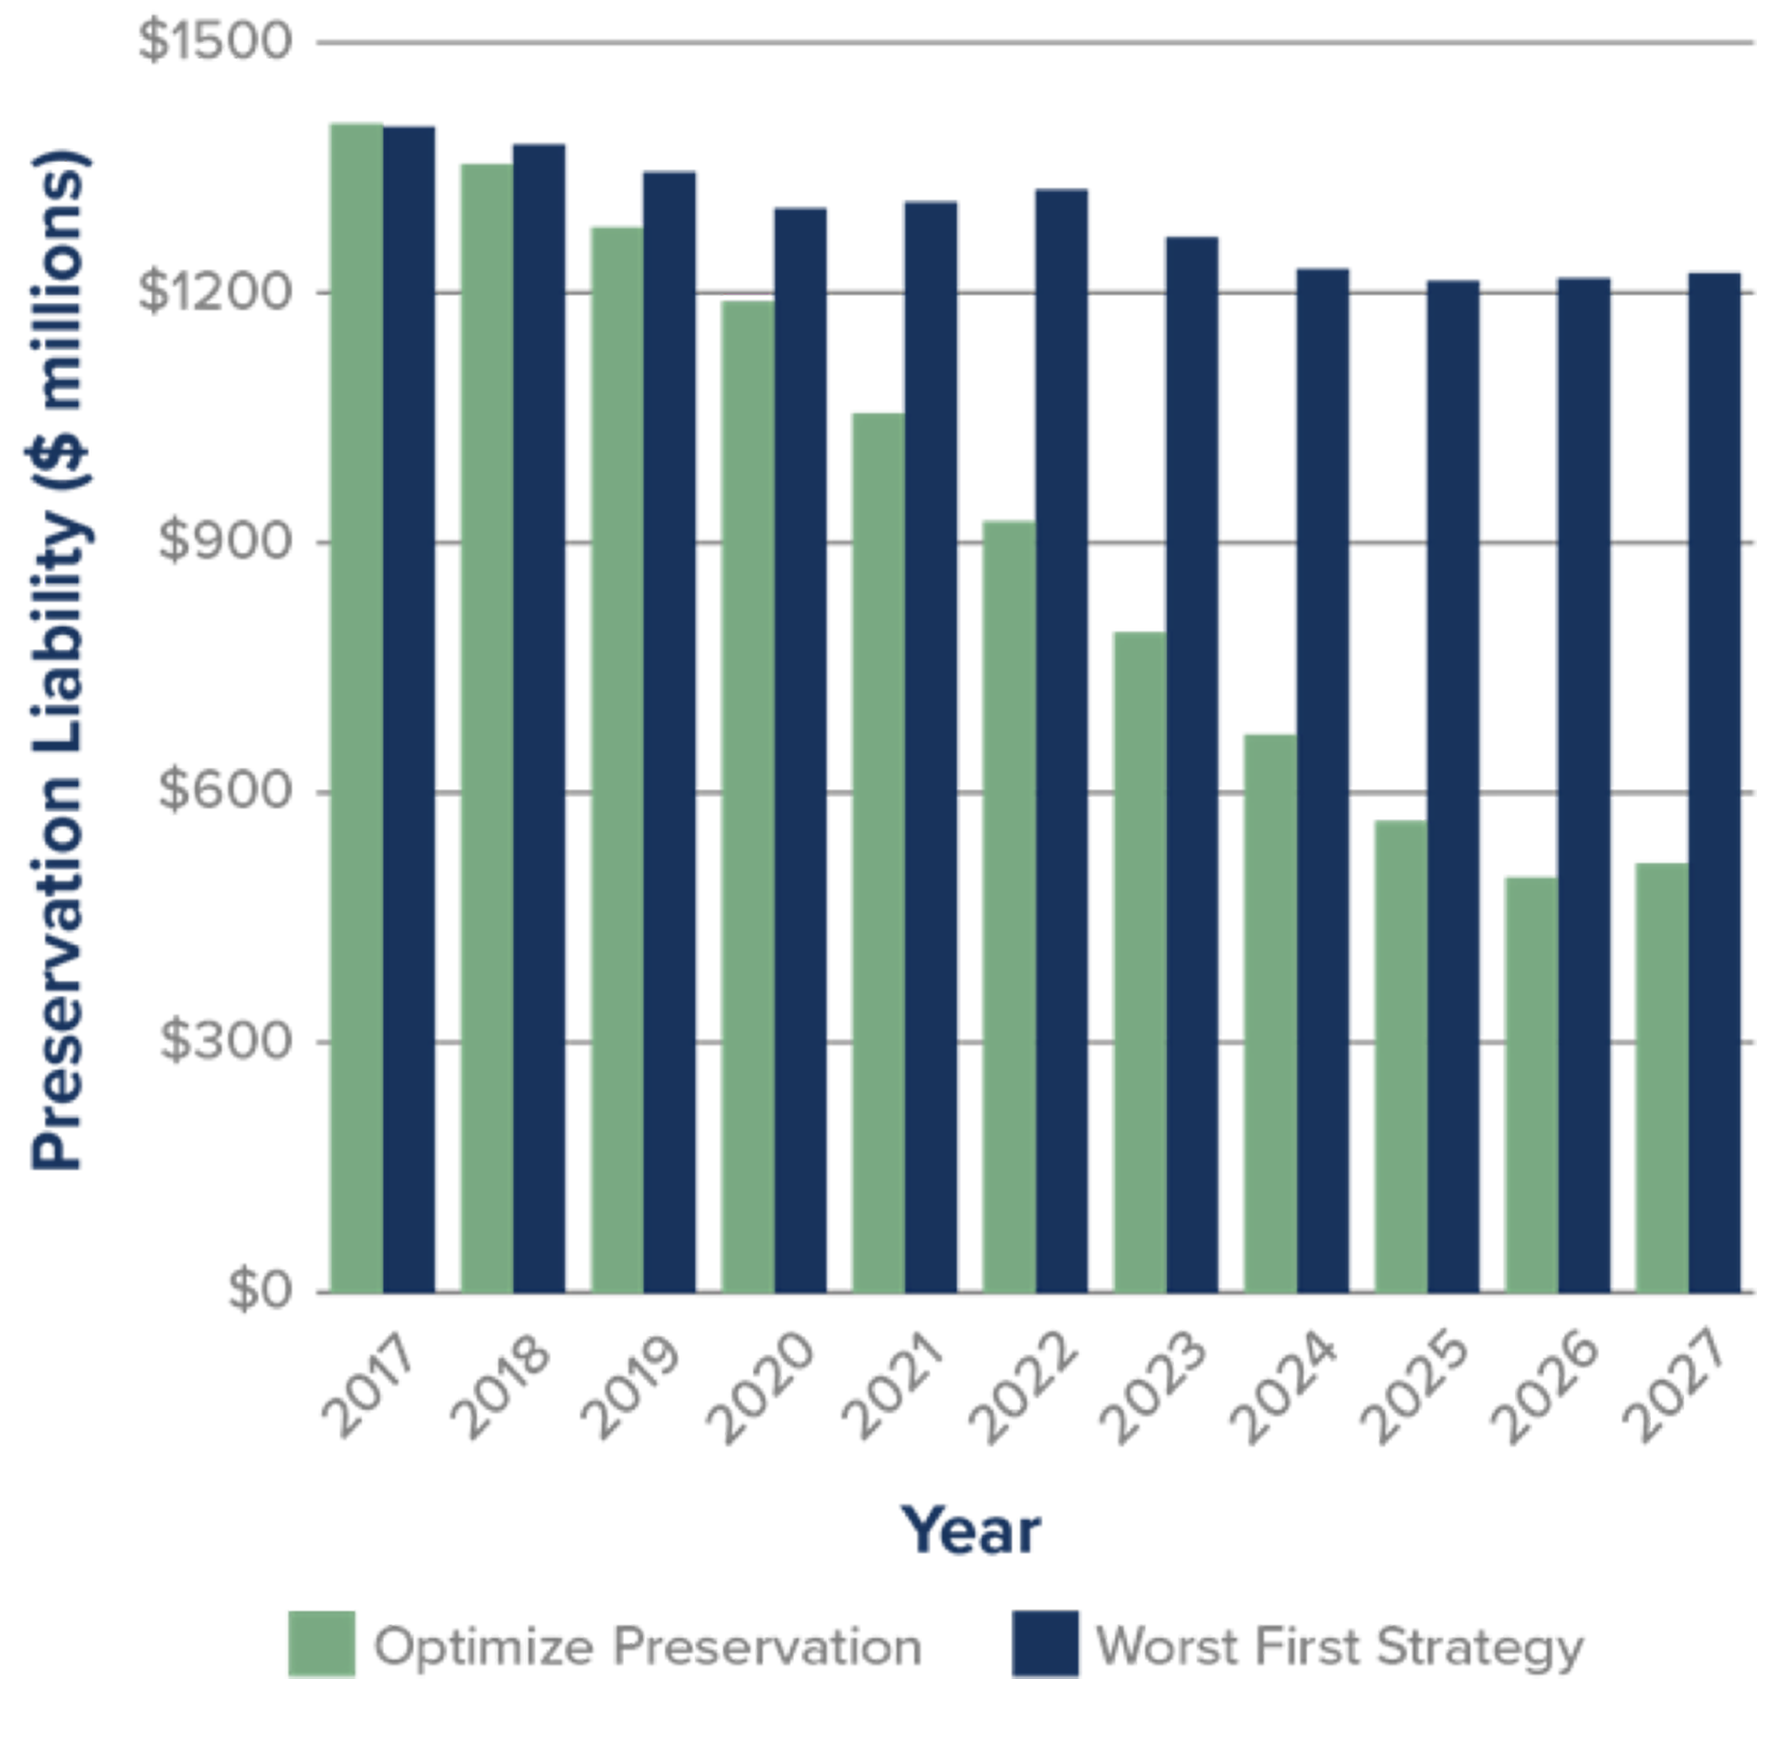
Source: Kentucky Transportation Cabinet Transportation Asset Management Plan, 2018.
Table 4.1 - TAM Decision-Making Contexts
Key Questions and Connections to Other Chapters
| Strategic | Tactical | Operational | |
|---|---|---|---|
| Key Decisions | Setting goals and objectives. | Capital investment prioritization and scoping and Integration of maintenance and renewal strategies | Delivery of the capital program, routine maintenance, and highway-operations activities. |
| Decision Makers |
| Directors and managers who are asset stewards. | District and field mangers, supervisors, and staff. |
| Key Questions |
|
|
|
| Other Factors | Decisions and outcomes of these strategic questions help focus investment. They add value to overall performance of the transportation system by setting priorities, values, and help prioritization of investment at lower levels. Creating new assets and disposing of existing ones are strongly influenced by decisions and priorities defined at this level. Chapter 2 discusses these considerations in more detail, and the level of service section in this chapter discusses linking these strategic priorities to decision-making at lower levels. Performance and target setting in Chapter 6 also discusses this linkage and how targets can be set to achieve these strategic goals. | This Chapter focuses on these questions and on the analysis that informs their corresponding answers and decisions. Life cycle management and analysis focuses on the existing transportation system and evaluates how:
| Delivering a program work, ranging from maintenance activities to capital improvements, requires a coordinated management of a large workforce. It requires processes that minimize input of resources to get the output required for desired system performance. Work management systems, efficiency and improvement techniques and performance management focus on improving decisions at this level. These concepts are discussed in Chapter 5, 6 and 7. |
Kentucky Transportation Cabinet (KYTC)
In the early 2000s, KYTC found that the cost of hot-mix asphalt (HMA) was increasing faster than its budget to maintain pavement conditions. In response, KYTC evaluated the feasibility of strategies that relied heavily on preventive maintenance overlays such as thin HMA overlays (< 1 inch), chip seals, cape seals, and slurry seals. KYTC found that while the costs of these treatments were substantially less than a traditional HMA overlay, their service lives were only marginally shorter. As a result, the agency began increasing the use of these treatments on its secondary system. As part of developing its risk-based TAMP in 2018, KYTC evaluated life cycle strategies, as shown in Figure 4.3 Analysis of KYTC Future Costs Under Two Strategies that expanded the use of preventive maintenance overlays to its parkway and interstate pavements. The analysis results led the agency to select a life cycle management strategy that maximizes the use of preventive maintenance overlays on secondary roads and parkways and increases their use on interstate pavements over time. As shown in Figure 4.3, this new life cycle strategy achieved conditions over the 10-year TAMP analysis period that would have cost an additional $644 million if they had continued to rely on traditional 1- to 2-inch HMA overlays. By implementing these improved strategies, KYTC has significantly reduced the risk that the infrastructure will reach an unsustainable cost to maintain in the future.
Source: KYTC Transportation Asset Management Plan, 2018. http://www.tamptemplate.org/wp-content/uploads/tamps/048_kentuckytc.pdf
4.1.2
Defining Asset Service and Performance Levels
Before asset performance can be managed, an agency must first define what it is seeking to achieve. In TAM, asset performance is most commonly defined in terms of asset condition or maintenance level of service. Performance may also be evaluated in terms of safety, availability, reliability, resiliency and other service attributes. Regardless of the method used to monitor performance, it should be used to inform analysis that supports decisions to help ensure that investments enable an agency to achieve its goals cost-effectively.
Establishing Desired Levels of Service
Before a whole-life strategy can be developed and implemented, an agency must determine what they seek to achieve. In many transportation agencies, the desired level of service (or asset management organizational objectives, in ISO 55000 terminology) provides the linkage between what the goals of an agency are, and what investments and interventions should take priority when managing assets. High level goals should directly influence investment choices when resource allocation decisions are made. Service levels help establish when gaps need closing to achieve a goal, and merits investment. Chapter 2 discusses ways to create linkages between goals and investment decision making.
When managing the life cycle of existing assets, performance targets are commonly established as a way to manage service levels for the transportation network. How to determine the expected level of performance may vary depending on the type of asset being managed. Level of service targets that are part of performance framework typically are a mixture of both customer focused performance measures, and technical service measures that help those responsible for the asset assess what types of interventions might be required and when. Customer focused service measures are important to road users and other stakeholders that require mobility. Travel time reliability, safety, load capacity and clearances, and lane availability are all examples of service targets that are customer focused. Condition, strength, regulatory compliance and examples of technical service attributes are commonly of greater interest to asset stewards than asset users. Both types are service level targets that are important to evaluate the efficacy, effectiveness and efficiency of a transportation system.
TIP
“The organizational objectives provide the overarching context and direction to the organization’s activities, including its asset management activities. The organizational objectives are generally produced from the organization’s strategic level planning activities and are documented in an organizational plan.” (ISO 55000, 2.5.3.4) These organizational objectives are analogous to strategic objectives typically found in long range transportation plans.
For pavements and bridges, and other assets managed using a condition-based approach, asset condition is commonly used to establish expected technical levels of performance, but also is relevant to customers. For example, condition is employed as a proxy in this way for pavements because it is objectively measurable, deterioration has some predictability. It is a valuable service attribute because often, user experience is also directly connected to condition as well. Potholes, rutting and roughness all reduce quality of service from a pavement. Performance measures, such as those discussed in Chapter 6, are used to establish the desired long-term performance and to set short-term targets that can be used to track progress towards the long-term objectives. For other highway assets, including those managed using interval- or time-based maintenance approaches, performance may be linked to the expected service life, the ability of the asset to fulfill its intended function, and/or other operational factors. For these other highway assets, performance targets are often established as part of a Maintenance Quality Assurance (MQA) program in terms of desired maintenance levels of service (MLOS) and integrated with operational service targets that may also be customer focused.
Risk can also be used as a measure of performance. As described in chapter 2, risk considers both the potential impact and consequence of failure. This can be particularly useful when the potential consequences of failure impact other assets or facilities. An example of how Colorado uses risk to manage rockfalls is included in section 4.3 of this chapter. Additional details on how to track risk-based performance measures is included in Chapter 6.
Establishing a desired level of performance is typically a collaborative process that considers existing conditions, available funding, expected demands on the system, policy goals and guidance, and stakeholder priorities. The desired level of performance is typically established once baseline data is available, so performance trends can be evaluated. The desired level of performance may be adjusted over time to reflect changes in agency performance, changes in asset condition, capacity, safety, resiliency and other factors.
Three types of service expectations are often used in combination to manage asset performance:
- Performance target – the level of performance beyond which additional performance gains are not desired or worth the additional cost. When performance is measured based on condition, the desired performance may describe the desired state of good repair. There may be an expected specific time frame to achieve this desires performance target.
- Current Performance – an intermediate level of performance achieved by the organization and is usually reported relative to the desired target. Target setting is described in more detail in Chapter 5.
- Minimum acceptable performance – the lowest level of performance allowed for the asset or asset class to still function as designed.
Performance expectations may be set for the road network, a road corridor, for individual assets or for a group of assets. Commonly, performance expectations are set using a combination of asset class or subclass or sub network, such as:
- Key network corridors.
- Bridges on the National Highway System.
- Interstate pavements.
- Culverts larger than 10 feet in diameter.
- Traffic signals serving more than 10,000 vehicles per day.
TIP
A desired state of good repair is often established as the level of performance beyond which further performance gains are not necessary or desirable, usually represented as a condition state for a set of assets.
The nature of performance expectations can be either strategic or tactical or operational. Strategic expectations support freight movement; for example, the long-term goal of providing unrestricted flow of legal loads is supported by a performance expectation of no load-posted or restricted bridges on interstate highways. This expectation cannot be accomplished without the tactical delivery of work to address factors contributing to the physical condition of bridges. Thus, an agency may include tactical expectations to perform maintenance and repair on structural members on a routine basis or as conditions warrant. These enhancements can be also integrated with renewal and other rehabilitation interventions to help improve both tactical performance metrics, as well as achieve higher level goals and objectives. Operational improvements such as more responsive snow clearance, and better signage are all integrated treatment options to achieve the strategic objective.
Life cycle management analysis, and the decisions it supports, require service levels, performance targets and other objectives to be able to determine the optimal choices for agencies to select during resource allocation. Over an asset life cycle, a range of interventions are possible, from reactive, routine and preventative maintenance, to large investment associated with renewal, replacement, or removal. Having targets helps select the right interventions and investment option while balancing risk, service and cost.
Connecting performance measures to higher level strategic goals also supports an agency’s ability to communicate how technical measures relate to system performance as experienced by highway users and other external stakeholders, thus tying asset management outcomes to system performance. Asset management measures are often very technical. Performance indicators like bridge ratings, pavement distress measurements, and risk ratings are not commonly understood by those outside transportation agencies. However, agencies can use these technical measures to support the performance indicators that are more commonly understood and prioritized by system users and external stakeholders. Communicating system performance and the status of the road network is discussed in Chapter 2, and is illustrated in several examples below. Customer service level targets are often established for this purpose, and give users an ability to understand the quality of service they should expect on the transportation system.
Colorado DOT
Each year, the Colorado DOT must report to its legislature on the statewide highway infrastructure and the agency’s ability to meet those needs with available resources. This requirement is met through the Annual Infrastructure Deficit Report, which addresses pavements, bridges, and annual maintenance. The agency supports the annual maintenance portion of this report with its Maintenance Level of Service Measure, which rates the delivery of services in nine program areas in terms of a letter grade from A to D and F. The agency has used historic data to develop deterioration rates for each service area that estimate the resources needed to improve the maintenance level of service by a given amount over a specific time period. These estimates are summarized in the Report, which is in turn used by the Legislature and the DOT to establish the annual maintenance budget. The figure provides an example of information on MLOS in the 2016 Report. Once the targeted MLOS is established, maintenance funding can be allocated to ensure that agency priorities are met.
Colorado DOT Example of Funding Needed to Support Maintenance Levels of Service
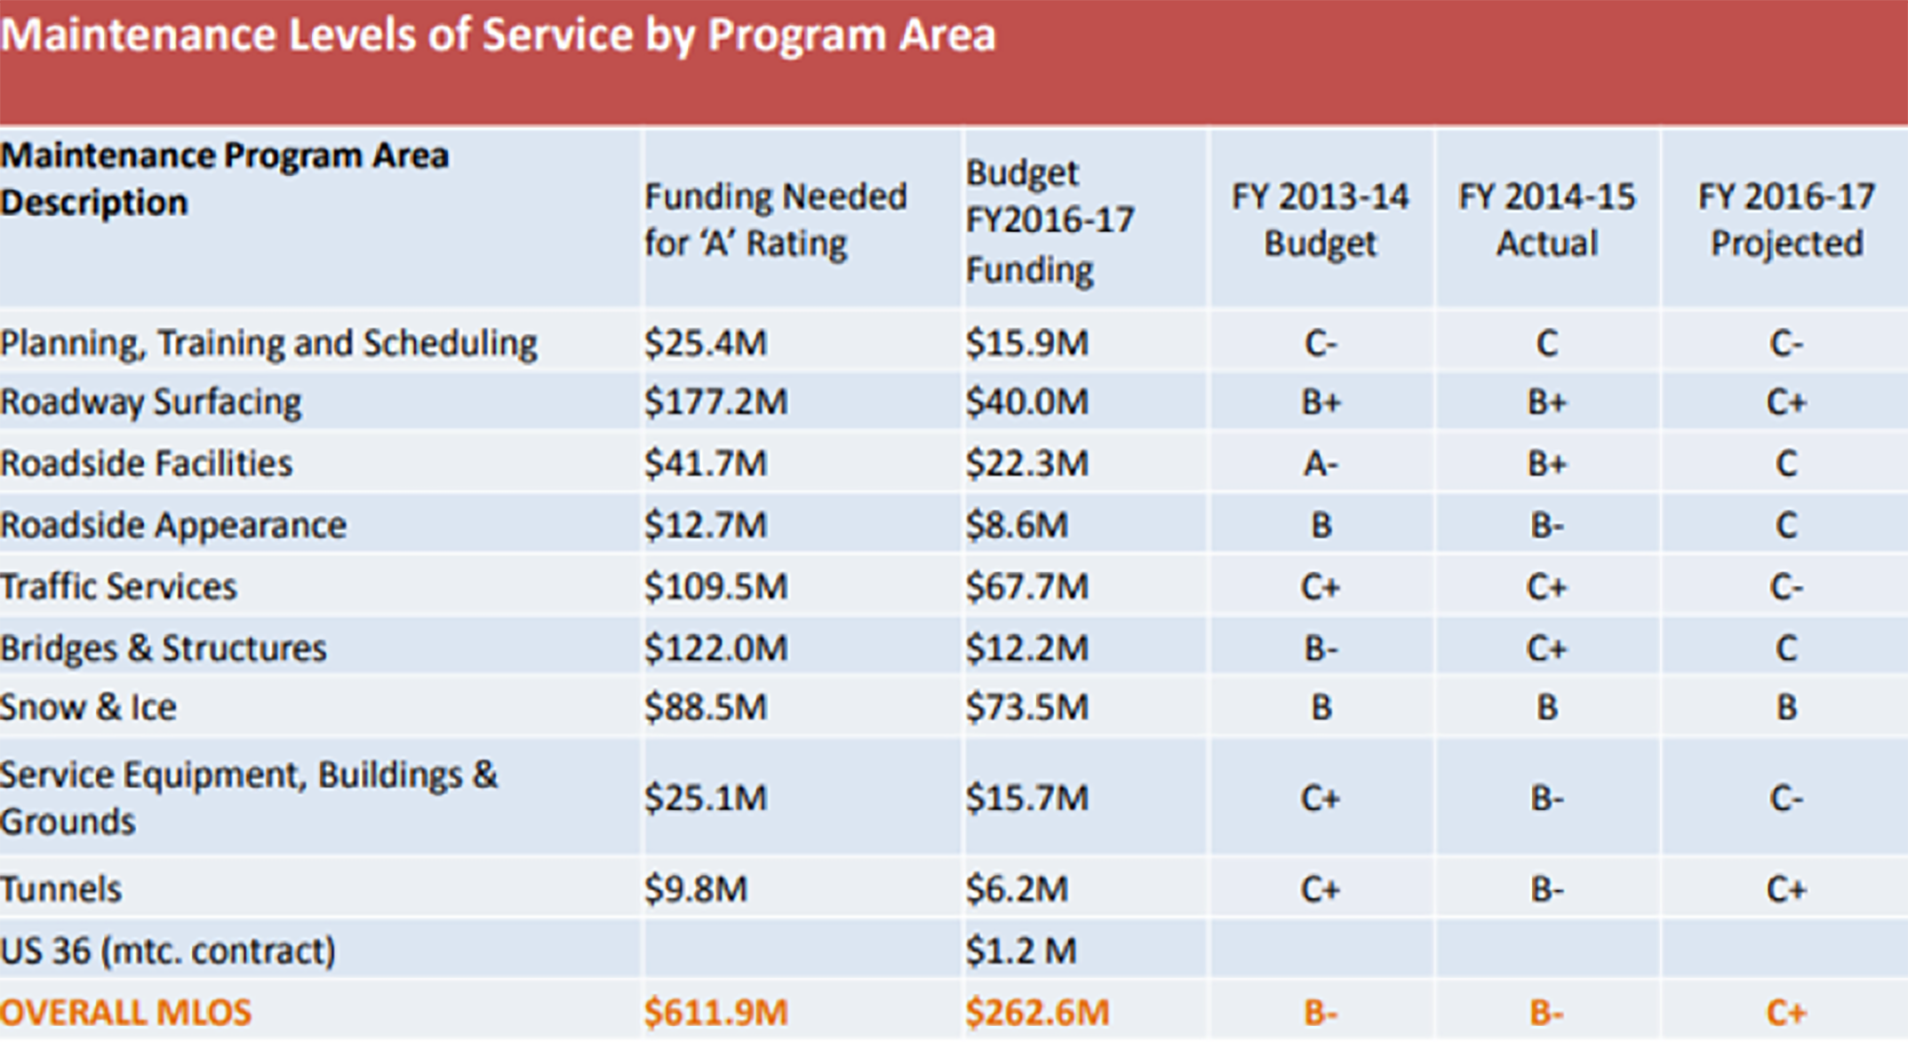
Source: Colorado DOT. 2016. https://leg.colorado.gov/sites/default/files/cdot_smart_2017_presentation.1.pdf
Washington State DOT
When seeking to establish the connection between investments and performance across a wide range of assets or roadway attributes such as litter, vegetation height, drainage, or functionality it is helpful to relate all of the various measures of performance to a common rating scale. Washington State DOT has developed its Maintenance Accountability Process to establish the relationship between maintenance level of effort and the resulting level of service. The process rates conditions and services in seven areas using a common letter-grade system, or MLOS.
- Roadway Maintenance & Operations.
- Drainage Maintenance & Slope Repair.
- Roadside and Vegetation Management.
- Bridge & Urban Tunnel Maintenance and Operations.
- Snow & Ice Control Operations.
- Traffic Control Maintenance & Operations.
- Rest Area Operations.
Each group of services or conditions includes several performance measures, which are translated to the MLOS grades of “A” (highest performance), “B”, “C” (adequate performance), “D” or “F” (unacceptable performance). Applying the MLOS grades allows for a consistent means of rating performance across services and geographic regions. Letter grades can also be represented in photographs of facilities that meet the criteria for each condition state to support communications with stakeholder groups. The MLOS are outcome-based measures that allow the agency to predict the expected level of service that can be achieved based on anticipated budget and work planning decisions. By tracking maintenance expenditures and MLOS results annually, Washington State DOT is able to adjust its maintenance priorities and budgets to address system needs and stakeholder wants.
Source: https://www.wsdot.wa.gov/Maintenance/Accountability/
New Zealand Transport Agency
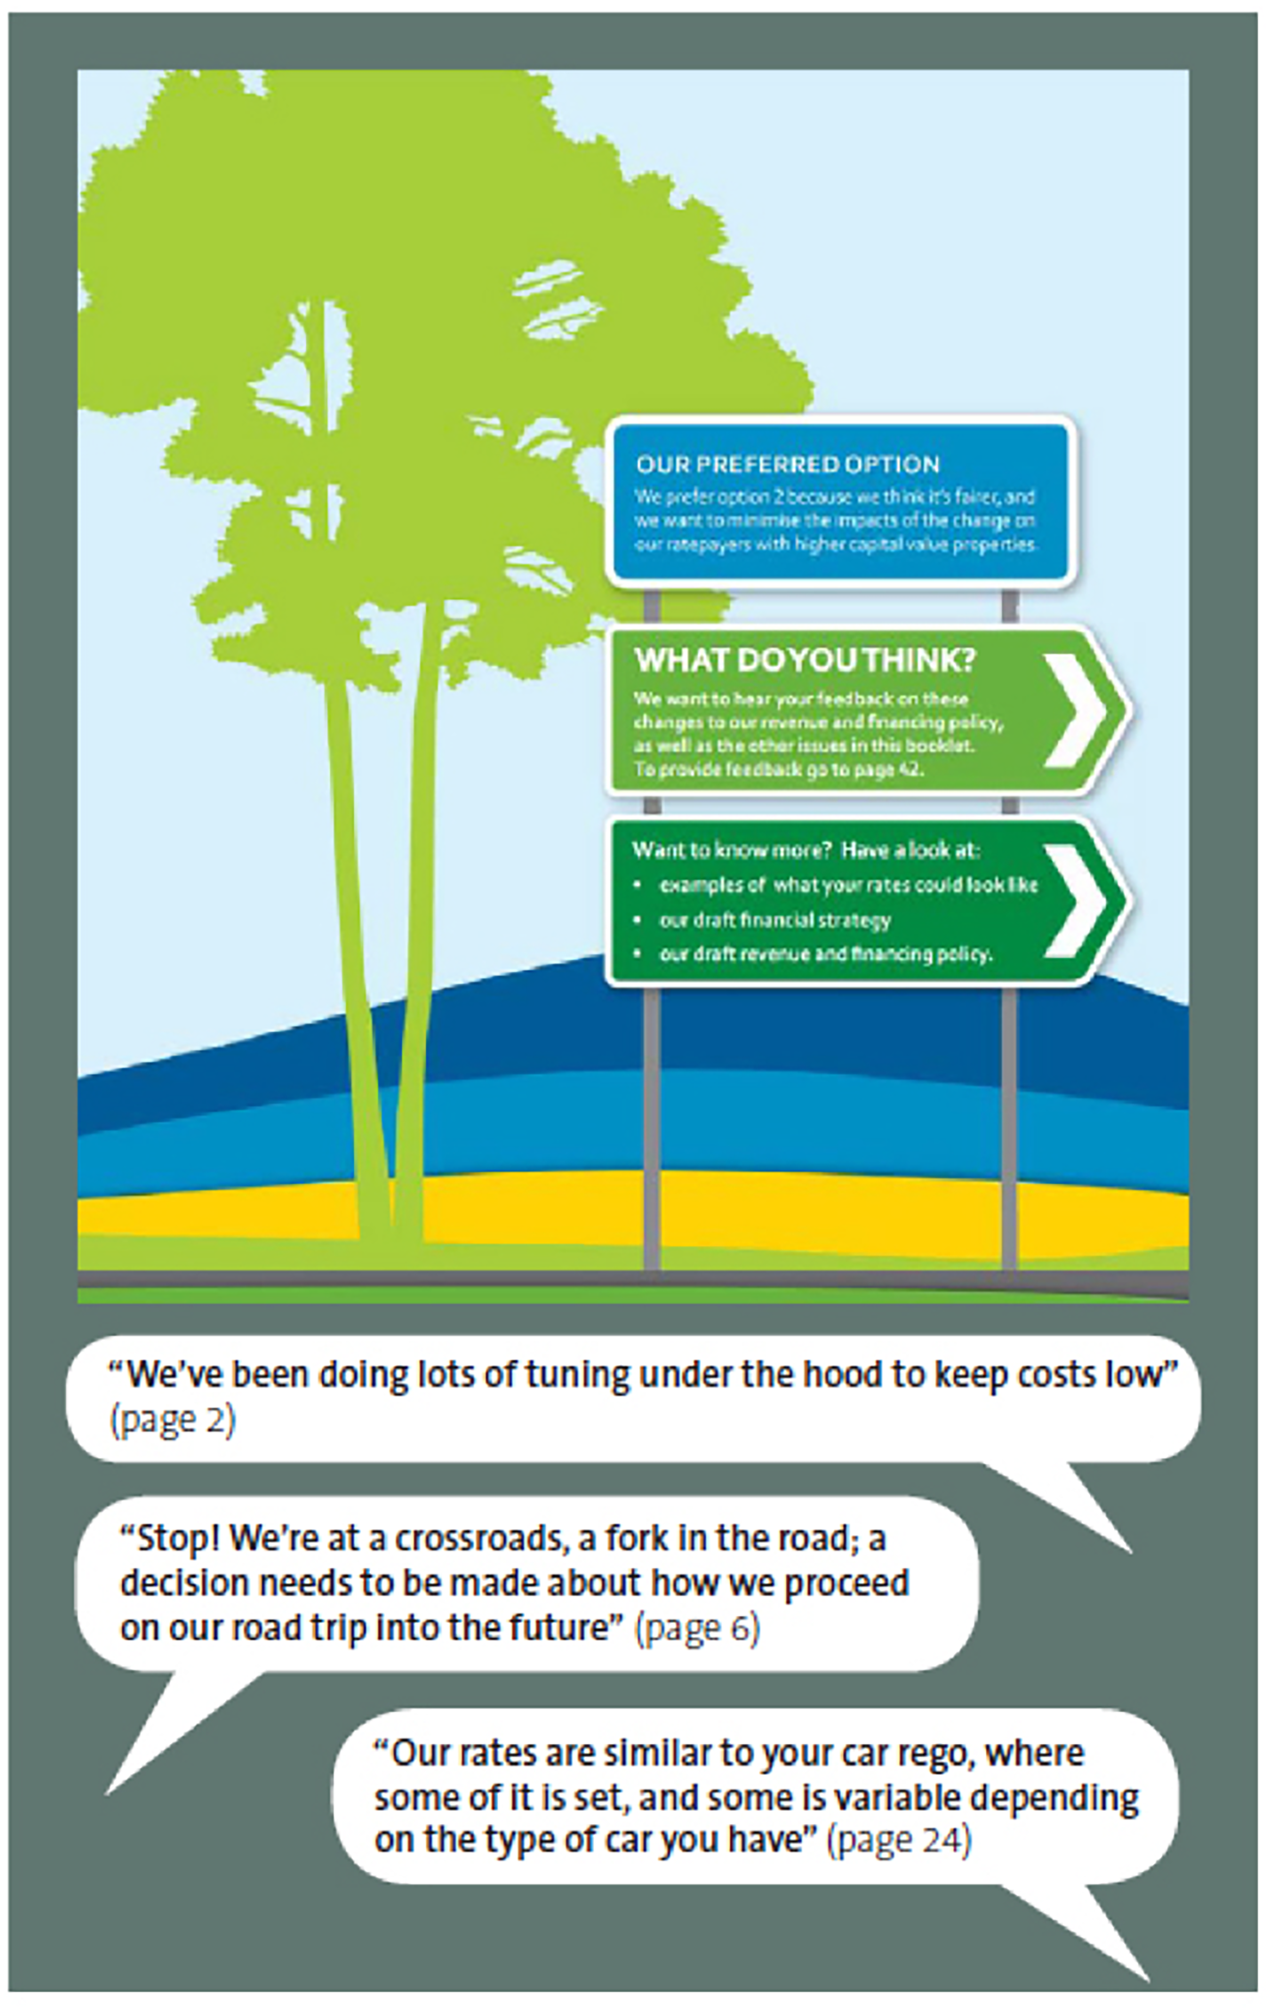
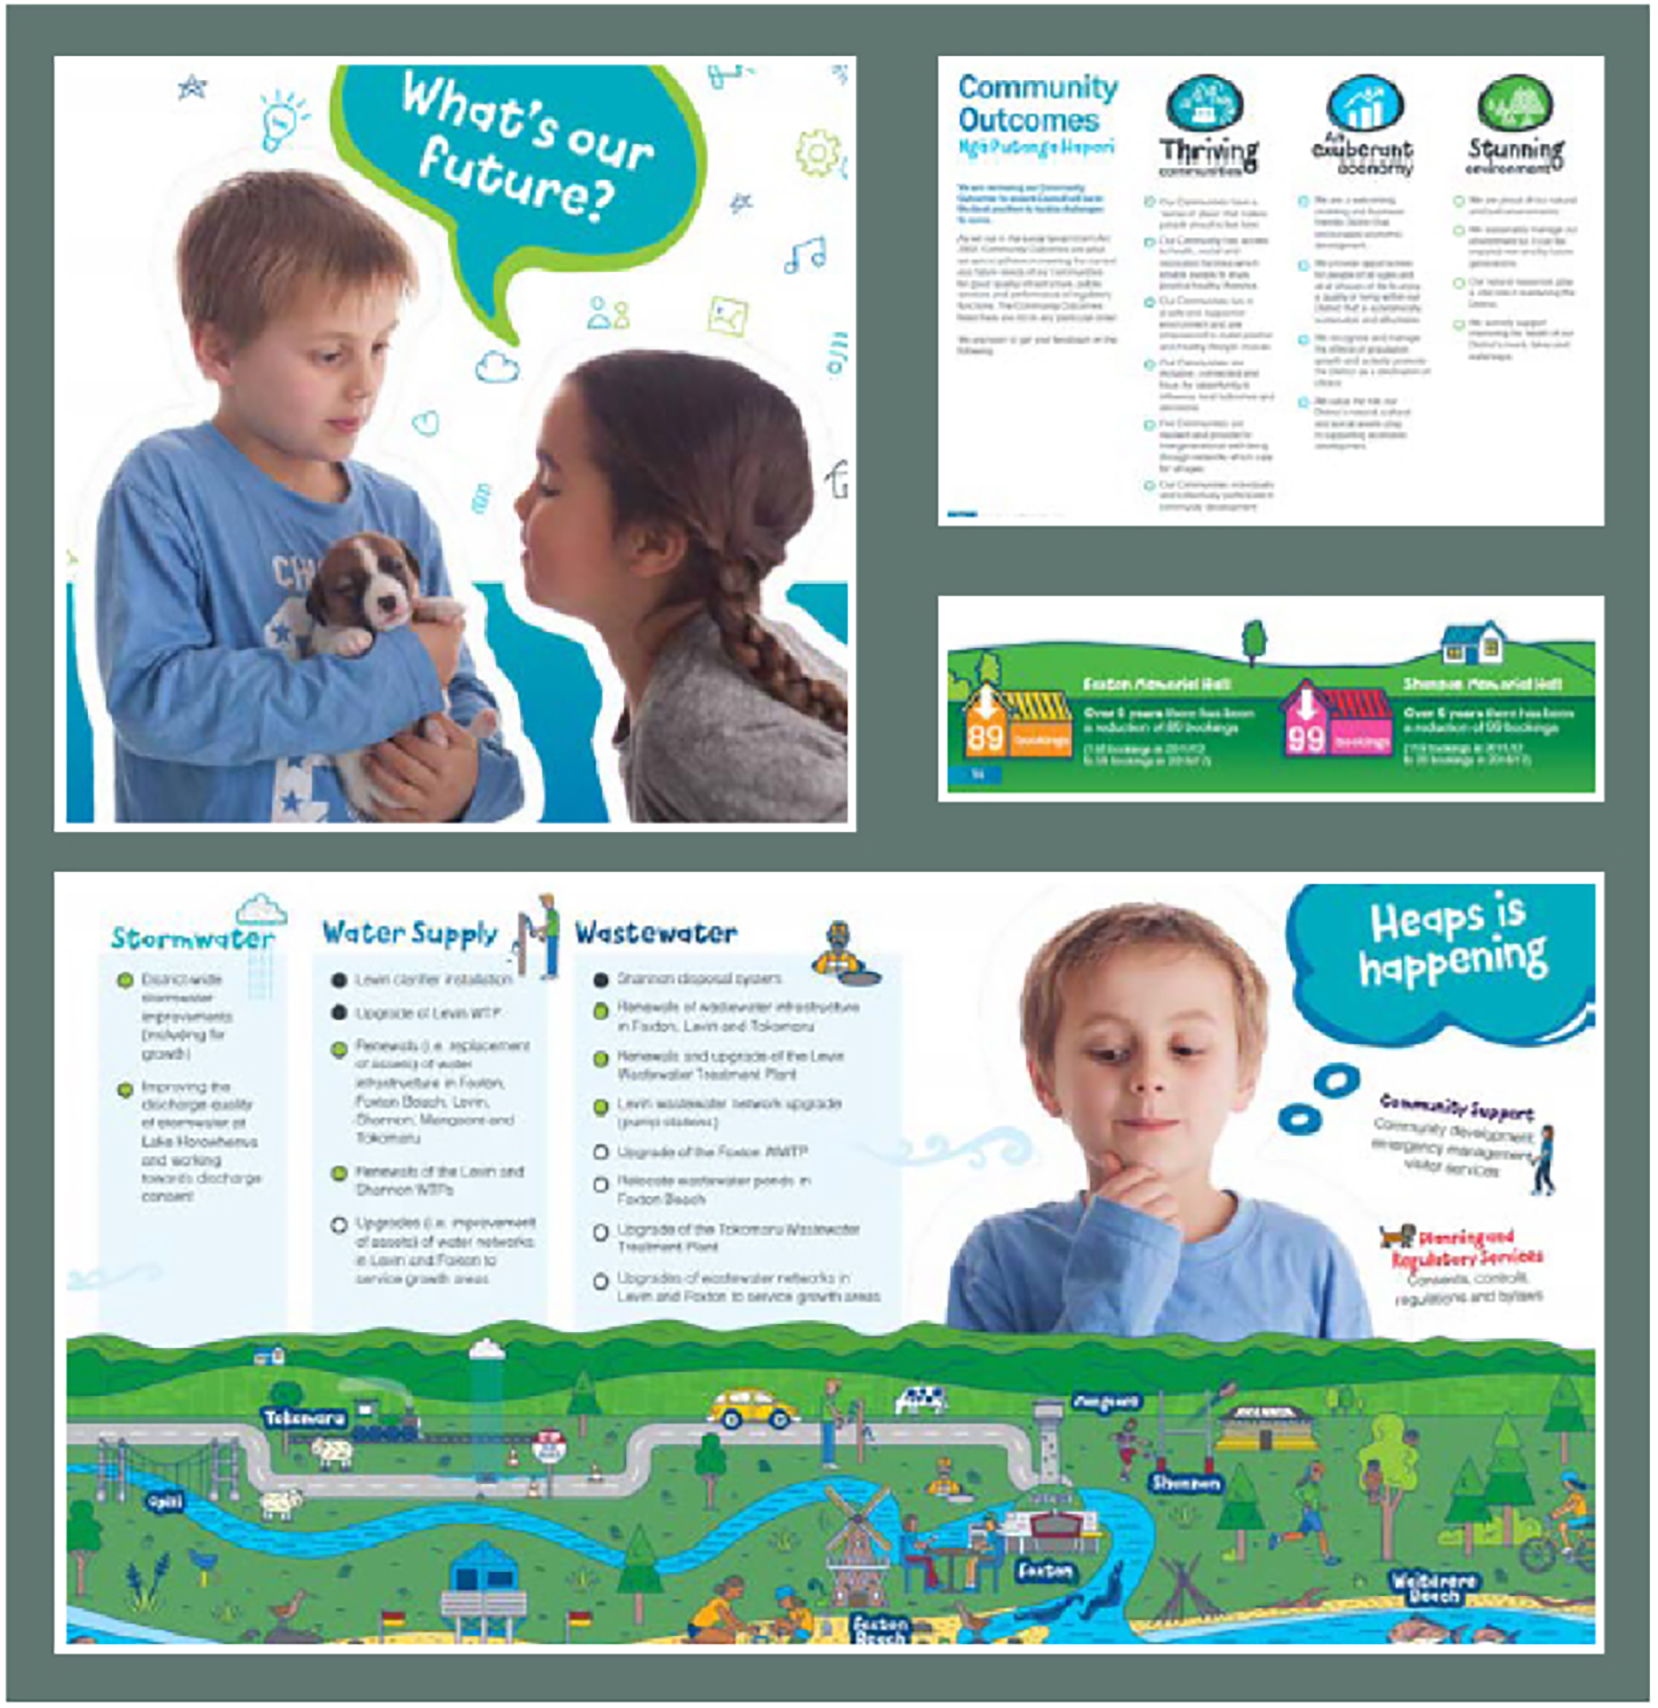
New Zealand Local Government Act legally requires councils to consult with their communities on their long-term plans. The consultation plan provides an effective basis for public participation in infrastructure decision-making associated with the long-term plan. It includes a fair representation of overall objectives, and how tax levels, debt, and levels of service might be affected by the intended plan and can be readily understood by interested or affected people. The Auditor General recently reviewed plans produced by communities across the country. Key findings highlighted aspects that help define good practice:
- Consultation documents present their information in a concise, readable and understandable way.
- Clear and unambiguous explanations on why proposed taxation and debt increases and significant changes in plans or intentions were considered “affordable” or “equitable” make consultation documents more effective.
- Some communities used a road-trip analogy throughout the document. The analogy makes technical subjects relatable without over-simplifying the issues.
- Some used a personalized approach that connected with people. For example, one uses two primary school children, Maia and Xander, who are pitched as the “champions of the Long Term Plan 2018-2038.”
By focusing on the inclusion of transportation customers, New Zealand municipalities are better able to address customer needs, inform customers of the actions they are taking, and refine work planning practices to address concerns critical to infrastructure operations and customer expectations.
4.1.3
Developing Life Cycle Strategies
Most transportation infrastructure assets have long service lives, lasting years or decades. Making decisions based on short-term performance without an understanding of the long-term cost effectiveness usually leads to higher future costs. Through life cycle management, agencies can develop strategies for maximizing their ability to meet both short- and long-term goals with available resources.
TAM Guide Book Club #3: Life Cycle Planning and Management
Adopting life cycle management can often achieve desired performance levels at lower life cycle costs than traditional strategies. Improved performance comes from analyzing the impact of various sequences of treatments on the future performance and costs of an asset class or subclass. By comparing the costs and benefits of long-term sequences of treatments, agencies can develop life-cycle strategies which provide the best practical long-term performance at lowest practical long-term costs. The implementation of life cycle strategies also enables an agency to better address its stewardship responsibilities and improve the alignment between agency investments and priorities.
By establishing sound long-term strategies, agencies can minimize the life cycle costs of preserving assets, while also managing asset performance to a defined target, the extent practicable with available resources. While strategies with a short-term outlook may provide better short-term performance, they can greatly increase the risk of higher future costs.
Whole-Life Approach to Asset Management
U.S. DOT
When developing long-term strategies, it is important to differentiate between the primary asset, with a long service life, and elements or components of that asset, that may be repaired or replaced to allow the primary asset to achieve its design life. In the case of pavements, the pavement structure may require several wearing surface replacements, either through overlay or removal and replacement of the wearing surface, to ensure the pavement structure lasts as long as intended. For assets such as bridges or signal installations structural elements or functional components may be repaired or replaced multiple times within the service life of the primary asset. In almost every case the failure to perform these maintenance and preservation actions, or failure to perform them at the appropriate time will lead to reduced service life of the primary asset.
When determining the appropriate treatment for a long-life asset, it is important to understand the root cause of the condition being prevented or corrected. Inexpensive treatments that address the visible or measured condition without addressing the cause of the distress are not cost effective. Examples of such treatments include:
- Thin overlays of asphalt pavements that are displaying structural cracking.
- Painting corroded structural steel members without proper surface preparation.
- Filling leaking bridge joints without proper materials or preparation.
While such treatments may, in some specific circumstances, be needed to provide minimal function or safety until a more substantial repair can be made, they should not be considered part of an optimal life cycle strategy.
Treatments made to achieve or extend the service life of these assets can also address changes in conditions or assumptions that have occurred since the asset was designed and constructed. Examples of these types of treatments include seismic retrofitting or applying scour protection to bridges, or increasing the hydraulic capacity of corrugated culverts by relining with smooth interiors. Each of these treatments reduces the risk of premature failure to an extreme event, and may at the same time address other structural or functional needs, without replacing the primary asset or changing its functional nature, i.e. increasing traffic-carrying capacity.
Life Cycle Strategies in Construction and Design Stages
Transportation infrastructure assets are expected to provide agencies with a desired level of performance over their design lives. To ensure the desired performance is achieved, decision-makers should consider factors that impact asset service life and future costs at the time of construction. This is commonly performed as part of the project development process to select a preferred design alternative. Factors to forecast should include design criteria, constraints, standards, and risks.
- Traffic
- Environmental and climatic conditions
- Material properties
- Design standards
- Operational constraints
- Construction practices
- Climate change
- Changing customer expectations
- Regional, state and national travel pattern changes
- Advancing technology
Because these factors contribute to asset performance, deterioration and the continued functionality of the asset, they must be considered when developing life cycle strategies in early and later stages of asset life. Life cycle strategies are based on an understanding of how these factors contribute to the rates of deterioration, how well the asset will accommodate future requirements and which treatments are effective in addressing deterioration or slowing the rate at which the asset deteriorates or underperforms.
Operation, Maintenance, and Rehabilitation Strategies
Treatment strategies consider how the asset, once constructed, will be managed to ensure it attains its design life, while maintaining the desired level of functionality. Special consideration should be given to long-life assets. There are three primary reasons short-term strategies are inefficient for long-life assets:
- As long-life assets age, deterioration accelerates, and there is greater risk of performance failing to meet current needs.
- As deterioration increases, the cost of treatments addressing deterioration tend to increase exponentially.
- Inexpensive treatments that restore condition but do not address the root cause of the deterioration will fail prematurely, leading to higher future costs.
These factors are reflected in Figure 4.4, which illustrates these concepts using a generic asset deterioration model. As shown in the figure, the average cost of treatment increases substantially as assets age. Additionally, the rate of deterioration tends to accelerate as assets age. Long-term strategies that use low-cost treatments early in an asset’s life cycle tend to improve asset condition very cost-effectively by deferring the need for most costly repairs.
Figure 4.4 Example Showing the Cost of Deferred Treatments
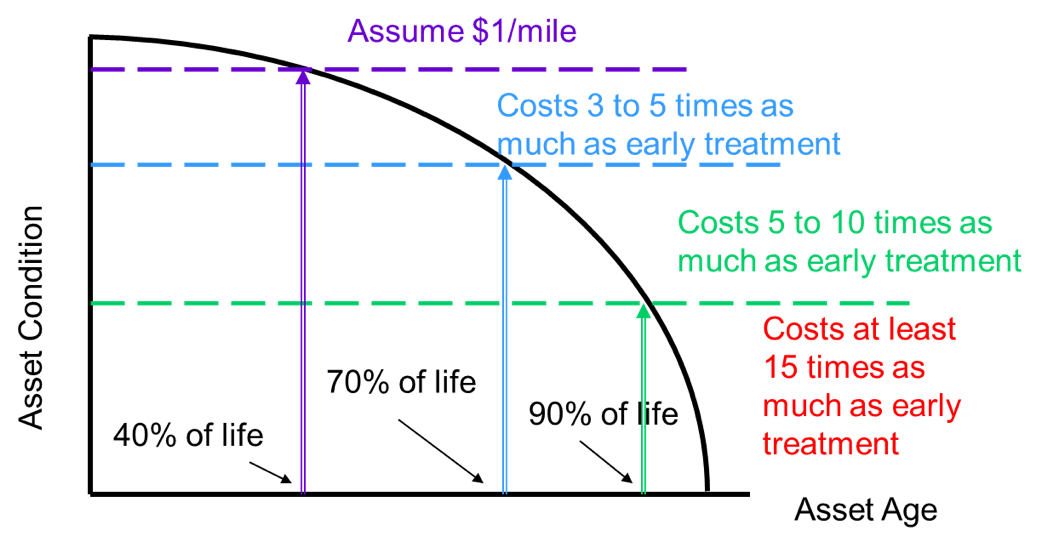
Source: Applied Pavement Technology, Inc. 2018
South Dakota DOT
To analyze the benefits of potential actions at the network level, South Dakota DOT (SDDOT) uses incremental benefit cost (IBC) analysis and deterioration models to determine the combination of feasible reconstruction, rehabilitation, and preventative maintenance treatments and timing at the network level that will give the best overall pavement and bridge conditions at the lowest practicable life cycle cost.
IBC analysis is used to answer a series of two important questions regarding pavement section treatments: Should the section be improved now, and if so, what is the best improvement to make? SDDOT’s IBC analysis process answers this set of questions by determining the combination of feasible reconstruction, rehabilitation and preventative maintenance treatments and timings that will use the anticipated state funds to yield the optimal overall asset conditions on the state highway network over a 20-year analysis period and the best long-term value to the system users (SDDOT TAMP, 2018).
Source: http://www.sddot.com/resources/reports/SDDOT2018TAMPFHWASubmittal.pdf
Considering Transformational Changes in Life Cycle Management
Life cycle management requires an understanding of past performance to predict future performance and plan appropriate actions. However, as technology advances and society’s needs change, the inputs and objectives of life cycle management need to adapt. Technology can lead to new materials or techniques that allow agencies to get longer life from existing assets. However, technology can also lead to broader societal changes that may make the need for some assets obsolete. Similarly changes in standards and regulations, may make it necessary to replace or update some assets prior to the planned ends of their service lives. Asset managers should regularly review their assumptions about anticipated asset service lives, consider new treatment options, and adjust to technological and regulatory trends and adjust the life cycle approach accordingly. Much of the information to support this effort can be found in agency’s long-term planning documents, as discussed in Chapter 2.
TAM Webinar #49 - Improving Your Next TAMP Miniseries: Improving Life Cycle Planning and Management
Incorporating Resilience in Life Cycle Strategies
Environmental changes such as extreme weather, temperature rise, sea level change, and changes in other environmental conditions can threaten transportation infrastructure. Even when these changes don’t increase the risk of failure, they can require infrastructure owners to change their strategies for managing assets. This is particularly important for long-life infrastructure assets such as bridges, pavement, culverts, and geotechnical assets.
Resilience is the term used to describe an asset’s ability to withstand environmental changes. Resilience can be considered at all stages of an asset’s life and should be an integral aspect of any life-cycle strategy.
FHWA developed the Adaptation Decision-Making Assessment Process (ADAP) as a tool for planners and designers to address resilience in the design of infrastructure projects. While ADAP was developed to be used on a project-by-project basis, it can also be applied to the development of a lifecycle strategy. Figure 4.5 shows the 11 step ADAP process. The key difference between applying the ADAP process to developing a life-cycle strategy, as compared to a project, is in step 1. Understand the site context. When applied to a project this step is focused on a specific physical location, bounded by the project limits. When applied to developing a life-cycle strategy, the site context will likely be broader to an area that is expected to be subject to a given environmental change, such as increasing seasonal temperatures, or sea level rise. Once the proper context is established, the process steps can be followed to evaluate potential strategic adjustments that will allow life cycle management practices to account for the anticipated effects of the environmental change.
Figure 4.5 Decision Tree of the ADAP Steps
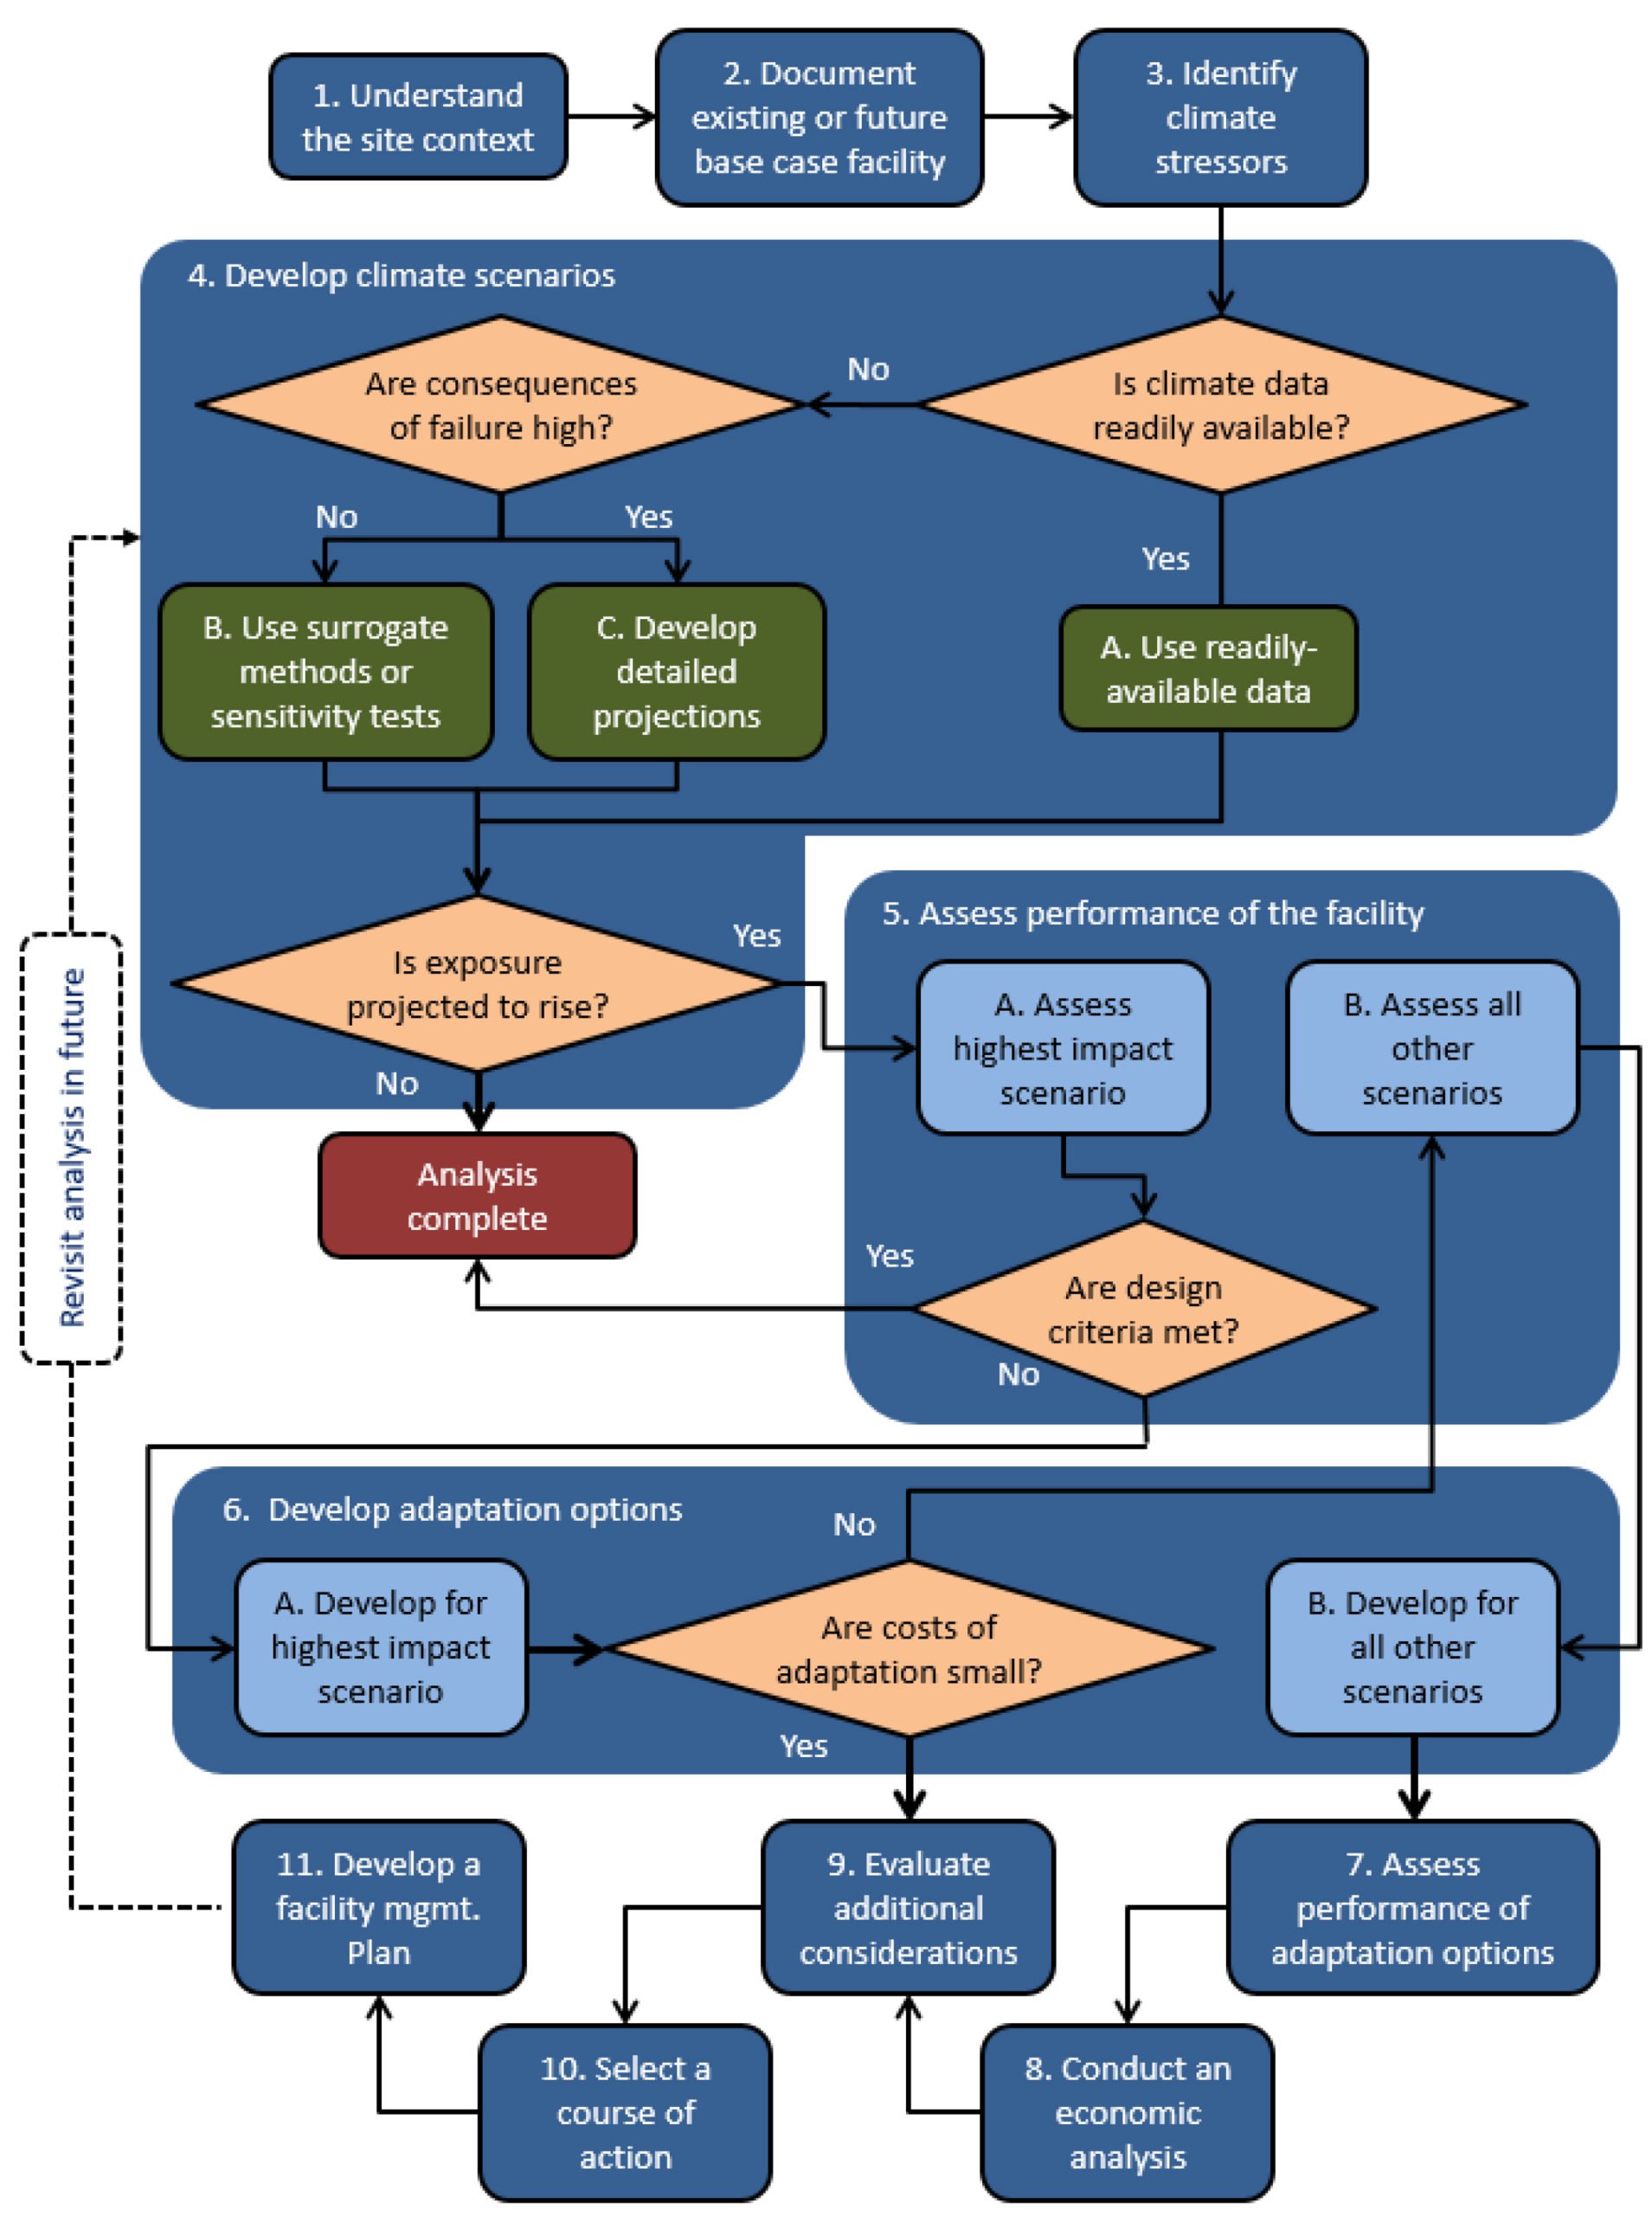
Source: FHWA. 2016. TEACR Engineering Assessment. Adaptation Decision-Making Assessment Process (ADAP). FHWA-HEP-17-004
New York State DOT
In 1994, New York State DOT (NYSDOT) determined that it needed to modernize its bridge designs to have longer service lives to help reduce future rehabilitation and replacement costs. Prior to this effort, the agency designed bridge decks to for a 50-year service life with a planned rehabilitation at year 35. The goal for this effort was to double the bridge deck design life to 100 years with a planned rehabilitation at year 75. The NYSDOT Materials Bureau investigated the major causes of bridge deck deterioration and determined that the primary cause of failure was corrosion of the reinforcing steel due the intrusion of chlorides from winter maintenance activities. Upon further investigation, it was determined that the chlorides were penetrating the bridge decks both through cracks and the natural porosity of the concrete. As a result of this research, the agency began a research and development effort to design a new standard concrete mix design that had lower permeability, higher resistance to cracking, and was pumpable to support standard bridge deck construction practices.
The result of the Materials Bureau’s effort became NYSDOT’s “Class HP” concrete, which utilizes fly ash (a byproduct of electric power production) and micro silica (a byproduct of electric arc furnaces used in manufacturing) to replace some of the Portland cement in its standard bridge deck concrete. These new materials are finer in size than cement particles, resulting in well graded denser packing of particles in the concrete, which reduces permeability. Class HP also creates less heat while it cures (or hardens), which reduces the occurrence of thermal shrinkage cracks when the deck cools. In 1997, Class HP became NYSDOT’s standard concrete mix for bridge decks. By using a failure mode analysis to identify the primary causes for bridge deck deterioration, NYSDOT could use new materials technology to address those causes and significantly lengthen the design life of its bridge decks.
Maine DOT
Maine is a cold-weather state with soils that are susceptible to severe frost conditions during winter months. In cooperation with FWHA and its Transportation Engineering Approaches to Climate Resiliency (TEACR) effort, Maine DOT undertook a project to assess the impacts of changing climate on the performance of pavements and develop strategies to offset those changes. The study looked at anticipated changes in both temperature and precipitation over the course of the 21st century. The study followed the ADAP process as shown in figure 4.6. The study indicated that anticipated climatic changes will lead to moderate changes in pavement performance. The study identified both engineering and operational adjustments Maine DOT can adopt to address these changes. The full report can be found on FHWA’s website at: https://www.fhwa.dot.gov/environment/sustainability/resilience/ongoing_and_current_research/teacr/me_freeze_thaw/
Kentucky Transportation Cabinet (KYTC)
In the early 2000s, KYTC found that the cost of hot-mix asphalt (HMA) was increasing faster than its budget to maintain pavement conditions. In response, KYTC evaluated the feasibility of strategies that relied heavily on preventive maintenance overlays such as thin HMA overlays (< 1 inch), chip seals, cape seals, and slurry seals. KYTC found that while the costs of these treatments were substantially less than a traditional HMA overlay, their service lives were only marginally shorter. As a result, the agency began increasing the use of these treatments on its secondary system. As part of developing its risk-based TAMP in 2018, KYTC evaluated life cycle strategies, as shown in Figure 4.3 Analysis of KYTC Future Costs Under Two Strategies that expanded the use of preventive maintenance overlays to its parkway and interstate pavements. The analysis results led the agency to select a life cycle management strategy that maximizes the use of preventive maintenance overlays on secondary roads and parkways and increases their use on interstate pavements over time. As shown in Figure 4.3, this new life cycle strategy achieved conditions over the 10-year TAMP analysis period that would have cost an additional $644 million if they had continued to rely on traditional 1- to 2-inch HMA overlays. By implementing these improved strategies, KYTC has significantly reduced the risk that the infrastructure will reach an unsustainable cost to maintain in the future.
Source: KYTC Transportation Asset Management Plan, 2018. http://www.tamptemplate.org/wp-content/uploads/tamps/048_kentuckytc.pdf
Colorado DOT
Each year, the Colorado DOT must report to its legislature on the statewide highway infrastructure and the agency’s ability to meet those needs with available resources. This requirement is met through the Annual Infrastructure Deficit Report, which addresses pavements, bridges, and annual maintenance. The agency supports the annual maintenance portion of this report with its Maintenance Level of Service Measure, which rates the delivery of services in nine program areas in terms of a letter grade from A to D and F. The agency has used historic data to develop deterioration rates for each service area that estimate the resources needed to improve the maintenance level of service by a given amount over a specific time period. These estimates are summarized in the Report, which is in turn used by the Legislature and the DOT to establish the annual maintenance budget. The figure provides an example of information on MLOS in the 2016 Report. Once the targeted MLOS is established, maintenance funding can be allocated to ensure that agency priorities are met.
Colorado DOT Example of Funding Needed to Support Maintenance Levels of Service
Source: Colorado DOT. 2016. https://leg.colorado.gov/sites/default/files/cdot_smart_2017_presentation.1.pdf
Washington State DOT
When seeking to establish the connection between investments and performance across a wide range of assets or roadway attributes such as litter, vegetation height, drainage, or functionality it is helpful to relate all of the various measures of performance to a common rating scale. Washington State DOT has developed its Maintenance Accountability Process to establish the relationship between maintenance level of effort and the resulting level of service. The process rates conditions and services in seven areas using a common letter-grade system, or MLOS.
- Roadway Maintenance & Operations.
- Drainage Maintenance & Slope Repair.
- Roadside and Vegetation Management.
- Bridge & Urban Tunnel Maintenance and Operations.
- Snow & Ice Control Operations.
- Traffic Control Maintenance & Operations.
- Rest Area Operations.
Each group of services or conditions includes several performance measures, which are translated to the MLOS grades of “A” (highest performance), “B”, “C” (adequate performance), “D” or “F” (unacceptable performance). Applying the MLOS grades allows for a consistent means of rating performance across services and geographic regions. Letter grades can also be represented in photographs of facilities that meet the criteria for each condition state to support communications with stakeholder groups. The MLOS are outcome-based measures that allow the agency to predict the expected level of service that can be achieved based on anticipated budget and work planning decisions. By tracking maintenance expenditures and MLOS results annually, Washington State DOT is able to adjust its maintenance priorities and budgets to address system needs and stakeholder wants.
Source: https://www.wsdot.wa.gov/Maintenance/Accountability/
New Zealand Transport Agency
New Zealand Local Government Act legally requires councils to consult with their communities on their long-term plans. The consultation plan provides an effective basis for public participation in infrastructure decision-making associated with the long-term plan. It includes a fair representation of overall objectives, and how tax levels, debt, and levels of service might be affected by the intended plan and can be readily understood by interested or affected people. The Auditor General recently reviewed plans produced by communities across the country. Key findings highlighted aspects that help define good practice:
- Consultation documents present their information in a concise, readable and understandable way.
- Clear and unambiguous explanations on why proposed taxation and debt increases and significant changes in plans or intentions were considered “affordable” or “equitable” make consultation documents more effective.
- Some communities used a road-trip analogy throughout the document. The analogy makes technical subjects relatable without over-simplifying the issues.
- Some used a personalized approach that connected with people. For example, one uses two primary school children, Maia and Xander, who are pitched as the “champions of the Long Term Plan 2018-2038.”
By focusing on the inclusion of transportation customers, New Zealand municipalities are better able to address customer needs, inform customers of the actions they are taking, and refine work planning practices to address concerns critical to infrastructure operations and customer expectations.
U.S. DOT
When developing long-term strategies, it is important to differentiate between the primary asset, with a long service life, and elements or components of that asset, that may be repaired or replaced to allow the primary asset to achieve its design life. In the case of pavements, the pavement structure may require several wearing surface replacements, either through overlay or removal and replacement of the wearing surface, to ensure the pavement structure lasts as long as intended. For assets such as bridges or signal installations structural elements or functional components may be repaired or replaced multiple times within the service life of the primary asset. In almost every case the failure to perform these maintenance and preservation actions, or failure to perform them at the appropriate time will lead to reduced service life of the primary asset.
When determining the appropriate treatment for a long-life asset, it is important to understand the root cause of the condition being prevented or corrected. Inexpensive treatments that address the visible or measured condition without addressing the cause of the distress are not cost effective. Examples of such treatments include:
- Thin overlays of asphalt pavements that are displaying structural cracking.
- Painting corroded structural steel members without proper surface preparation.
- Filling leaking bridge joints without proper materials or preparation.
While such treatments may, in some specific circumstances, be needed to provide minimal function or safety until a more substantial repair can be made, they should not be considered part of an optimal life cycle strategy.
Treatments made to achieve or extend the service life of these assets can also address changes in conditions or assumptions that have occurred since the asset was designed and constructed. Examples of these types of treatments include seismic retrofitting or applying scour protection to bridges, or increasing the hydraulic capacity of corrugated culverts by relining with smooth interiors. Each of these treatments reduces the risk of premature failure to an extreme event, and may at the same time address other structural or functional needs, without replacing the primary asset or changing its functional nature, i.e. increasing traffic-carrying capacity.
South Dakota DOT
To analyze the benefits of potential actions at the network level, South Dakota DOT (SDDOT) uses incremental benefit cost (IBC) analysis and deterioration models to determine the combination of feasible reconstruction, rehabilitation, and preventative maintenance treatments and timing at the network level that will give the best overall pavement and bridge conditions at the lowest practicable life cycle cost.
IBC analysis is used to answer a series of two important questions regarding pavement section treatments: Should the section be improved now, and if so, what is the best improvement to make? SDDOT’s IBC analysis process answers this set of questions by determining the combination of feasible reconstruction, rehabilitation and preventative maintenance treatments and timings that will use the anticipated state funds to yield the optimal overall asset conditions on the state highway network over a 20-year analysis period and the best long-term value to the system users (SDDOT TAMP, 2018).
Source: http://www.sddot.com/resources/reports/SDDOT2018TAMPFHWASubmittal.pdf
New York State DOT
In 1994, New York State DOT (NYSDOT) determined that it needed to modernize its bridge designs to have longer service lives to help reduce future rehabilitation and replacement costs. Prior to this effort, the agency designed bridge decks to for a 50-year service life with a planned rehabilitation at year 35. The goal for this effort was to double the bridge deck design life to 100 years with a planned rehabilitation at year 75. The NYSDOT Materials Bureau investigated the major causes of bridge deck deterioration and determined that the primary cause of failure was corrosion of the reinforcing steel due the intrusion of chlorides from winter maintenance activities. Upon further investigation, it was determined that the chlorides were penetrating the bridge decks both through cracks and the natural porosity of the concrete. As a result of this research, the agency began a research and development effort to design a new standard concrete mix design that had lower permeability, higher resistance to cracking, and was pumpable to support standard bridge deck construction practices.
The result of the Materials Bureau’s effort became NYSDOT’s “Class HP” concrete, which utilizes fly ash (a byproduct of electric power production) and micro silica (a byproduct of electric arc furnaces used in manufacturing) to replace some of the Portland cement in its standard bridge deck concrete. These new materials are finer in size than cement particles, resulting in well graded denser packing of particles in the concrete, which reduces permeability. Class HP also creates less heat while it cures (or hardens), which reduces the occurrence of thermal shrinkage cracks when the deck cools. In 1997, Class HP became NYSDOT’s standard concrete mix for bridge decks. By using a failure mode analysis to identify the primary causes for bridge deck deterioration, NYSDOT could use new materials technology to address those causes and significantly lengthen the design life of its bridge decks.
Maine DOT
Maine is a cold-weather state with soils that are susceptible to severe frost conditions during winter months. In cooperation with FWHA and its Transportation Engineering Approaches to Climate Resiliency (TEACR) effort, Maine DOT undertook a project to assess the impacts of changing climate on the performance of pavements and develop strategies to offset those changes. The study looked at anticipated changes in both temperature and precipitation over the course of the 21st century. The study followed the ADAP process as shown in figure 4.6. The study indicated that anticipated climatic changes will lead to moderate changes in pavement performance. The study identified both engineering and operational adjustments Maine DOT can adopt to address these changes. The full report can be found on FHWA’s website at: https://www.fhwa.dot.gov/environment/sustainability/resilience/ongoing_and_current_research/teacr/me_freeze_thaw/