Section 5.2
Cross-Asset Resource Allocation Methods
The resource allocation process described in Section 5.1 can be applied to a specific asset type, or to multiple types of assets or investments. However, there are many challenges organizations face when making decisions about investments considering multiple types of assets and types of investments. Two basic approaches for helping determine how to allocate resources across asset types are defining performance targets and developing a structured prioritization process that quantifies achievement of multiple objectives.
5.2.1
Challenges in Cross-Asset Resource Allocation
Resource allocation decisions considering multiple objectives is difficult due to a variety of factors. Competing objectives, data limitations, and uncertainty complicate the resource allocation process.
In determining what work to perform across all assets, an agency is faced with the basic problem of multi-objective, cross-asset decision-making. Typically an agency must, either implicitly or explicitly, determine how to divide scarce resources between different asset types, and in so doing try to accomplish a variety of different objectives.
The basic process described in Section 5.1 is applicable whether the resource allocation process concerns a single asset or multiple assets. However, there are extra challenges inherent when dividing resources among multiple types of assets or types of investments. Making resource allocation decisions considering multiple objectives is made more difficult by a variety of challenges, including but not limited to:
Competing Objectives. Fundamentally, a transportation agency seeks to improve mobility while maximizing the safety of the transportation system, minimizing negative impacts to the environment and society, and making best use of limited funds and other resources. It is difficult to quantify these as well as other competing objectives and often hard to reach consensus on what achievements should be prioritized when determining how an agency measures the progress of different areas to support a decision.
Data Limitations. A structured approach to resource allocation requires data. Ideally, an agency has detailed, quantitative data on existing conditions, the scope of a proposed investment, and what the effects of an investment are likely to be. However, obtaining data and projecting future conditions can be costly, and the decision to proceed with an investment must sometimes be made before detailed data is available. Often it is necessary to use qualitative data or estimates in lieu of quantitative data.
Uncertainty. Transportation investments are intended to make improvements in the future, but there is always uncertainty concerning future asset and system conditions as well as how assets will perform and what external risks may impact the system.
Structuring the resource allocation process to address multiple types of assets or investments requires particular focus on two of the steps illustrated in Figure 5-1: Step 3 - Quantify Targets and Step 5 – Prioritize Investments. Different approaches to cross-asset resource allocation tend to focus on one or the other of these steps.
For instance, a process focused on defining targets is premised on the fact that most asset management systems model different asset classes separately, using different deterioration models, treatment rules and benefit calculations. Different systems and approaches are also used to analyze different types of investments. It is possible to perform separate analyses for each asset or investment type that consider what results will be obtained depending on the overall investment level or other variations in resource allocation. Decision makers can then review the results of the different analyses to determine how to allocate resources at a high level. Once an overall allocation is established, different approaches can be used for prioritizing investments by asset or investment type.
In contrast, with a process emphasizing prioritization, the focus is on identifying and prioritizing specific candidate investments. The prioritization approach helps determine which investment is most desirable considering the organization’s goals and objectives, and the predicted outcomes of the investment. In this case it is not necessary to perform asset-specific analyses, and it is possible to define projects that address multiple types of assets and investments that cut across predefined types. For example, a corridor project could include work on existing pavement and bridges, as well as intersection improvements that improve safety and mobility. However, an organization implementing a cross-asset prioritization approach must consider how to quantify its different goals and objectives, and explicitly weigh progress in one area versus another.
In practice, most agencies use an approach that involves both setting performance targets and prioritizing specific investments. The following subsections provide additional details on use of performance targets and multi-objective approaches, and provide examples illustrating emphasis on each of these areas.
5.2.2
Use of Performance Targets to Support Cross-Asset Resource Allocation
A basic approach allocating resources across multiple types of assets is to define a set of performance targets by asset type. Development of TAM performance targets should be supported by data and the life cycle management approach described in Chapter 4. A resource allocation process that includes multiple types of investments, such as safety and mobility, may incorporate other targets, as well.
Target-setting is the process of setting specific values that an organization expects to achieve for a set of performance measures. Target-setting is important within the broader area of performance management, introduced in Chapter 2. Setting performance targets is consistent with best practice in asset and performance management. In its Transportation Performance Management (TPM) Toolbox, FHWA describes the benefits of setting performance targets:
- Driving a conversation about current conditions and how to achieve future outcomes
- Creating a method for evaluating processes currently in place, particularly data quality and measurement definitions used by the agency
- Guiding the prioritization and allocation of resources
- Enabling assessment of strategy effectiveness by focusing on linking goals, objectives, and measures to policy and investment decisions
- Forming a powerful argument for additional or alternative investments
- Managing expectations by clarifying what outcomes are desired
It is important to note that an organization may set targets at a strategic, tactical or operational level to support different applications:
- A strategic target is one which an organization expects to meet at some future time and reflects the agency’s overall goals and objectives. For instance, an agency’s long-term target for overall pavement condition is an example of a strategic target.
- A tactical target is a value an organization needs to meet to help support its strategic targets. For instance, to support a high-level target for pavement condition, an agency might set a tactical target to perform a specific amount of repaving work per year in each district.
- An operational target is one that helps track the day-to-day performance of an organization, such as the average time to respond to an incident. Operational targets are often used to support continuous improvement in standard operating procedures and process improvement tracking and monitoring.
The TPM regulations initiated by MAP-21 have specific requirements for state DOTs and MPOs to set performance targets for NHS pavement and bridge conditions, as well as for other areas outside of TAM, such as mobility and safety. In these regulations, a target is defined as the value for a performance measure the agency expects to achieve given available funding, rather than a desired or aspirational value. The benefits of target-setting are equally applicable regardless of whether an agency is setting targets specifically to comply with FHWA requirements or for other purposes.
There is as strong tie between target-setting and resource allocation. A target can both inform what investments an agency needs to make and help communicate the expected results of an investment strategy.
When an agency sets strategic targets to support allocating resources, the process is typically iterative. For instance, an agency might first determine the desired level of performance that best supports its goals and objectives, such as the overall performance that would result from maintaining all assets in good repair or the desired level of service for a set of assets. It would then be necessary to determine the level of investment (or allocation of other scarce resources) required to support this level of performance. At least one—and potentially many—iterations are required for an agency to determine a target performance that is not only consistent with its goals and objectives but also attainable given available resources. At each step, it can be helpful to use predicted performance given a certain allocation of resources to help communicate investment trade-offs and guide decision making.
Once an agency sets its strategic targets, it can then set tactical and operational targets. Developing and tracking such targets allows for better assessment of the actions to be performed at different levels of the organization to support strategic targets, and whether the agency is on track to meet its strategic targets – also termed “line-of-sight integration of decision making.”
Key points in setting performance targets to support TAM resource allocation include:
- Targets should be consistent with agency goals and objectives. Absent a specific constraint on resources, an organization should allocate resources as required to support its goals and objectives. For investments in existing assets, this should follow the life cycle plans developed as described in Chapter 4. If resources are constrained, it may be necessary to revise the life cycle strategy followed for one or more asset classes to focus investment on specific areas, although this may result in higher costs or worse performance in other areas over time.
- Use management systems to support target development. Pavement, bridge, and other asset management systems provide robust tools for summarizing current conditions and predicting future conditions and performance. In setting performance targets, it is important an agency use the analytical capabilities these systems offer in order to develop targets supported by data using a documented, repeatable process. Management systems are useful tools to help the decision-making process, but should support the process, not define it. Establish the allocation process the agency wants, and find tools that help implement it.
- An agency may have different targets for different subsets of a network. Particularly with strategic targets set at a network level, it will generally be the case for some subsets of the network or different geographic areas that performance will exceed the overall target, while others will lag behind the target.
- Factors not considered in management systems can impact performance. While management systems can help determine realistic targets, a decision maker should note the simplifying assumptions these systems make and thus remain aware of additional factors that may impact performance. For instance, management systems typically assume treatment on an asset can be performed in a single decision period, and the resulting impact on performance is immediately observed. In reality, projects often require multiple years to complete and there may be significant lag between when funds are committed and a resulting change in performance is observed. Factors outside the scope of management systems may also impact performance, such as diversions for emergency events or variability in condition assessment data and deterioration rates.
TIP
In many ways, resource allocation is the culmination of other TAM processes. These next pages describe how outputs from other processes should inform resource allocation for data-driven decision making.
Colorado DOT
The budget-setting process used by CDOT and described in its 2018 TAMP is an example of a resource allocation process emphasizing use of performance targets to support cross-asset resource allocation. CDOT organizes its asset inventory into 11 different asset classes. Different management systems and approaches are used for each asset class to calculate current conditions and predict future performance given a specified budget and other data. The figure illustrates the asset classes and systems used to support analysis of each asset class as of 2018.
The measures used summarize conditions that vary by asset class. For instance, for pavement CDOT predicts percent of pavement with high, moderate, and low drivability life. For bridges, CDOT predicts percent of bridges in good/fair/poor condition based on the FHWA bridge condition measure. For maintenance and buildings CDOT predicts a level of service on a letter grade (A to F) scale.
On an annual basis CDOT performs a separate analysis for each asset class of existing conditions and predicted conditions for different budget scenarios. The manager for each asset class then presents a budget request and business case for the asset class in a workshop setting. Workshop participants, including the asset class managers and representatives from each CDOT region, then vote on the allocation of budget by asset class. The allocation serves as a recommendation to CDOT’s Transportation Commission, which is charged with adopting CDOT’s budget. Separate processes are used in each asset area to prioritize work once the budget is established.
Sources:
TAM Peer Exchange Presentation
CDOT Asset Classes and Analysis Systems
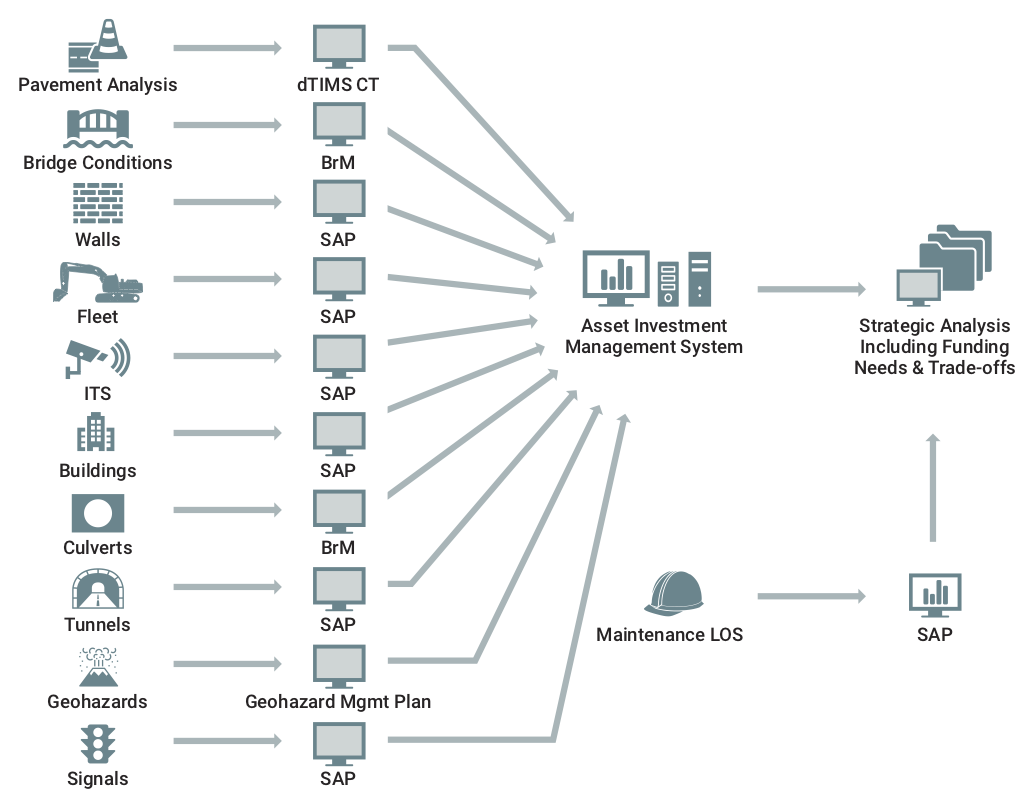
Source: William Johnson, 2018 FHWA TAM Peer Exchange
5.2.3
Use of Multi-Objective Decision Analysis for Resource Allocation
Multi-Objective Decision Analysis (MODA) can be used to prioritize specific candidate investments considering multiple, potentially competing objectives. Though this approach is data-intensive, it provides the means for evaluating investments that combine multiple types of assets or investments that help achieve multiple objectives.
TAM Guide Book Club #7: Investment Strategies and Multi-Objective Decision Making
In recent years, interest has increased in using MODA to improve approaches for prioritizing investments across asset classes and investment categories. The basic benefit of this approach is that it provides a structure for prioritizing investments outside the scope of any one management system, such as projects combining pavement, bridge and safety improvements. It also provides a means to compare asset management investments with other investments to improve mobility and achieve other objectives outside the scope of a typical asset management system.
This approach is, however, more data intensive and may result in simplification of the asset-specific modeling performed in a pavement or bridge management system. MODA tools and approaches are typically intended for application in analyzing specific candidate projects, and used for prioritizing investments for a single decision period. However, it is possible to adapt a MODA approach for cases where data are sparse or where groups of investments are analyzed rather than specific investments, or where longer decision periods are considered.
NCHRP Report 806: Guide to Cross Asset Resource Allocation and the Impact on Transportation System Performance presents a framework and prototype tool for implementing a MODA-based approach. Additional research through NCHRP Project 08-103 extended the framework and updated the tool. A checklist based on this work is included in this section; it outlines key issues for an agency considering improvements to its resource allocation approach to better account for multiple objectives across asset classes or investment categories.
North Carolina DOT
Since 2009, North Carolina DOT has used a structured approach to help prioritize capital investments across modes and asset classes. The initial version of the approach (Version 1.0) focused on prioritizing mobility and highway modernization projects supported by data on congestion, crashes and pavement condition. Over time the process evolved to include additional investment types and data. North Carolina’s Strategic Transportation Investments Law adopted in 2013 helped formalize the process, requiring that NCDOT allocate 40% of its available funds for mobility to Statewide Mobility projects that address congestion and bottlenecks, 30% of funds to projects with Regional Impact that improve connectivity within Regions, and 30% of funds to projects that address local needs. Different approaches are used for prioritizing investments in each mode (highways, aviation, bicycle-pedestrian, public transportation, ferry and rail) within each of these three groups. In Version 5.0 of the process, implemented in 2018, 24 different types of improvements are considered for highways. Candidate projects are scored in 10 areas, including pavement condition, considering a mix of existing conditions and predicted conditions as a result of the proposed project, as illustrated in the figure.
Highway Scoring - Eligible Criteria with P5.0 Measures
| Criteria | Measure | Existing Conditions | Project Benefits (Future Conditions) |
| Congestion | Volume/Capacity + Volume | ||
| Benefit/Cost | (Travel Time Savings + Safety Benefits)/Cost to NCDOT | ||
| Safety/Score | Critical Crash Rate, Density, Severity, Safety Benefits | ||
| Economic Competitiveness | % Change in Jobs + % Change in County Economy | ||
| Accessibility/Connectivity | County Economic Indicator, Improve Mobility | ||
| Freight | Truck Volume, Truck %, Future Interstate Completion | ||
| Multimodal | Multimodal Benefits | ||
| Lane Width | Existing Width vs. Standard Width | ||
| Shoulder Width | Existing Width vs. Standard Width | ||
| Pavement Score | Pavement Condition Rating |
Source: NCDOT. 2019. https://connect.ncdot.gov/projects/planning/MPORPODocuments/P5.0%20Master%20Presentation%20-%20July%202018.pdf
Caltrans
The approach for allocating funding within the Caltrans State Highway Operation and Protection Program (SHOPP) is an example of a “bottom-up” multi-objective, cross-asset resource allocation approach. The SHOPP funds repair, preservation, and safety improvements on the California State Highway System (SHS). The SHS is comprised of approximately 50,000 lane miles and the 2018 SHOPP will implement $17.96 billion in projects over four years. The SHOPP programming cycle results in a four-year program of capital projects that achieve the performance targets specified in the TAMP, consider the fiscal constraints, and address the needs identified in the State Highway System Management Plan.
In an effort to make the process more data-driven, Caltrans piloted a MODA approach to prioritize projects for inclusion in the SHOPP. The agency used the goal areas identified in their Strategic Plan (Safety and Health; Stewardship and Efficiency; Sustainability, Livability, and Economy; System Performance; and Organizational Excellence) and established criteria to evaluate projects across the five goals. In the initial pilot, Caltrans focused on obtaining the technical data necessary to evaluate how well each project progressed towards its goals. The agency is in the process of refining the approach based on the results of the pilot. They revised the goal areas to best account for all the activities included in the project. In addition, they represent each project score through a monetized benefit value, which addresses challenges related to scaling and weighting. With the revised approach, projects are scored based on the annual benefit of performing the project relative to deferring work for one decision period (two years). Benefits predicted using the approach are analogous to monetized benefits predicted using benefit/cost analysis tools and approaches, such as the Cal-B/C tool Caltrans uses to evaluate potential highway improvements. This approach leverages prior work performed to quantify the benefits of a proposed investment, and helps address issues with scaling and weighting different measures of benefit encountered in the initial pilot.
Sources:
TAM Peer Exchange Presentation
2018 SHOPP https://www.trb.org/Publications/Blurbs/180176.aspx
NCHRP 08-103, Preliminary Draft Final Report
Colorado DOT
The budget-setting process used by CDOT and described in its 2018 TAMP is an example of a resource allocation process emphasizing use of performance targets to support cross-asset resource allocation. CDOT organizes its asset inventory into 11 different asset classes. Different management systems and approaches are used for each asset class to calculate current conditions and predict future performance given a specified budget and other data. The figure illustrates the asset classes and systems used to support analysis of each asset class as of 2018.
The measures used summarize conditions that vary by asset class. For instance, for pavement CDOT predicts percent of pavement with high, moderate, and low drivability life. For bridges, CDOT predicts percent of bridges in good/fair/poor condition based on the FHWA bridge condition measure. For maintenance and buildings CDOT predicts a level of service on a letter grade (A to F) scale.
On an annual basis CDOT performs a separate analysis for each asset class of existing conditions and predicted conditions for different budget scenarios. The manager for each asset class then presents a budget request and business case for the asset class in a workshop setting. Workshop participants, including the asset class managers and representatives from each CDOT region, then vote on the allocation of budget by asset class. The allocation serves as a recommendation to CDOT’s Transportation Commission, which is charged with adopting CDOT’s budget. Separate processes are used in each asset area to prioritize work once the budget is established.
Sources:
TAM Peer Exchange Presentation
CDOT Asset Classes and Analysis Systems
Source: William Johnson, 2018 FHWA TAM Peer Exchange
North Carolina DOT
Since 2009, North Carolina DOT has used a structured approach to help prioritize capital investments across modes and asset classes. The initial version of the approach (Version 1.0) focused on prioritizing mobility and highway modernization projects supported by data on congestion, crashes and pavement condition. Over time the process evolved to include additional investment types and data. North Carolina’s Strategic Transportation Investments Law adopted in 2013 helped formalize the process, requiring that NCDOT allocate 40% of its available funds for mobility to Statewide Mobility projects that address congestion and bottlenecks, 30% of funds to projects with Regional Impact that improve connectivity within Regions, and 30% of funds to projects that address local needs. Different approaches are used for prioritizing investments in each mode (highways, aviation, bicycle-pedestrian, public transportation, ferry and rail) within each of these three groups. In Version 5.0 of the process, implemented in 2018, 24 different types of improvements are considered for highways. Candidate projects are scored in 10 areas, including pavement condition, considering a mix of existing conditions and predicted conditions as a result of the proposed project, as illustrated in the figure.
Highway Scoring - Eligible Criteria with P5.0 Measures
| Criteria | Measure | Existing Conditions | Project Benefits (Future Conditions) |
| Congestion | Volume/Capacity + Volume | ||
| Benefit/Cost | (Travel Time Savings + Safety Benefits)/Cost to NCDOT | ||
| Safety/Score | Critical Crash Rate, Density, Severity, Safety Benefits | ||
| Economic Competitiveness | % Change in Jobs + % Change in County Economy | ||
| Accessibility/Connectivity | County Economic Indicator, Improve Mobility | ||
| Freight | Truck Volume, Truck %, Future Interstate Completion | ||
| Multimodal | Multimodal Benefits | ||
| Lane Width | Existing Width vs. Standard Width | ||
| Shoulder Width | Existing Width vs. Standard Width | ||
| Pavement Score | Pavement Condition Rating |
Source: NCDOT. 2019. https://connect.ncdot.gov/projects/planning/MPORPODocuments/P5.0%20Master%20Presentation%20-%20July%202018.pdf
Caltrans
The approach for allocating funding within the Caltrans State Highway Operation and Protection Program (SHOPP) is an example of a “bottom-up” multi-objective, cross-asset resource allocation approach. The SHOPP funds repair, preservation, and safety improvements on the California State Highway System (SHS). The SHS is comprised of approximately 50,000 lane miles and the 2018 SHOPP will implement $17.96 billion in projects over four years. The SHOPP programming cycle results in a four-year program of capital projects that achieve the performance targets specified in the TAMP, consider the fiscal constraints, and address the needs identified in the State Highway System Management Plan.
In an effort to make the process more data-driven, Caltrans piloted a MODA approach to prioritize projects for inclusion in the SHOPP. The agency used the goal areas identified in their Strategic Plan (Safety and Health; Stewardship and Efficiency; Sustainability, Livability, and Economy; System Performance; and Organizational Excellence) and established criteria to evaluate projects across the five goals. In the initial pilot, Caltrans focused on obtaining the technical data necessary to evaluate how well each project progressed towards its goals. The agency is in the process of refining the approach based on the results of the pilot. They revised the goal areas to best account for all the activities included in the project. In addition, they represent each project score through a monetized benefit value, which addresses challenges related to scaling and weighting. With the revised approach, projects are scored based on the annual benefit of performing the project relative to deferring work for one decision period (two years). Benefits predicted using the approach are analogous to monetized benefits predicted using benefit/cost analysis tools and approaches, such as the Cal-B/C tool Caltrans uses to evaluate potential highway improvements. This approach leverages prior work performed to quantify the benefits of a proposed investment, and helps address issues with scaling and weighting different measures of benefit encountered in the initial pilot.
Sources:
TAM Peer Exchange Presentation
2018 SHOPP https://www.trb.org/Publications/Blurbs/180176.aspx
NCHRP 08-103, Preliminary Draft Final Report