Section 7.1
TAM Information Integration
This section discusses the different information systems in a transportation agency and the need to connect data across these systems to provide an integrated view of information. It provides an overview of how to plan for system integration efforts – recognizing key integration points and data flows. It ends with a discussion of integrating data across the TAM life cycle.
7.1.1
TAM Data and Systems
Often organizations maintain data on inventory, condition and needs for individual asset classes in separate, self-contained systems. However, increasingly it is necessary to integrate asset and related data distributed across multiple systems to support decision-making.
As discussed in Chapter 6, there are several different types of information needed for TAM decision making. These include:
- Asset inventory and design information including location, type, quantity, material, and design details. This also includes summary level information about the asset as a whole as well as information about individual asset components (e.g. different pavement layers or bridge elements). It may also include asset valuation information (calculated based on deteriorated replacement cost, historic cost, or fair market value).
- Asset condition and performance information including results of visual inspections, measured condition (such as roughness or cracking for pavements), and computed measures of performance (such as remaining service life or “deficient” status designation). This also includes aggregated network level measures (such as the percentage of pavement in good condition).
- Contextual information such as system or network characteristics, functional classification, highway geometric characteristics, traffic volumes, congestion and reliability, crash history, adjacent land uses, weather and features of the natural environment. This information is helpful for understanding factors that may impact the asset service requirements or goals, physical deterioration, funding eligibility, and/or project needs and constraints.
- Work information including date, cost and scopes of work proposed, scheduled and completed on assets – including installation, replacement/reconstruction, rehabilitation, preservation and maintenance. When projects include multiple assets, it is valuable to itemize the work performed by asset.
- Revenue and funding allocation information including historical and forecasted funds available for asset installation, replacement/reconstruction, rehabilitation, preservation and maintenance – by source; and historical allocations by asset category and work type.
- Analysis information including forecasted condition and needs under varying funding or program scenarios, treatment life or life extension results, or project prioritization ratings or rankings.
Agencies store and manage TAM-related data within several different information systems:
- Asset Management Systems (AMS) – this includes pavement management systems (PMS), bridge management systems (BMS), management systems for other specific asset classes (sign or signal management systems), and systems used to manage information for multiple asset classes. All of these systems are used to store inventory and inspection data, and track work performed on an inventory of assets. They also typically include contextual information needed for modeling and analysis, such as traffic, functional classification, number of lanes, and presence of a median. More advanced management systems may identify and forecast preservation and rehabilitation or replacement needs, and analyze funding scenarios. However, often agencies use multiple systems for this purpose, with separate systems for maintaining the asset inventory and predicting future conditions. Pavement and bridge management systems are typically used as the sources for federal Highway Performance Monitoring System (HPMS) and National Bridge Inventory (NBI) reporting.
- Maintenance Management Systems (MMS) – used to plan and track routine maintenance activities. These systems typically store information about planned and completed maintenance activities and resources (labor, materials, equipment) consumed. MMS may include customer work requests, work orders, and maintenance level of service (LOS) information. Some MMS do not store any asset inventory data. In such cases, work is tracked by maintenance activity category and route section rather than specific asset. Note that there are many commercial Asset Management Systems that provide full functionality for asset inventory, inspection/condition assessment, work planning, and work tracking.
- Program and Project Management Systems (PPMS) – used to manage information about capital and major maintenance projects from initial planning and programming through completion. There may be separate systems for managing programming/funding information, preconstruction/design information and construction phase information. Some agencies integrate data from these various systems to obtain a single source of project information. Project information typically includes a mix of tabular data as well as unstructured data (for example, documents and images). Unstructured data may be managed within an engineering content management system separately from other data.
- Financial Management Systems (FMS) – used to manage and track revenues, expenditures, budgets, grants, payments, receipts, and other financial information. These systems are often supplemented with special purpose tools supporting budgeting, revenue forecasting and analysis.
- Enterprise Resource Planning Systems (ERP) – incorporate features of financial systems as well as a wide variety of other modules for functions including human resources, payroll, purchasing, maintenance management, inventory management, equipment management, project programming, project financial management, and revenue forecasting.
- Highway Inventory Systems (HIS) – used to store and report administrative and physical characteristics of the roads and highways. Federal Highway Performance Monitoring System (HPMS) requirements and the Model Minimum Inventory of Roadway Elements (MIRE) define standard road inventory elements; some DOTs maintain additional elements. HPMS elements include pavement type, pavement condition (roughness, cracking, rutting and faulting), and structure type. These systems may include Linear Referencing System (LRS) management capabilities or, may be integrated with a separate LRS management system. Per FHWA’s All Roads Network of Linear Referenced Data (ARNOLD) requirements, state DOTs must submit an LRS for all public roads to FHWA, linked to their HPMS data.
- Crash Data Systems (CDS) – used to store and report data about collisions and resulting injuries and fatalities; which when combined with traffic data and road inventory data provides information for identifying traffic and safety asset needs.
- Traffic Monitoring Systems (TMS) – used to store and report traffic data, required for federal reporting and used for a wide variety of purposes, including TAM processes for asset deterioration modeling, treatment selection and prioritization.
- Engineering Design Systems (EDS) – used to create design drawings or models including design details for different assets. As agencies adopt 3D object-based design modeling practices, there are opportunities to share information about assets between design models and other asset data systems used across the life cycle.
- Enterprise Geographic Information Systems (GIS) – used to manage spatial information, including asset location. Assets may be represented as point, linear or polygon features; location may be specified based on coordinates and/or based on a linear referencing system (LRS). Asset features maintained within GIS may be linked to asset information within other systems.
- Imagery Databases (ID) – used to store highway video imagery and mobile LiDAR data that can be used for manual or semi-automated extraction of asset inventory.
- Data Warehouses/Business Intelligence Systems (DW/BI) – used to integrate data from source systems for reporting and analysis. These may be tailored for TAM decision support.
- Other – there may be other specialized decision support tools that produce analysis results – for example, tools for life cycle cost analysis, cross-asset optimization, or project prioritization.
TIP
Taking stock of what data and information systems supporting TAM is a critical first step to take before pursuing data integration and system development initiatives.
Table 7.1 provides an overview of different systems with the types of information they typically contain. Note that this may vary within each agency.
Table 7.1 - TAM Data and Systems Overview
| Asset Inventory, Condition, and Performance | Contextual | Asset Work Information | Revenue and Funding Allocations | Analysis Results | |
|---|---|---|---|---|---|
| Asset Management Systems | • | • | • | • | • |
| Maintenance Management Systems | • | • | • | • |
|
| Program and Project Management Systems | • | • | • |
||
| Financial Management/ERP | • | • | • | ||
| Road Inventory Systems/HPMS | • | • | • | • | |
| Crash Databases | • | ||||
| Traffic Monitoring Systems | • | ||||
| Engineering Design Systems | • | ||||
| Enterprise GIS Databases | • | • | • | • | |
| Imagery Databases | • | ||||
| Data Warehouses/BI | • | • | • | • | • |
| Other | • |
Common components included in computer-based asset management information systems are shown in Figure 7.1. Network inventory, network definition (e.g., location), and asset condition information serve as the primary components in a database, which may or may not be external to the management system. Agency-configured models are used to predict changes in asset condition over time and to determine what treatments are appropriate as the assets age and deteriorate. These models may be developed and updated based on historical condition and cost data.
When developing a computer-based model, an objective (performance, condition, financial, risk) must be defined within the model for it to evaluate these criteria to develop and select optimal strategies. Metrics such as benefit-cost, risk, condition and treatment costs are often used.
A typical pavement management system performs some type of benefit/cost analysis that determines the performance benefits (typically in terms of improved condition) and the costs associated with each possible treatment timing application. By selecting the projects and treatments with the highest benefit/cost ratio, an agency can demonstrate that it is maximizing the return on its investment.
Bridge management systems more typically rely on optimization to perform a single-objective analysis, such as minimizing life cycle costs or maximizing condition, or a multi-objective optimization analysis that considers factors such as condition, life cycle cost, risk of failure, and mobility. Project- and/or network-level benefit/cost analyses are used in a bridge management system to explore all feasible treatment options over an analysis to determine the most cost-effective set of treatments with the highest benefits to the network.
TIP
Start by defining what questions the agency wants to answer and then make a plan for how data across systems could be integrated to answer these questions.
Figure 7.1 Typical Management System Components
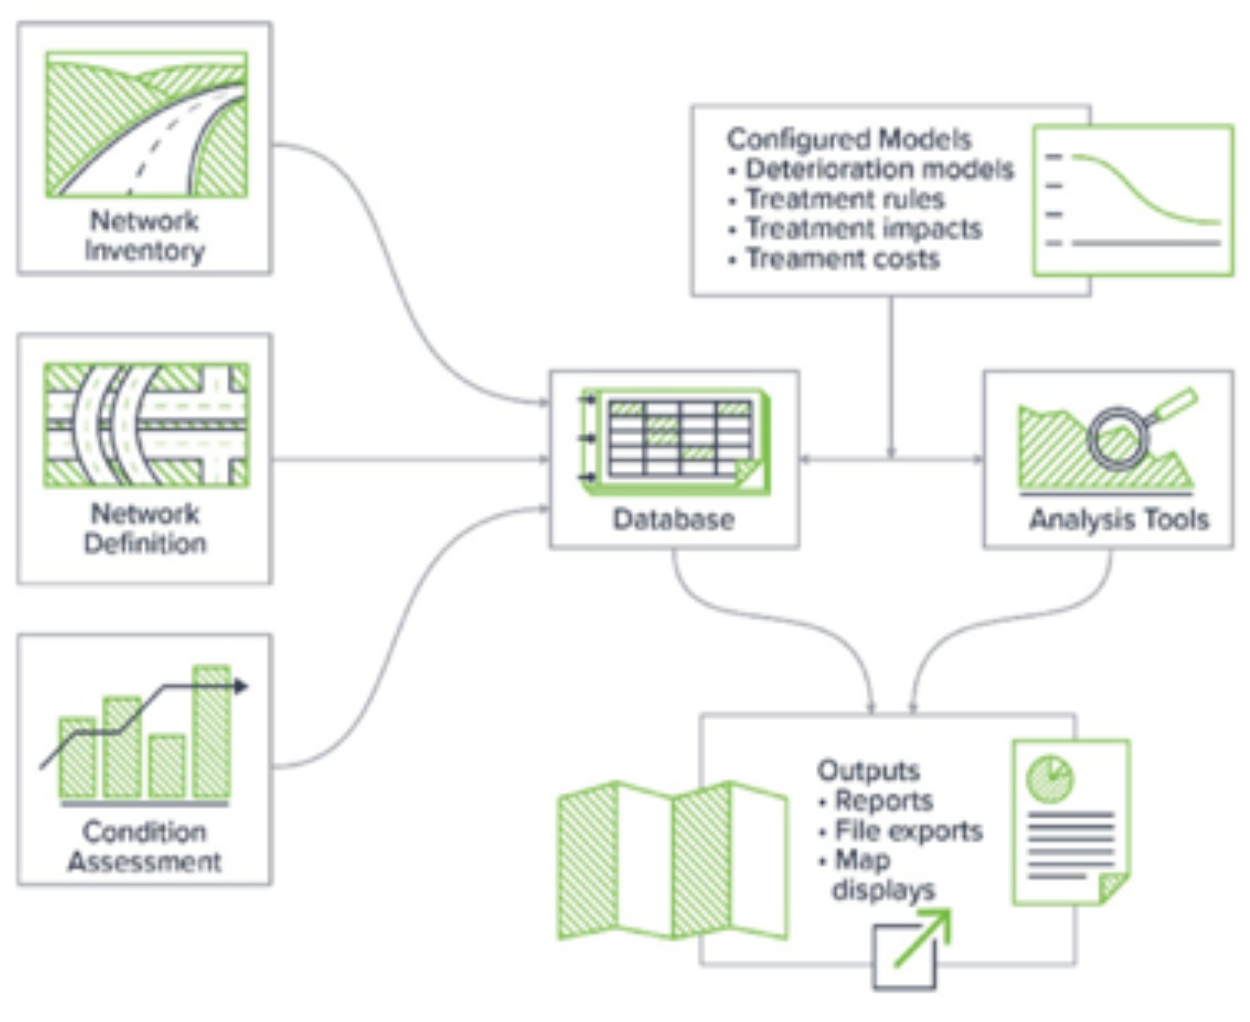
Source: Applied Pavement Technology, Inc. 2018.
Figure 7.2 shows an example of how the different systems listed in Table 7.1 might be integrated, adapted from the approach used by a U.S. state DOT.
Figure 7.2 Data Integration Example
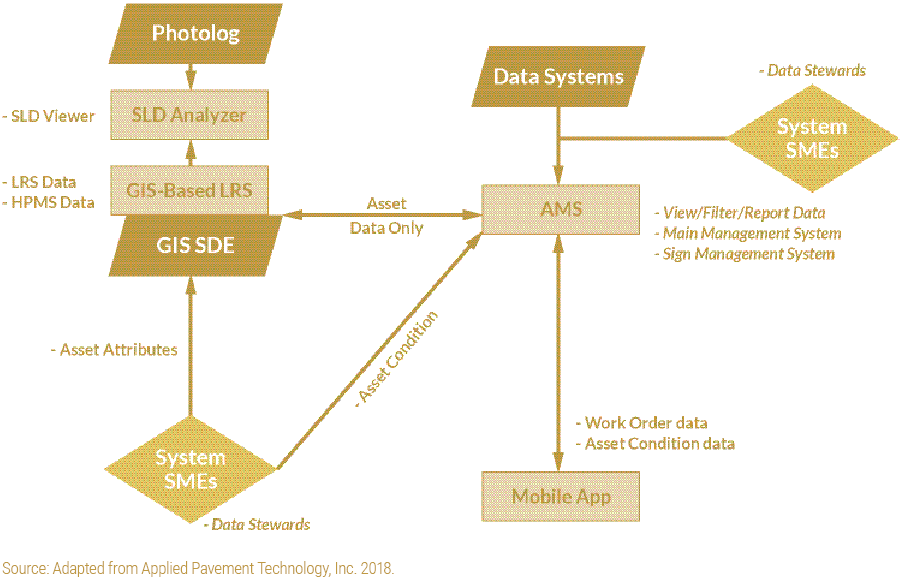
Source: Adapted from Applied Pavement Technology, Inc. 2018.
7.1.2
Why Integrate?
Integrated views of asset information enable insights that lead to better decisions. Information produced by one part of the agency can support decision making across the agency.
Linking information across different systems enables agencies to quickly answer important questions that might have taken hours of staff time without integrated data. Integrating data opens up access to previously siloed data sets across the organization. It allows an agency to reduce duplicative effort, achieve efficiencies and derive greater value from its data. Some questions that rely on integrated data are:
Investments and Accomplishments
- What have we spent over the past ten years on route X in county Y (across all assets and including both maintenance and rehabilitation)?
- What percentage of deficient pavements will be addressed by our current capital and major maintenance programs?
Work Costing and Scoping
- What does it cost us to restripe a mile of pavement markings in each district?
- What locations identified along the linear referencing system (LRS) are planned for next year?
- Do the costs estimated by our pavement management system match what we are actually seeing in our projects?
- If we upgrade our guardrails whenever we do a paving project, how long will it take, and what will it cost to eliminate the current backlog?
- How can we best plan our projects to address multiple needs that may exist along a corridor?
Performance
- How many years does our standard mill and fill pavement treatment last for roads in different traffic volume categories?
Tradeoffs and Prioritization
- How should we prioritize our asset replacement/rehabilitation projects, considering not only life cycle management strategies but also stormwater management, safety, congestion, non-motorized, transit and ADA needs?
- How should we allocate our available funds across multiple asset types?
Disaster Recovery
- What assets were on route X in county Y prior to the storm? What will it cost to replace them?
An integrated approach to asset data collection, management and reporting not only makes it easier to answer these questions; it also can reduce costs. Opportunities for achieving efficiencies include:
- Using a single application to manage information about multiple assets.
- Using Data Warehouse/BI and GIS tools to provide reporting and mapping functions rather than investing effort to develop these capabilities within individual asset management systems.
- Gathering data on multiple assets through the same approach – using mobile technology, video imagery and/or LiDAR (see section 7.2)
- Sharing asset data across the life cycle – for example, automating methods for extracting asset data from design plans to update asset inventories (described further below).
Emerging technologies and new data sources are making an integrated approach to asset data management even more important. For instance, there are increasingly opportunities to use data collected from cell phones and connected vehicles that may cut across many asset categories. Also, there has been and will likely continue to be rapid advancement in machine learning techniques, such as for extracting asset data from video imagery or predicting optimal maintenance interventions given a wide array of data. Using these techniques typically requires establishing large, integrated data sets.
In addition, advances in computer-aided design and engineering software are making it possible to integrate asset data across the life cycle and achieve efficiencies and cost savings in maintaining asset inventories. See the discussion in section 7.1.4 further on.
TIP
Integrating information systems can be approached incrementally. Have a long term goal in mind and find opportunities to move towards this goal as systems are upgraded or replaced.
Ohio DOT
Ohio DOT has separate pavement and structures management systems, but integrates both asset and project information within its Transportation Information Management System (TIMS). A separate Transportation Asset Management Decision Support Tool (TAM-DST) allows for a user to combine data from TIMS with other state-maintained data sets to perform analysis and reporting. The application allows for one to consume large quantities of data in a timely manner to help make better choices in planning. See practice examples in Section 2.2.4 and Section 6.2.1 for more information on TIMS.
7.1.3
Planning for TAM Information Integration
There are different levels of integration. In the short term, agencies can integrate the information they already have. In the longer term, agencies can modify and consolidate their information systems. Integrating data for TAM should be approached systematically to ensure agencies achieve a solution that meets their needs and is ultimately sustainable.
Step 1: Establish Requirements
What is the purpose of the integration? To create a publicly available map showing asset conditions and projects for both internal and public use? To create a BI environment for answering a range of questions about asset performance and cost? To integrate asset data across different systems used for planning, design, construction, and maintenance?
Based on the identified needs, determine what data will be integrated and at what frequency. Consider whether this will require historical data, current data, future projections, or a combination.
Early collaboration between business units and information technology units is important to establish a shared understanding of both business needs as well as technical requirements and constraints. A strong business-IT partnership is essential for successful information integration initiatives.
Step 2: Identify and Evaluate Data Sources
Identify the available data sources to meet requirements. Determine where the data reside, and in what form – such as engineering design systems, relational databases, spreadsheets, document repositories, etc. Assess the current level of data quality to make sure that the source is ready for integration, based on discussions with the data steward or through examining the data. For design files/models a key quality consideration is whether established standards have been consistently applied. It is also important to determine the level of spatial and temporal granularity – or what does each record represent (such as a pavement condition observation for a 0.1 mile section for April 2019; a paving project on a 1.5 mile section due to open for traffic sometime in 2020).
Step 3: Analyze Linkages
Identify how different data sources will be linked. Spatial linkages are a good place to begin. If GPS coordinates are used, make sure that the Coordinate Reference System (CRS) used is documented, along with positional accuracy. If a Linear Reference was used, determine what method was used to establish the measure along the route, and what version of the agency’s LRS was used to establish route identifiers and reference points. Find out if the linear reference has been updated to reflect changes in the LRS since the data were last collected (if applicable).
TIP
Set standards for how assets and work activities will be linked to GIS/LRS locations. Then create processes and tools to make sure these standards are followed.
Identify other types of (non-spatial) linkages that may be needed to join different data sources – for example, project numbers, account codes, work order numbers, etc. Agencies may want to profile the data for these elements to understand variations in coding and formats.
Step 4: Design Data Flows and Select Technology Solutions
Based on the requirements, available data, the linkage analysis and the tools and resources available within the agency, design how the data will flow from sources to target systems, and select the technology solutions to be used for performing the integration itself. The target system might be a general purpose enterprise geodatabase, an enterprise asset management database, a BI tool reporting data source, data warehouse, or a data lake. Data Extract-Transform-Load tools are available from data warehouse vendors; simple integration tasks may be accomplished through scripting. There are also a variety of specialized tools available for transforming and combining spatial data, and for extracting data from CAD/3D models.
Step 5: Design and Implement Integration Methods
Develop the technical approach for transforming link fields so that they are consistent across databases and if applicable, joining the different data sets and combining common data elements from the different sources. This may involve spatial processing (such as dynamic segmentation), aggregation, coding conversions, and other transformations.
Short term integration strategies include:
- Creating GIS data layers and making them accessible in available web and desktop-based GIS software. This strategy requires that each data source uses compatible spatial referencing, or can be converted to a common referencing system.
- Creating a database or view combining data from various source systems, and using available BI/Reporting tools to create reports and data visualizations. This strategy requires identifying common “dimensions” across source systems and/or normalizing data so that it can be summarized. For example, if the agency wants to report asset quantities by district or county by year, it will be necessary to make sure that each source has these data elements and that the data can be converted to a consistent set of values.
- Exposing data from authoritative sources as services via Application Programming Interfaces (APIs).
In the longer term, agencies can consider re-architecting or consolidating their systems so that they work better together. A logical way to approach this is to document the “as is” situation and then map out a “to be” architecture. This will allow the agency to chart a path from the current state to the desired future state. It will also provide a framework for capturing requirements for any new systems that are brought into the agency.
Integrated asset management systems are not a new concept and there are several commercial systems that support information management and work planning for multiple asset types. However, some agencies are challenged to integrate information about major assets (pavements and bridges) with information about various other ancillary assets – given that approaches to planning and budgeting for major assets are more sophisticated and require a greater level of detailed information and analysis. Also, it can be a challenge to integrate information about operations and maintenance with capital projects given differences in how work is categorized, performed, and tracked.
TIP
Find opportunities to save on data collection costs by capturing asset information during project design and construction.
Kansas DOT
KDOT’s architecture was based on a value chain model that represents the agency’s business components and relationships. It included a set of “context diagrams” showing information flow across systems and actors for major subject areas including highway asset systems, long range planning, pre-construction, construction and maintenance. While an architecture does require significant effort to create and maintain, it provides a more global and stable view of business processes and information needs than what would be produced through a piecemeal, incremental approach to system upgrades and replacements. This view can be used to plan the path from the existing set of systems to a more efficient and integrated set.
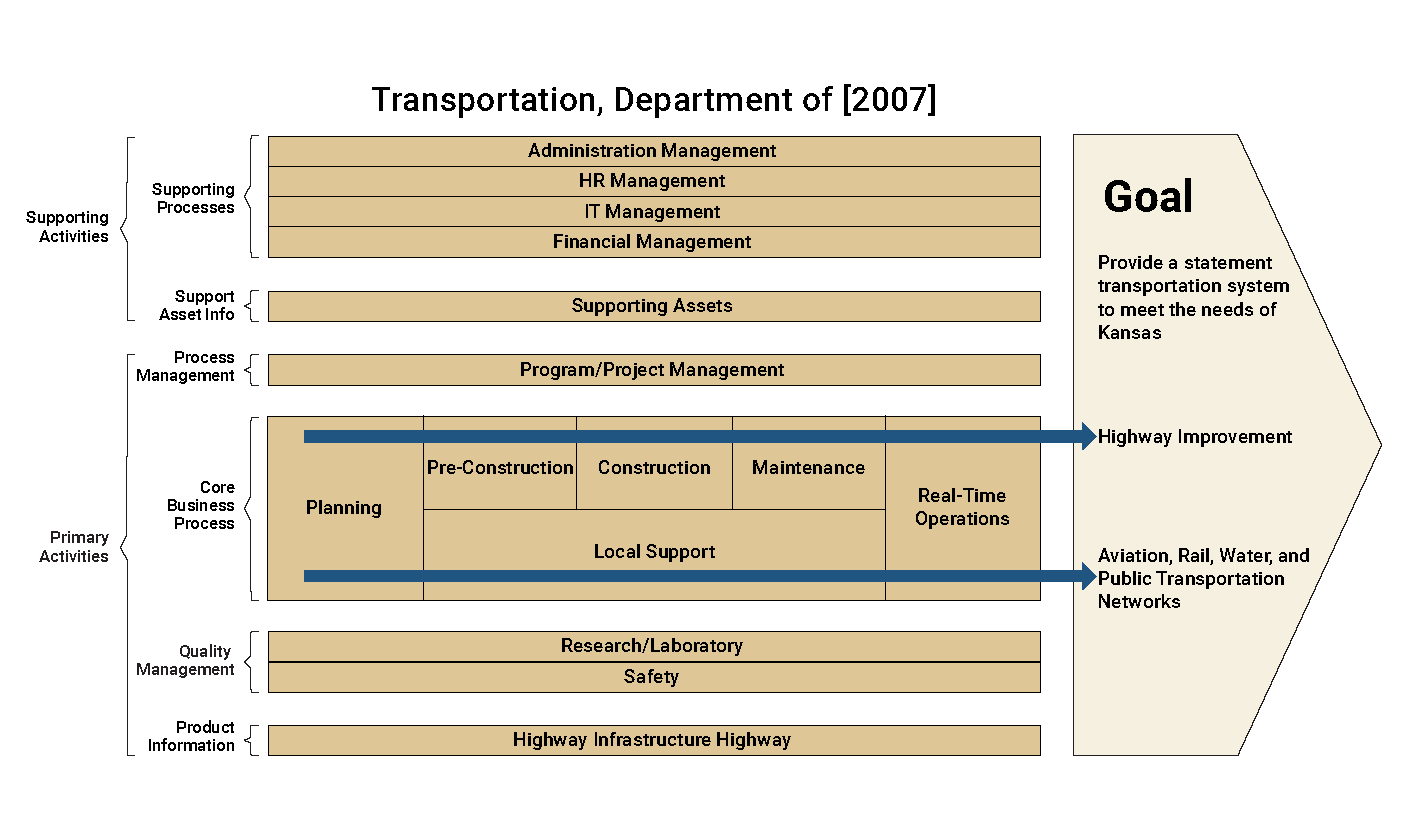
Source: Adapted from Kansas Department of Transportation. 2003. Enterprise IT Architecture
7.1.4
Integrating Asset Information Across the Life Cycle
As assets are designed, created, maintained, restored, and replaced, different systems are typically used to keep records of asset characteristics, conditions and work. Ideally, information created at one stage of the asset life cycle is made available for use at the next stage. Techniques, tools and processes are available to manage data for an asset over its entire life cycle from construction or acquisition to disposal.
Integrating information across the transportation infrastructure life cycle is an area of significant interest in the transportation industry. Several terms have been used to describe the collection of processes, standards and technologies for accomplishing such integration – including Civil Integrated Management (CIM) and Building Information Modeling (BIM) for Infrastructure. In 2019 ISO issued its first BIM standard, ISO Standard 19650. This builds on an earlier standard published by the British Standards Institute (BSI).
Traditionally, information created at one phase of the life cycle is archived and not made available to downstream processes. There are substantial opportunities for cost savings by using a shared, electronic model of the infrastructure, defining information needs at each life cycle phase, and establishing procedures for information handoffs across the life cycle. For example, information about assets included in a construction project can be compiled during design and linked to the model representations of the assets. This information can be confirmed and corrected during construction and made available to asset management systems when the project is completed and turned over to maintenance and operation.
Such integration can reduce duplicative data collection efforts, and speed the time required to make decisions and perform work. Implementing these techniques requires much more than adoption of technology supporting 2D and 3D models. A commitment to common standards and processes is needed. Recognizing that this scale of change takes time, maturity models and levels of implementation have been defined to guide agencies in developing roadmaps for enhancing life cycle information integration over time. See the references at the end of this chapter for further information.
Figure 7.3 Integrated Workflow Model for Sharing Information Across the Life Cycle Components
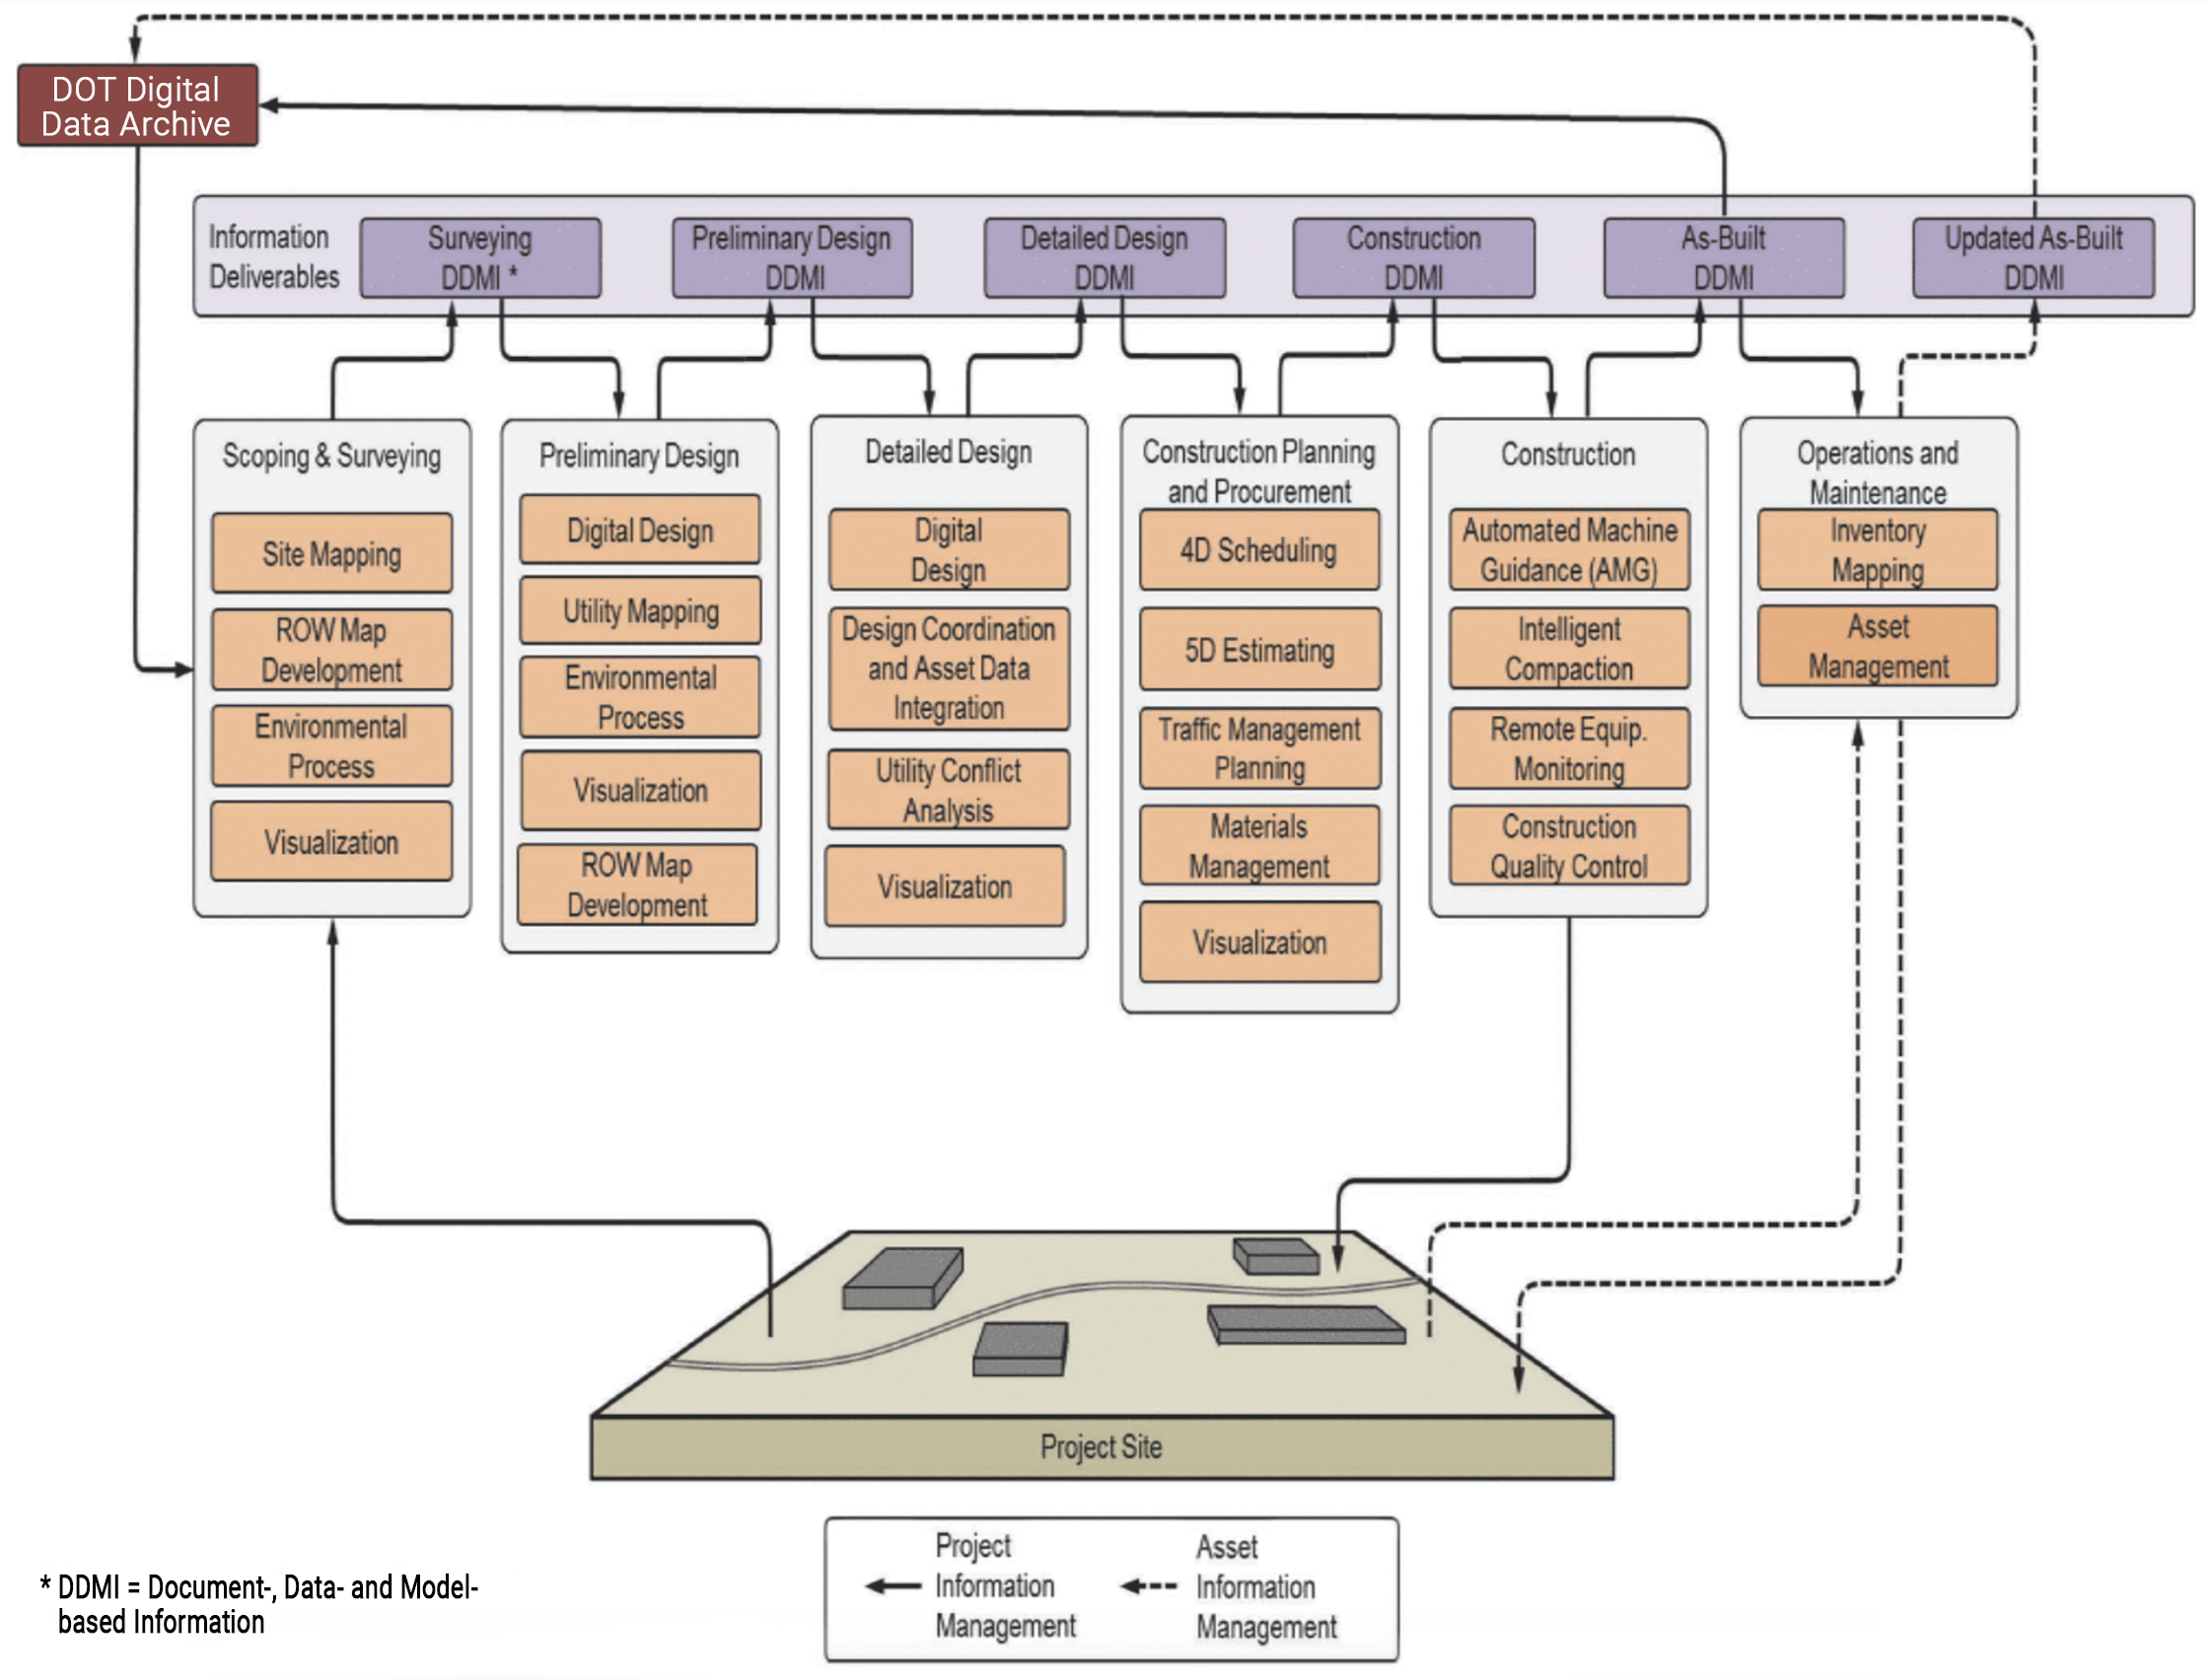
Transportation Research Board. 2016. Civil Integrated Management (CIM) for Departments of Transportation, Volume 1: Guidebook. https://www.nap.edu/read/23697/chapter/5#16
CrossRail & Transportation for London
Crossrail is a major design-build project to construct a new railway line across central London (UK). It includes 42km of track and 10 new underground stations. Project construction began in 2009. The project is being delivered by Crossrail Limited (CRL), currently a wholly owned subsidiary of Transport for London (TfL). Once the project is complete it will be operated by TfL as the Elizabeth Line. The Crossrail project provides a good example of the application of several BIM elements. Early on, CRL established the following objective:
To set a world-class standard in creating and managing data for constructing, operating and maintaining railways by:
- Exploiting the use of BIM by Crossrail, contractors and suppliers
- Adoption of Crossrail information into future infrastructure management (IM) and operator systems
CRL established a Common Data Environment (CDE) with integrated information about the project and the assets it includes. This environment included CAD models, separate linked databases containing asset details, GIS data, and specialized applications for scheduling, risk management and cost management. Data warehousing techniques were used to combine and display integrated information. Considerable work went into defining asset data requirements and setting up standard, well documented data structures and workflows to provide an orderly flow of information from design through construction, and on to maintenance and operation. It was essential to create a common information architecture given that work on each of Crossrail’s nine stations was conducted by different teams, each consisting of multiple contractors. Each station was comprised of over 15,000 individual assets.
Key elements of the approach included:
- A common asset information database with standard templates for deliverables. This database serves as the “master data source from which playlists of information can be created.”
- An asset breakdown structure (ABS) that relates facilities (e.g. stations) to functional units (e.g. retaining walls) to individual assets (e.g. steel piles).
- Asset naming, identification and labeling standards that distinguish functional duty requirements (e.g. a pump is needed here) from specific equipment in place fulfilling these requirements.
- Asset data dictionary definition documents (AD4s) that lay out the specific attributes to be associated with different types of assets, based on the ABS.
- Sourcing of the asset data from design and as-built information.
- A Project Information Handover Procedure specifying the methods of data and information handover for maintenance and operations once the construction has been completed.
- Use of a common projected coordinate system for CAD and GIS data
- Use of a federated data model in which information was maintained within separate special purpose systems, with a common master data model enabling sharing and interpretation of data from the different sources. The master model included elements such as time periods, budget and schedule versions, organizations, data owners, contractors, milestones and key events.
Sources:
https://learninglegacy.crossrail.co.uk/documents/building-a-spatial-infrastructure-for-crossrail/
BIM Lifecycle Information Management
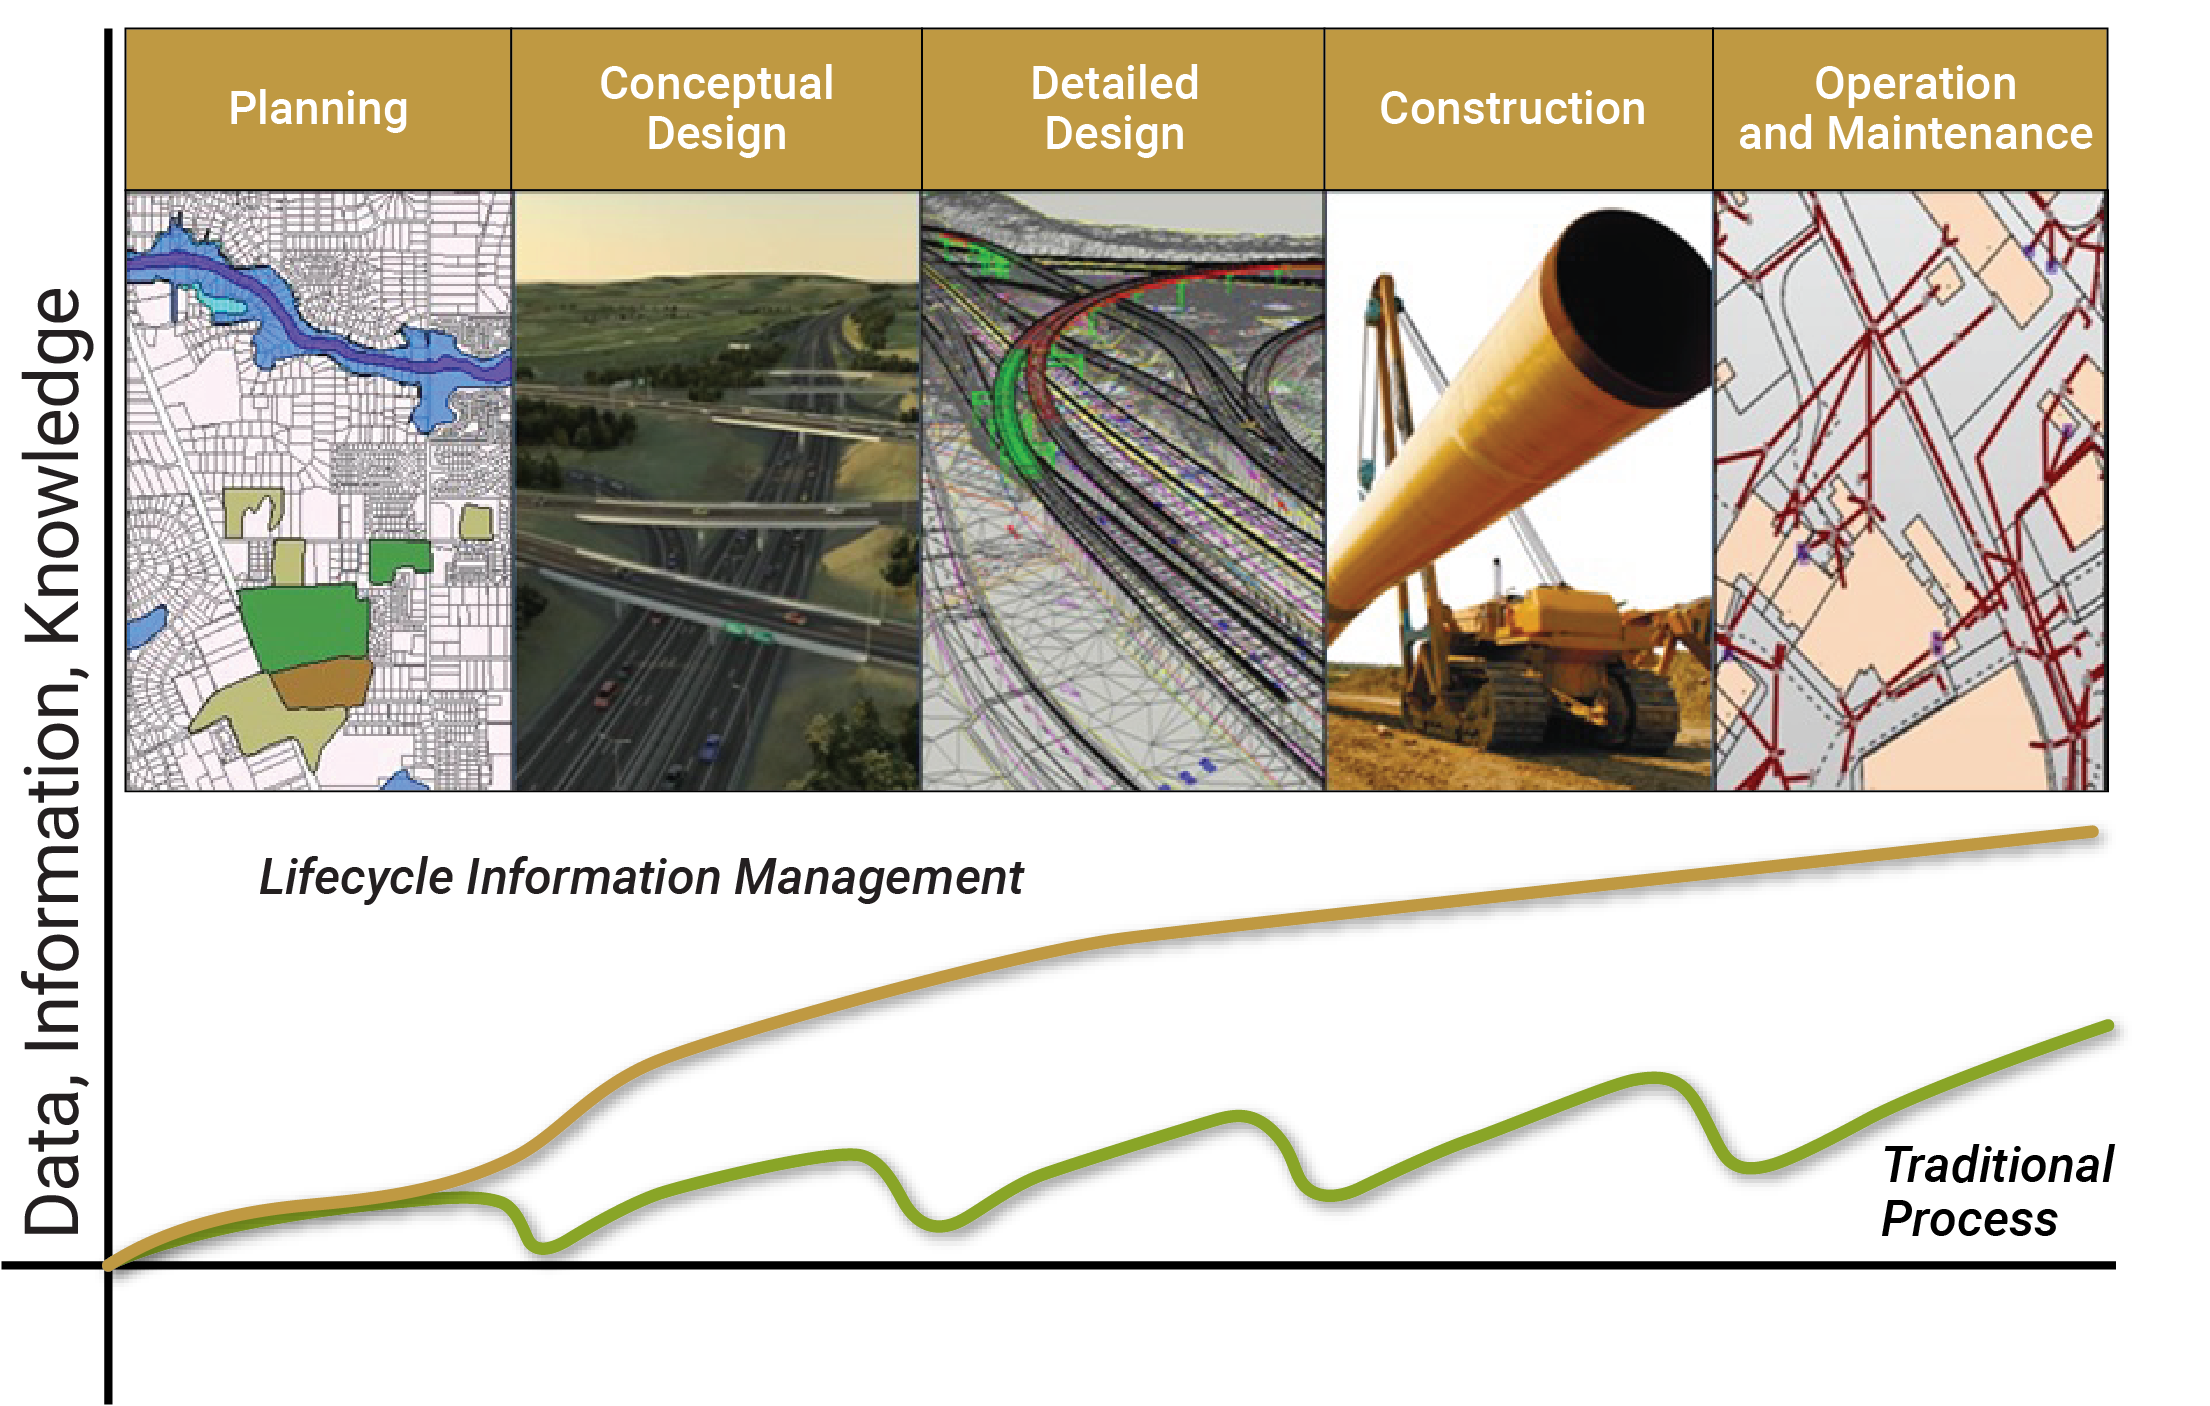
Source: Adapted from Crossrail. 2016. Building A Spatial Data Infrastructure For Crossrail. https://learninglegacy.crossrail.co.uk/documents/building-a-spatial-infrastructure-for-crossrail/
7.1.5
TAM Data Guide
This subsection highlights the importance of effective data and information systems in supporting Transportation Asset Management (TAM) programs. It introduces the NCHRP Report 956 and AASHTO TAM Data Guide, which offer a structured approach for assessing current TAM data practices, identifying improvements, and planning implementation strategies. The guidance includes practical tips, supporting materials, templates, and real-world implementation examples to help transportation agencies enhance their TAM data management.
Overview
Transportation agencies are facing increasing pressure to make more effective use of data and information systems to support their TAM programs. Addressing this need, NCHRP Project 08-115 produced NCHRP Report 956, a Guidebook for Data and Information Systems for Transportation Asset Management. AASHTO hosts web-based versions of the guidebook and tools, where subsequent implementation guidance and DOT implementation experiences have also been shared.
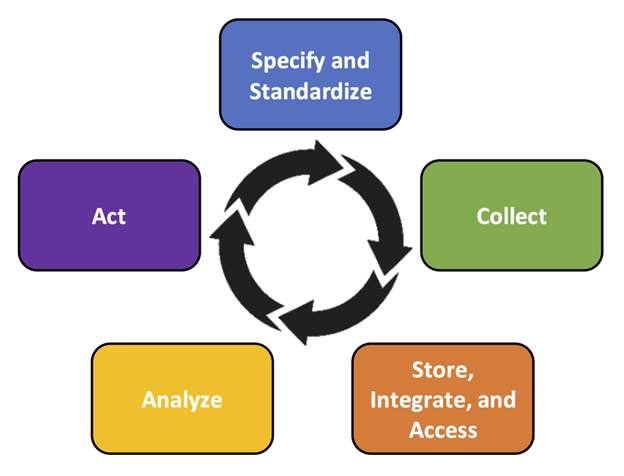
Built upon a data life-cycle framework which addresses five distinct stages in the use of data for TAM, the NCHRP Report 956 and associated AASHTO TAM Data Guide provide a structured approach for transportation agencies to:
- Assess current TAM data and information system practices and establish a desired state.
- Identify and evaluate data and information system-related improvements.
- Secure agency support for improvements and plan an implementation strategy.
Figure 7.4 Stages in the Use of Data for TAM
This guidance is supplemented with valuable support materials, including:
- Practical implementation tips to support the TAM data and information system assessment, improvement selection and evaluation, and action planning processes.
- Supporting materials and templates (such as assessment scoping guidance, stakeholder engagement and facilitation materials, and assessment summary and action planning templates).
- User guidance, quick reference materials, and tutorial videos to guide tool use and application.
- Research implementation examples based on four real-world implementations of the guidance at the New Hampshire, New Mexico, and Virginia DOTs.
Other Related Methodologies
For those exclusively focused on better understanding and improving how they manage their TAM data, NCHRP Project 20-44(12) was completed in 2022, providing improved tools, supplemental guidance, materials, and detailed case studies on implementation of the NCHRP Report 814 Data Self-Assessment Guidance. The outcomes of this project included detailed agency-specific assessment experiences, including several applications of the data management maturity and data value assessment frameworks in TAM-specific contexts.
New Hampshire DOT
The New Hampshire DOT (NHDOT) was interested in improving data and information systems to enable better alignment between bridge preservation decision-making approaches with those used for bridge rehabilitation and replacement. This TAM Data Assessment was conducted in anticipation of advancements in data and modeling detail and better integration of bridge asset management and bridge design systems and models. At the time of the assessment, a new bridge management system was being implemented, presenting a unique opportunity to advance data and information system practices.
*Note: This practice example was derived from NCHRP Final Research Implementation Report 1076: A Guide to Incorporating Maintenance Costs into a Transportation Asset Management Plan. More TAM Data Assessment research implementation examples are available at: https://www.tamdataguide.com/research-implementation-examples/
New Mexico DOT
New Mexico DOT (NMDOT) had recently implemented a new data-driven methodology to prioritize proposed capital projects. The agency wanted to use the TAM Data Assessment to identify data and information system improvements to advance and sustain District implementation of the new approach and prioritization outcomes.
*Note: This practice example was derived from NCHRP Final Research Implementation Report 08-115: Guidebook for Data and Information Systems for Transportation Asset Management. More TAM Data Assessment research implementation examples are available at: https://www.tamdataguide.com/research-implementation-examples/
Virginia DOT
This TAM Data Assessment examined the Virginia DOT maintenance management system to identify how current functionality could be expanded to support broader asset management of roadside assets.
*Note: This practice example was derived from NCHRP Final Research Implementation Report 08-115: Guidebook for Data and Information Systems for Transportation Asset Management. More TAM Data Assessment research implementation examples are available at: https://www.tamdataguide.com/research-implementation-examples/
Virginia DOT
Virginia DOT (VDOT) has a long standing and high functioning Pavement Management program. This program is organized around a well-established pavement management system (PMS) and pavement maintenance scheduling system (PMSS). These systems are used by Central Office and District staff to forecast pavement conditions, allocate resources, and plan targeted preventative, corrective, and restorative maintenance projects. Although VDOT staff were confident in their program, they were motivated to identify if further improvement would be possible through data and/or system improvements.
*Note: This practice example was derived from NCHRP Final Research Implementation Report 08-115: Guidebook for Data and Information Systems for Transportation Asset Management. More TAM Data Assessment research implementation examples are available at: https://www.tamdataguide.com/research-implementation-examples/
Ohio DOT
Ohio DOT has separate pavement and structures management systems, but integrates both asset and project information within its Transportation Information Management System (TIMS). A separate Transportation Asset Management Decision Support Tool (TAM-DST) allows for a user to combine data from TIMS with other state-maintained data sets to perform analysis and reporting. The application allows for one to consume large quantities of data in a timely manner to help make better choices in planning. See practice examples in Section 2.2.4 and Section 6.2.1 for more information on TIMS.
Kansas DOT
KDOT’s architecture was based on a value chain model that represents the agency’s business components and relationships. It included a set of “context diagrams” showing information flow across systems and actors for major subject areas including highway asset systems, long range planning, pre-construction, construction and maintenance. While an architecture does require significant effort to create and maintain, it provides a more global and stable view of business processes and information needs than what would be produced through a piecemeal, incremental approach to system upgrades and replacements. This view can be used to plan the path from the existing set of systems to a more efficient and integrated set.
Source: Adapted from Kansas Department of Transportation. 2003. Enterprise IT Architecture
CrossRail & Transportation for London
Crossrail is a major design-build project to construct a new railway line across central London (UK). It includes 42km of track and 10 new underground stations. Project construction began in 2009. The project is being delivered by Crossrail Limited (CRL), currently a wholly owned subsidiary of Transport for London (TfL). Once the project is complete it will be operated by TfL as the Elizabeth Line. The Crossrail project provides a good example of the application of several BIM elements. Early on, CRL established the following objective:
To set a world-class standard in creating and managing data for constructing, operating and maintaining railways by:
- Exploiting the use of BIM by Crossrail, contractors and suppliers
- Adoption of Crossrail information into future infrastructure management (IM) and operator systems
CRL established a Common Data Environment (CDE) with integrated information about the project and the assets it includes. This environment included CAD models, separate linked databases containing asset details, GIS data, and specialized applications for scheduling, risk management and cost management. Data warehousing techniques were used to combine and display integrated information. Considerable work went into defining asset data requirements and setting up standard, well documented data structures and workflows to provide an orderly flow of information from design through construction, and on to maintenance and operation. It was essential to create a common information architecture given that work on each of Crossrail’s nine stations was conducted by different teams, each consisting of multiple contractors. Each station was comprised of over 15,000 individual assets.
Key elements of the approach included:
- A common asset information database with standard templates for deliverables. This database serves as the “master data source from which playlists of information can be created.”
- An asset breakdown structure (ABS) that relates facilities (e.g. stations) to functional units (e.g. retaining walls) to individual assets (e.g. steel piles).
- Asset naming, identification and labeling standards that distinguish functional duty requirements (e.g. a pump is needed here) from specific equipment in place fulfilling these requirements.
- Asset data dictionary definition documents (AD4s) that lay out the specific attributes to be associated with different types of assets, based on the ABS.
- Sourcing of the asset data from design and as-built information.
- A Project Information Handover Procedure specifying the methods of data and information handover for maintenance and operations once the construction has been completed.
- Use of a common projected coordinate system for CAD and GIS data
- Use of a federated data model in which information was maintained within separate special purpose systems, with a common master data model enabling sharing and interpretation of data from the different sources. The master model included elements such as time periods, budget and schedule versions, organizations, data owners, contractors, milestones and key events.
Sources:
https://learninglegacy.crossrail.co.uk/documents/building-a-spatial-infrastructure-for-crossrail/
BIM Lifecycle Information Management
Source: Adapted from Crossrail. 2016. Building A Spatial Data Infrastructure For Crossrail. https://learninglegacy.crossrail.co.uk/documents/building-a-spatial-infrastructure-for-crossrail/
New Hampshire DOT
The New Hampshire DOT (NHDOT) was interested in improving data and information systems to enable better alignment between bridge preservation decision-making approaches with those used for bridge rehabilitation and replacement. This TAM Data Assessment was conducted in anticipation of advancements in data and modeling detail and better integration of bridge asset management and bridge design systems and models. At the time of the assessment, a new bridge management system was being implemented, presenting a unique opportunity to advance data and information system practices.
*Note: This practice example was derived from NCHRP Final Research Implementation Report 1076: A Guide to Incorporating Maintenance Costs into a Transportation Asset Management Plan. More TAM Data Assessment research implementation examples are available at: https://www.tamdataguide.com/research-implementation-examples/
New Mexico DOT
New Mexico DOT (NMDOT) had recently implemented a new data-driven methodology to prioritize proposed capital projects. The agency wanted to use the TAM Data Assessment to identify data and information system improvements to advance and sustain District implementation of the new approach and prioritization outcomes.
*Note: This practice example was derived from NCHRP Final Research Implementation Report 08-115: Guidebook for Data and Information Systems for Transportation Asset Management. More TAM Data Assessment research implementation examples are available at: https://www.tamdataguide.com/research-implementation-examples/
Virginia DOT
This TAM Data Assessment examined the Virginia DOT maintenance management system to identify how current functionality could be expanded to support broader asset management of roadside assets.
*Note: This practice example was derived from NCHRP Final Research Implementation Report 08-115: Guidebook for Data and Information Systems for Transportation Asset Management. More TAM Data Assessment research implementation examples are available at: https://www.tamdataguide.com/research-implementation-examples/
Virginia DOT
Virginia DOT (VDOT) has a long standing and high functioning Pavement Management program. This program is organized around a well-established pavement management system (PMS) and pavement maintenance scheduling system (PMSS). These systems are used by Central Office and District staff to forecast pavement conditions, allocate resources, and plan targeted preventative, corrective, and restorative maintenance projects. Although VDOT staff were confident in their program, they were motivated to identify if further improvement would be possible through data and/or system improvements.
*Note: This practice example was derived from NCHRP Final Research Implementation Report 08-115: Guidebook for Data and Information Systems for Transportation Asset Management. More TAM Data Assessment research implementation examples are available at: https://www.tamdataguide.com/research-implementation-examples/