Chapter 6
Monitoring and Adjustment
TAM relies on the continued availability of reliable and comprehensive data to support decisions. This chapter addresses the need to monitor and adapt TAM data and business processes to stay relevant.
Section 6.1
Monitoring Performance Measures
Performance measures are used by transportation agencies to align agency investment decisions with organizational objectives, such as asset condition or system reliability, and to monitor progress towards achieving agency goals. In TAM, asset performance is most commonly defined in terms of asset condition, but performance can also be represented by operational considerations, such as safety or traffic reliability.
Section 6.2
Monitoring the State of Assets
Performance-based decision making depends on the availability of reliable and consistent data. For asset management decisions, asset inventory and condition information is most commonly used; however, other performance characteristics may also be used to monitor performance. This section introduces the types of inventory and condition information commonly used to support asset management decisions and describes strategies for keeping the data current. This section does not describe the methods used to collect inventory and condition information. That information is provided in Chapter 7.
Section 6.3
Monitoring Funding and Resource Allocation Methods
Understanding past funding and resource allocation trends provides valuable context for future investment strategies. This section discusses the types of trends commonly used in TAM and illustrates how the trends can be used to adjust a program.
Section 6.4
Monitoring Asset Work and Costs
As discussed previously in Chapter 2, in order to reliably assess current and future work needs over an asset’s life cycle, it is important to ensure completed maintenance and capital work activities are tracked and incorporated into the asset management programs. This section establishes the importance of tracking work history information, presents approaches to track the information and illustrates how work history information can be used to update and improve performance predictions.
Section 6.5
Monitoring Risks and TAM Processes
Chapter 2 introduced a process for identifying, analyzing, evaluating and managing risks, including a step for monitoring and reviewing risks on a regular basis. Since risks are constantly changing, it is important to establish processes to track changes in risks over time and monitor actions taken to manage risks. The same is true of other business processes that support TAM; they should be monitored regularly to ensure that analysis results continue to support investment decisions and that any gaps between desired and actual levels of maturity are addressed. This section introduces tools used to track and manage risks, highlights methods of monitoring and evaluating TAM processes, suggests a structure for assigning responsibility for implementation of new processes, and illustrates successful practices used in transportation agencies.
Section 6.6 NEW SECTION
Incorporating Maintenance Costs into a TAMP
As discussed in section 6.4 monitoring asset work and costs is essential to assessing progress towards TAM objectives and continually improving TAM analyses and forecasts. This section describes specific challenges and approaches to capturing costs related to the maintenance of highway infrastructure assets.
Monitoring Performance Measures
Performance measures are used by transportation agencies to align agency investment decisions with organizational objectives, such as asset condition or system reliability, and to monitor progress towards achieving agency goals. In TAM, asset performance is most commonly defined in terms of asset condition, but performance can also be represented by operational considerations, such as safety or traffic reliability.
6.1.1
Selecting and Using Performance Measures
This subsection discusses the importance of using performance data to make decisions. It highlights the role of performance measures and provides suggestions on selecting effective measures to meet agency needs. This section also introduces innovative new performance measures that agencies may consider in the future. A more detailed discussion of Transportation Performance Management can be found in Chapter 2.
Performance Management Framework
As discussed in Chapter 2, transportation agencies have embraced the use of performance data to drive investment decisions. A performance-based management approach enables agencies to select and deliver the most effective set of projects for achieving strategic objectives, while also improving internal and external transparency and accountability.
A typical performance management framework includes:
- A clear idea of the agency’s strategic objectives.
- The use of performance measures to assess performance.
- Methods to evaluate and monitor performance results.
- The evaluation of factors with capacity to improve long-term performance.
- The allocation of funding to achieve agency objectives.
- Ongoing processes to monitor and report progress.
A fundamental component of the framework is the use of performance measures to evaluate system performance and the importance of establishing business processes to evaluate, monitor, and use the data to influence agency decisions. These are achieved by aligning decisions at all levels of the organization with the agency’s strategic objectives and ensuring that the right performance measures are being used to drive decisions. This alignment helps to ensure that resource allocation decisions and the day-to-day activities of agency personnel support the agency’s priorities and the interests of external stakeholders.
The existence of a regular, ongoing processes to monitor and report results is critical to identifying and implementing improvements to system performance or to further the effectiveness of the performance management process. The continual monitoring and update of a performance management framework is reflected in Figure 6.1, which illustrates inputs to performance targets and how ongoing monitoring and adjustments are fed back into the framework to adjust future targets. The surveys conducted regularly to support a pavement, bridge or maintenance management system are examples of the types of performance monitoring activities fundamental to an effective performance management organization.
TPM Webinar #16 - Caltran's Performance Management Framework
Agencies with a performance management framework in place have benefited from:
- Maintaining a clear and unified focus for making agency decisions based on agency priorities, public input and available resources.
- Using available funding more effectively to preserve or improve system performance while lowering life cycle costs.
- Allocating available resources based on analysis of past performance and expected conditions to address areas most in need of attention.
- Having the data to confidently defend funding requests or explain the impact of reduced budgets.
- Building a transparent and accountable organization by communicating the basis for making resource decisions.
- Meeting legislative requirements.
Figure 6.1 Monitoring and Adjustment in the TPM Process

TIP
It is important to select performance measures that are meaningful to the agency and that can directly inform decisions. This may vary depending on the agency context, culture, and TAM maturity.
Arizona DOT
In 2001, during the development of a long-range transportation plan (LRTP), the Arizona DOT took a strategic approach to how investments should be made. Under the new approach, Arizona DOT established the following three investment categories:
- Preservation, including activities that preserve existing transportation infrastructure.
- Modernization, including improvements that upgrade the efficiency, functionality, and safety without adding capacity.
- Expansion, including improvements that add transportation capacity by adding new facilities or services.
To implement the new initiative, the Arizona DOT developed a report titled “Linking the Long-Range Transportation Plan and Construction Program” or "P2P Link” that applied financial constraints to the long-term vision. Through a collaborative process that involved a consultant, local and regional governments, and transit agencies, the Arizona DOT published an implementation plan for putting the P2P Link into practice. The resulting process includes scoring projects based on both a technical and policy score that are added together to determine a project’s ranking. The technical score is generated by the asset owner based on an analysis of the data while the policy score is determined based on each project’s contribution to LRTP goals and performance measures. The process helps to ensure that projects are ranked in accordance with the agency’s strategic objectives using only the most meaningful criteria in a transparent and defensible way.
Arizona DOT’s Link Between Strategic Objectives and Investment Decisions

Source: ADOT. 2014. Linking the Long-Range Plan and Construction Program P2P Link Methodologies & Implementation Plan.
https://azdot.gov/sites/default/files/2019/08/p2p-methodologies-implementation.pdf
Performance Measures
Performance measures are used within a performance management framework to allocate resources and provide feedback on the effectiveness of the activities in achieving overall objectives. Performance measures are indicators used for evaluating strategies and tracking progress. A performance measure can be an indication of asset condition, such as a pavement condition rating, or an indication of an operational characteristic, such as the annual number of fatalities on a facility.
The most effective performance measures drive decisions that are important to the success of the program. For example, maintenance departments may use performance measures that track actual expenditures to planned expenditures to ensure that available funding is directed towards the highest-priority items, as shown in the North Carolina DOT practice example.
It is also important that the measures drive the desired performance within an organization. For instance, a performance requirement that measures whether pavement or bridge designs are submitted on time might cause incomplete or incorrect submittals to meet a deadline, leading to an increase in construction modifications. A more effective measure might focus on a minimal number of design modifications during the construction phase of a project.
Effective performance measures should also primarily be outcome-based rather than output-based, meaning that they focus on the result or impact of an activity rather than the inputs that went into the activity. Outcome-based measures are generally preferred because they indicate the effect on the traveling public resulting from the actions taken, so they usually relate to user priorities such as the length of time for a road to be cleared after a snow event or the absence of litter and graffiti. They are developed based on a description of what an agency wants to achieve as a result of the actions undertaken. Outcome-based measures are commonly used for managing ancillary assets such as drainage assets and signs. For instance, the performance of drainage assets might be reported in terms of the percent of pipes/culverts greater than 50 percent filled or otherwise deficient and the performance of signs might be reported in terms of the percent of signs viewable at night.
Output-based measures, on the other hand, track the resources used to achieve the outcome, such as the number of hours of labor used or the number of light-bulbs changed in a month. While the data is important information for managing resources, it does not necessarily drive outcomes that would matter to the public. For instance, travelers on a highway are much more interested in knowing when the road will be cleared of snow than how much overtime went into the operation.
When possible, agencies should use performance measures that are leading measures rather than lagging measures to influence future decisions. A leading measure uses changes in performance to provide insights into potential changes that might influence a future decision one way or another. For example, knowledge that a ramp meter has exceeded the manufacturer’s suggested service life might drive a decision to replace that meter. Similarly, increases in equipment downtime might indicate risks due to an aging fleet are growing or that planned operational activities will not be performed as planned. A lagging measure, on the other hand, looks back on the results of past investment strategies after the decisions have been made. Because a lagging measure is recorded after the fact, there is a delay (lag) in the agency’s ability to adjust its practices and improve performance. Bridge and pavement condition measures are examples of lagging measures because the reported conditions reflect the impact of decisions made several years in the past. Lagging measures are commonly used to evaluate a program’s effectiveness or to verify that actual investments achieved projected results.
In transportation, an agency might have a lagging measure for tracking complaints responded to within a 48-hour window. The measure provides an indication of the public’s satisfaction with the road network and is easy to monitor and report. However, if an agency really wants to effect change, it might develop leading measures to track the percent of complaints not worked on within a two-hour window or the percent of complaints that can’t be resolved by the initial point of contact and must be passed to someone else. Focusing on these types of measures could drive agency decisions to ensure complaints are being worked on quickly and are being assigned to the right people. General characteristics of effective performance measures are presented in Table 6.1.
TIP
Outcome-based measures better relate to performance characteristics noticed by the public and other stakeholders than output-based measures.
Ancillary Asset Management
Table 6.1 - Desired Performance Measure Characteristics
| Desired Characteristics | Rationale/Purpose |
|---|---|
| Measurable with available tools/data | May require no additional cost for data collection |
| Forecastable | Enables data-driven target setting based on future conditions |
| Clear to the public and lawmakers | Allows performance story-telling to customers and policymakers |
| Agency has influence over result | Measures agency activities rather than impact of external factors |
North Carolina DOT
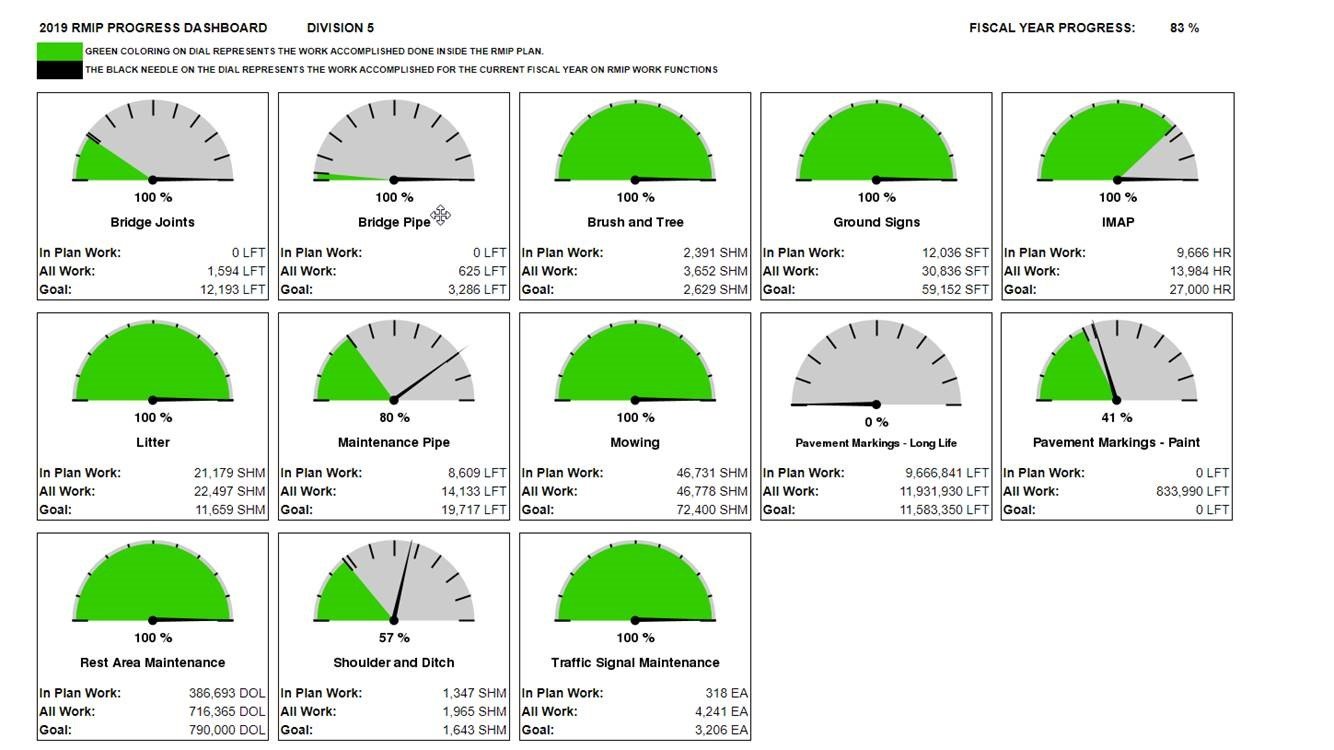
The North Carolina DOT authorizes its divisions to determine how funding will be used for maintenance activities and uses performance data to assist with this activity. Each year, Division Engineers submit annual plans detailing what work will be accomplished; these plans are reviewed quarterly with the Chief Engineer to discuss actual versus planned work. Their accomplishments are also displayed in a dashboard for internal use, as shown in the following image. Public-facing dashboards are also available showing overall conditions and performance trends. The Division Engineers are also held accountable for their performance, since their planned and actual performance data are incorporated into their annual evaluations.
Source: Leading Management Practices in Determining Funding Levels for Maintenance and Preservation. Scan Team Report, NCHRP Project 20-68A, Scan 14-01, National Cooperative Highway Research Program, May 2016.
Use of Performance Measures
Performance measures are used to:
- Connect agency policies and objectives to investment decisions.
- Establish desired and targeted levels of service that consider past performance, current and future demand, stakeholder priorities, and anticipated funding.
- Align agency policies, investments, and day-to-day practices in a meaningful and easily understood manner.
- Prioritize investment needs.
- Monitor and report progress towards desired objectives to both internal and external stakeholders in a consistent, cost-effective, and transparent manner as illustrated in practice examples from the Washington State, North Carolina, and Virginia DOTs.
Washington DOT
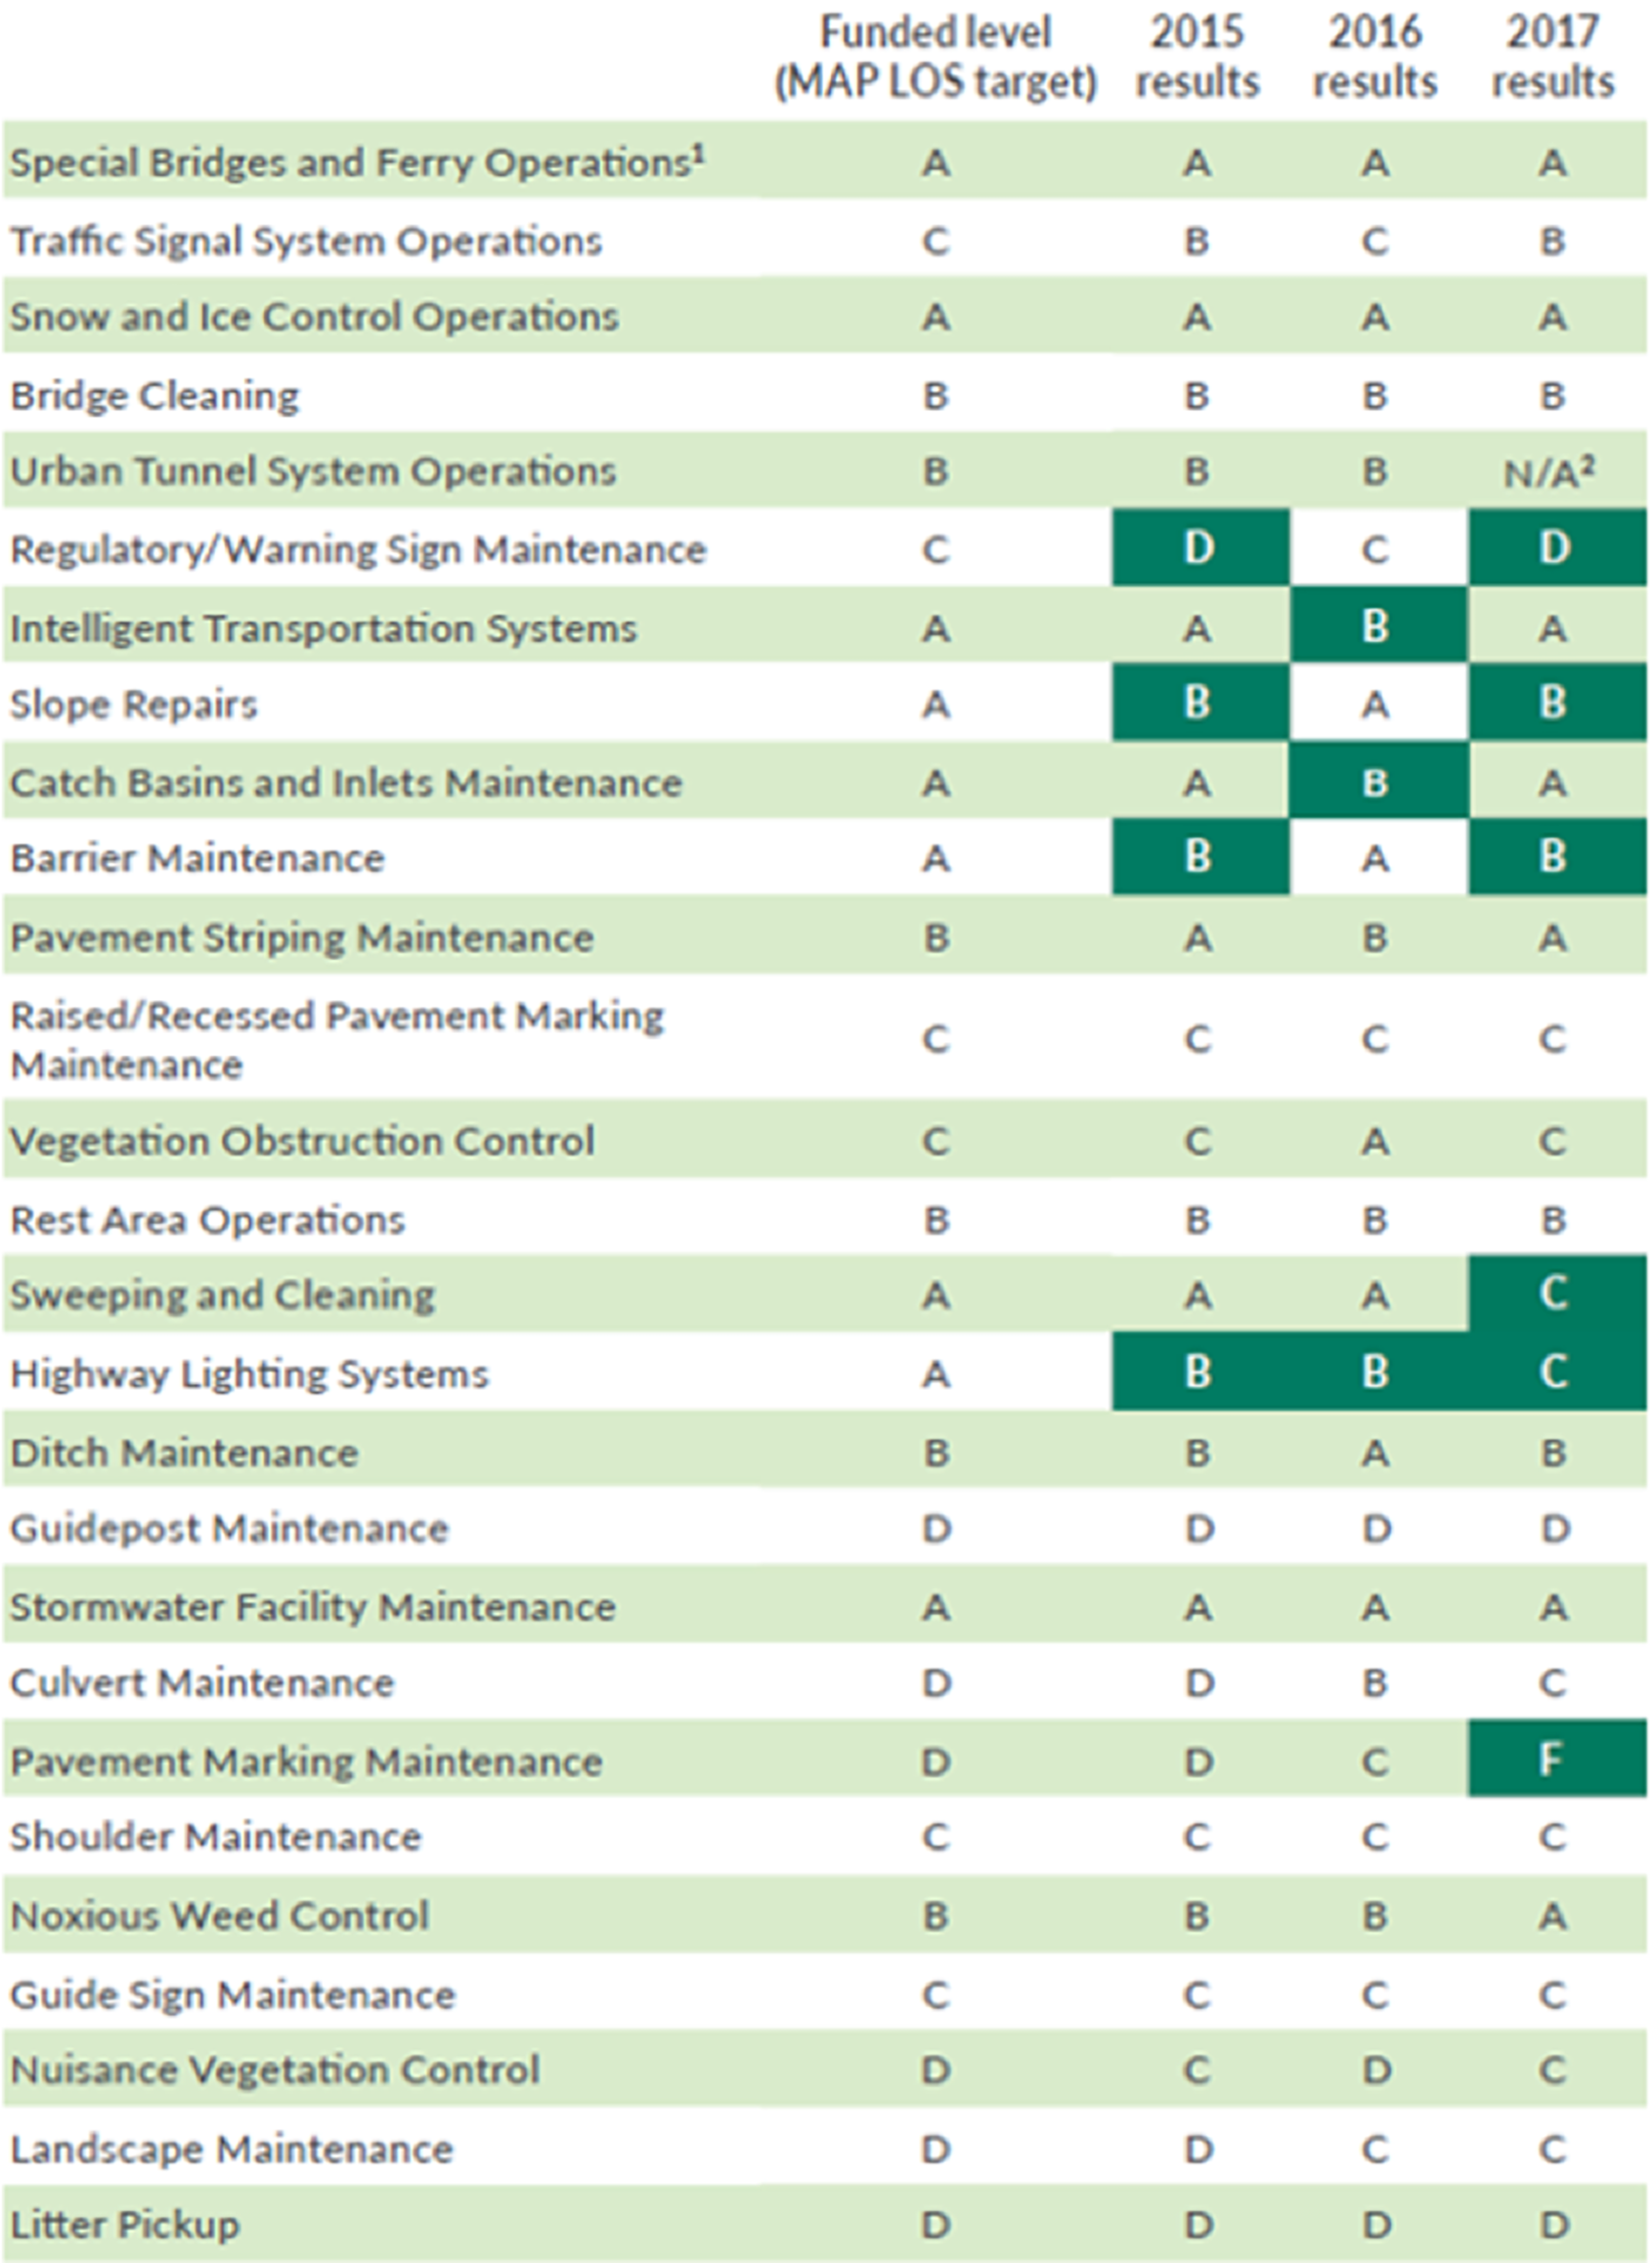
The Washington DOT uses its Maintenance Accountability Process (MAP) to comprehensively manage maintenance budgets and to communicate the impacts of policy and budget to both internal and external stakeholders. Field condition surveys are conducted annually to assess the condition of 14 assets on the highway system such as signs and signals, ITS assets, tunnels, and highway lighting. For each asset, a level of service target is established, based on expected funding levels and importance of the asset to the agency’s strategic objectives. The targeted and actual performance is summarized on a statewide basis and presented to the legislature, media, internal stakeholders, and other DOTs in a format similar to what is shown in the figure (https://www.wsdot.wa.gov/NR/rdonlyres/8EC689DF-9894-43A8-AA0F-92F49AC374F5/0/MAPservicelevelreport.pdf). In 2018, Washington State DOT achieved 77 percent of its highway maintenance targets. Targets that were not achieved are shown as red bullseyes and areas where the targets were exceeded include a checkmark with the bullseye. The results illustrate where additional investment is needed on a statewide basis and provides a basis for setting maintenance priorities during the year.
Targeted and Actual Performance Results Used to Set Maintenance Priorities
Source: WSDOT. 2017. Multimodal Asset Performance Report. Washington State DOT. https://wsdot.wa.gov/publications/fulltext/graynotebook/Multimodal/AssetPerformanceReport_2017.pdf
Washington DOT
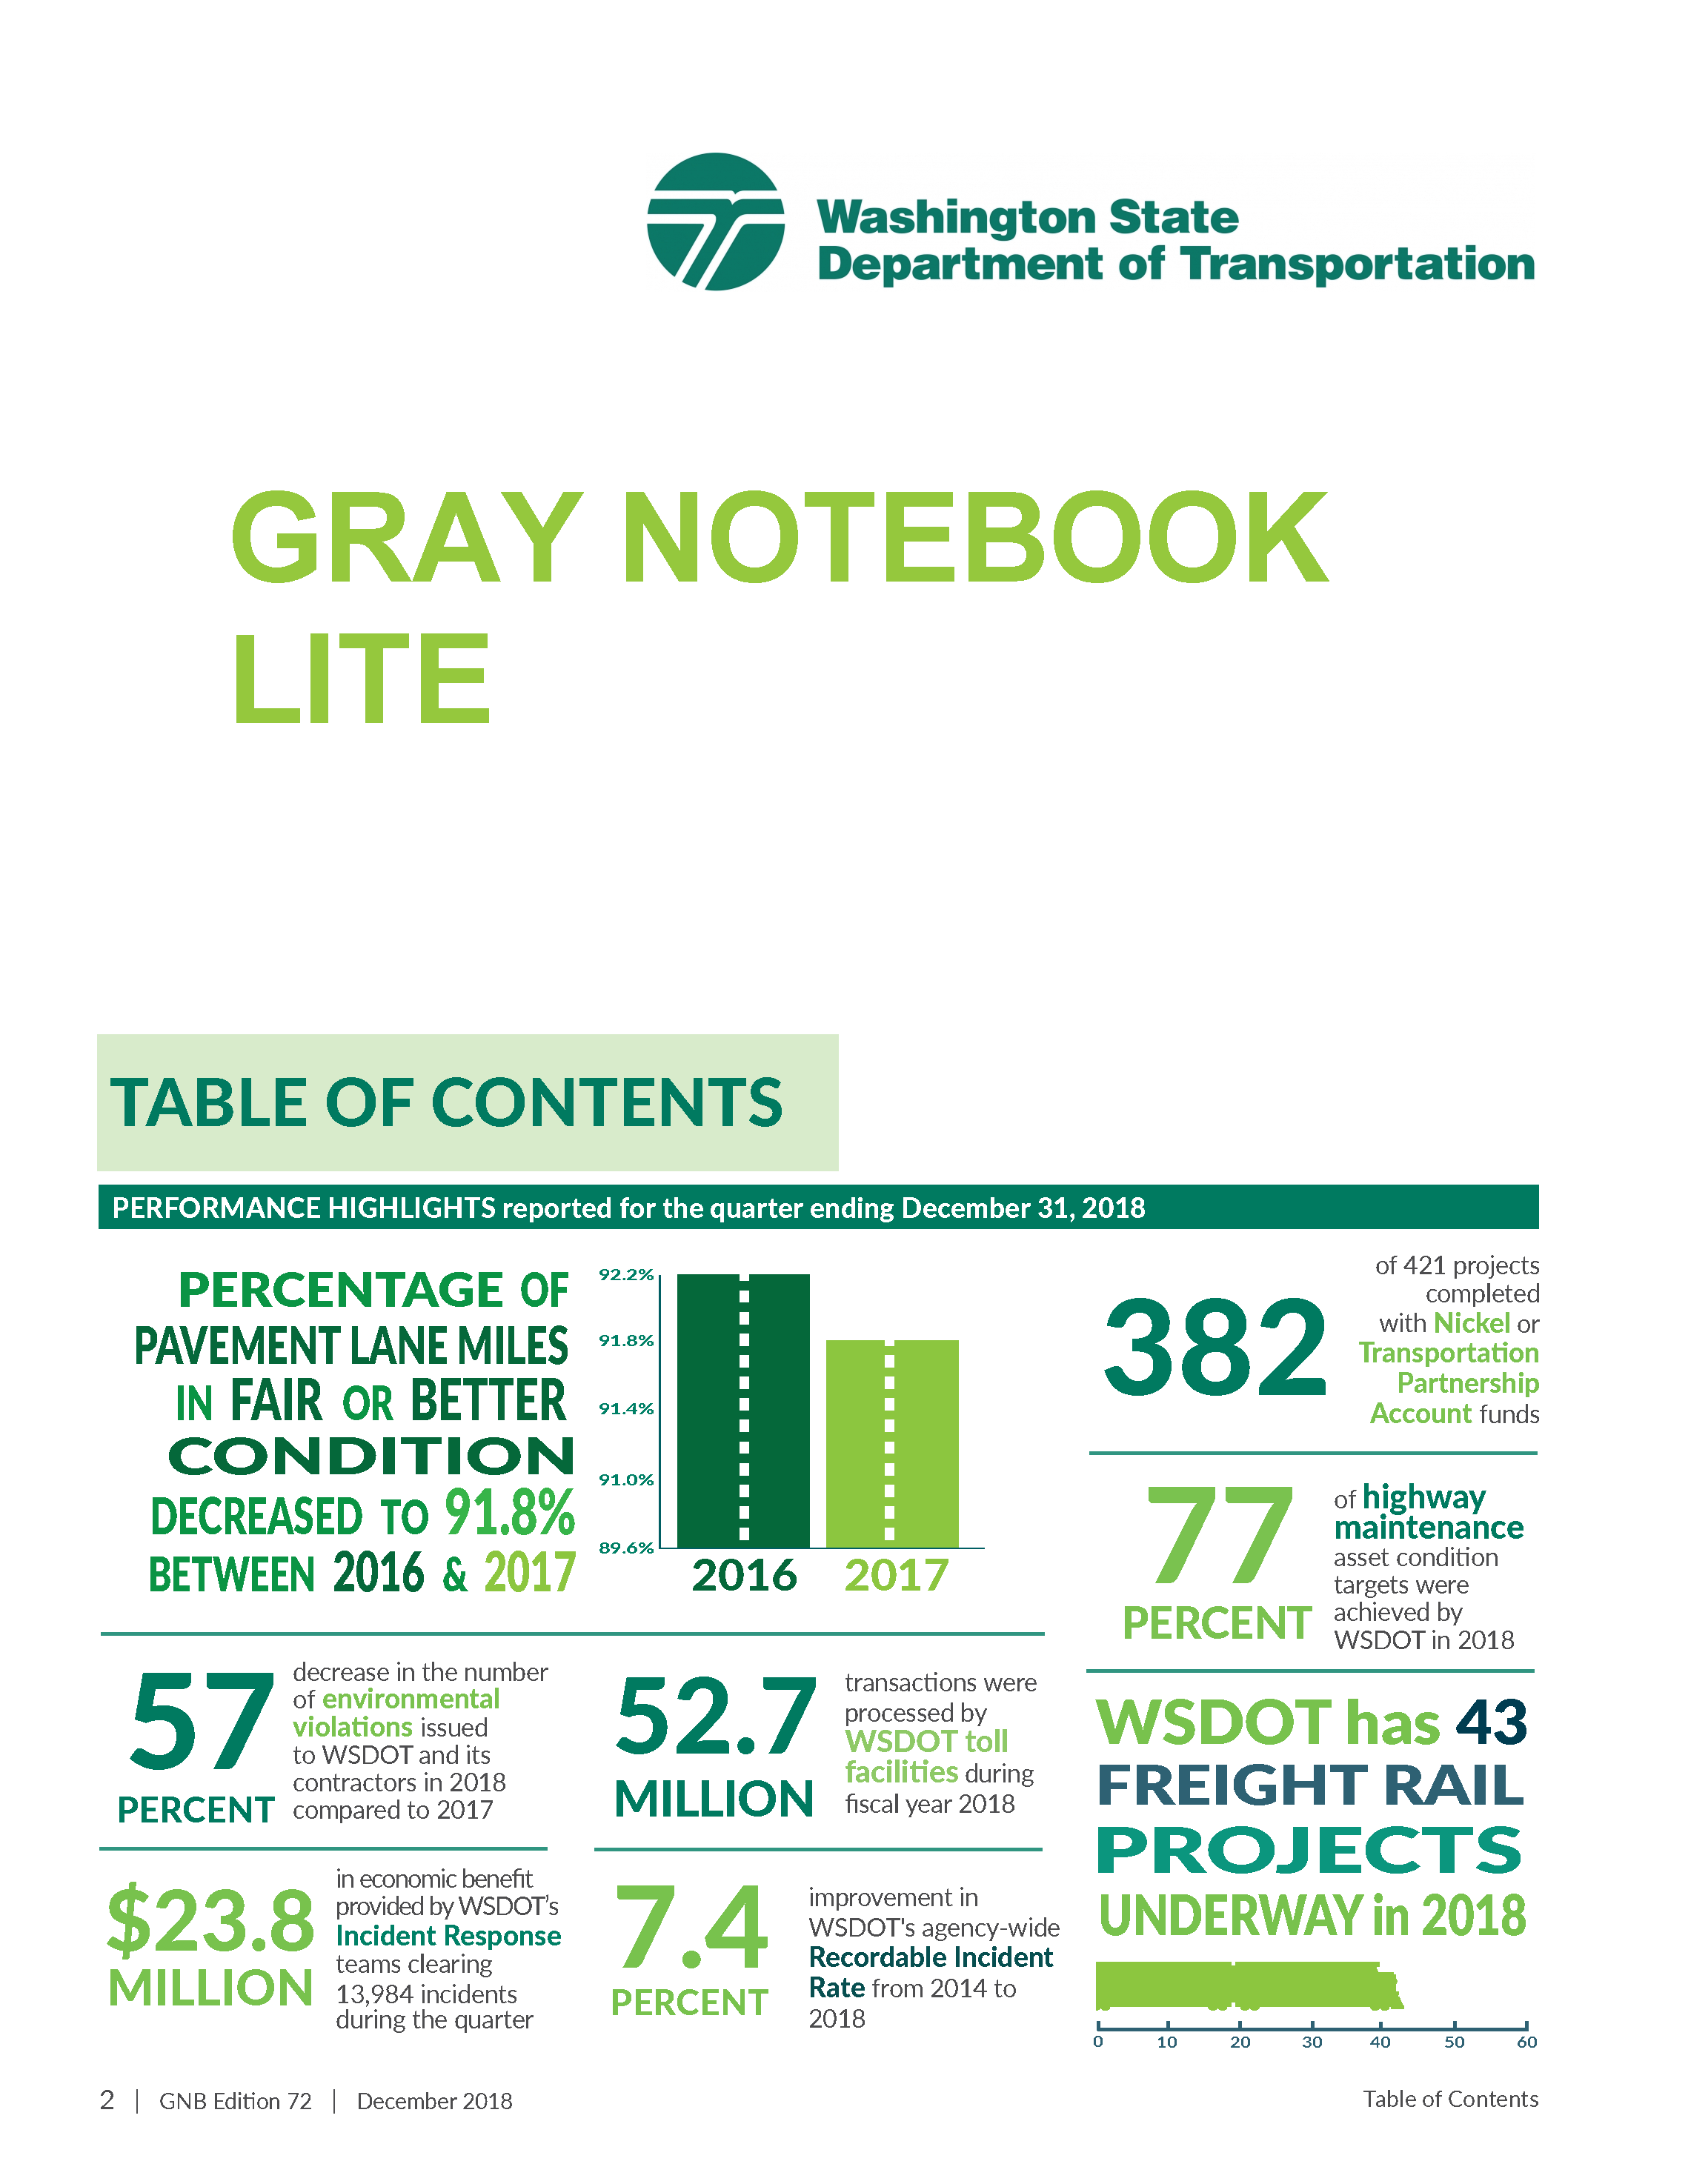
To support accountability, credibility, and transparency, the Washington State DOT publishes its quarterly performance report, referred to as The Gray Notebook. Each edition of the Gray Notebook presents updates on multimodal systems' and programs' key functions and analysis of performance in strategic goal areas based on information reported to the Performance Management and Strategic Management offices of the Transportation Safety and Systems Analysis Division. Washington State DOT also publishes its Gray Notebook Lite, which highlights key metrics referenced in the Gray Notebook in a format for quick reading. Examples from each of these documents are presented in the figures.
The Gray Notebook and the Gray Notebook Lite

Source: WSDOT. 2019. https://wsdot.wa.gov/about/accountability/gray-notebook
Virginia DOT
Performance dashboards are also a popular way to present progress, using color-coded indicators similar to those on the dash of an automobile. An example of the interactive dashboard available from the Virginia DOT is shown in the figure. The screen reports performance in seven areas (performance, safety, condition, finance, management, projects, and citizen survey results) and the needles indicate whether the performance is within targeted ranges. Hyperlinks are available in each area if a user wants to explore historical trends or explore performance objectives in more detail.
Virginia DOT's Performance Dashboard

Source: Virginia DOT. 2019. http://dashboard.virginiadot.org/
Future Directions in Performance Measures
As agencies advance the maturity of their practices and move towards investment decisions across assets and modes (as discussed in Chapter 5), there is increasing interest in the use of leading measures and asset performance measures that can be used in concert with asset condition measures.
Asset management plans document the processes and investment strategies developed by an agency to manage its infrastructure assets. These asset management plans support an agency’s performance-based planning and programming processes for making long-term investment decisions and feed shorter-term project and treatment selection activities. Together, these activities ensure the investment decisions of an agency are aligned with performance objectives and goals.
Examples of innovative new performance measures include:
- Financial Measures – Internationally, financial performance measures have been used successfully to express whether the level of investment has been adequate to offset the rate of asset deterioration or depreciation. For example, the Queensland Department of Infrastructure and Planning uses an Asset Sustainability Ratio defined as the capital expenditure being made on asset renewals (e.g., improvements) divided by the depreciation expense (discussed further in Chapter 4). If the ratio is less than 100 percent, the level of investment is not adequately replacing the depreciation occurring each year. Queensland also uses an Asset Consumption Ratio comparing the current value of the depreciable assets to their replacement value in order to show the aged condition of the assets.
In the United States, some agencies are evaluating the use of an Asset Sustainability Index (ASI), which is the ratio of the budget allocated to address needed improvements identified by a pavement or bridge management system (FHWA. 2012. Asset Sustainability Index: A Proposed Measure for Long-Term Performance, Federal Highway Administration, Washington, D.C.). The ASI is a unitless measure that allows comparisons across asset classes and provides an overall assessment of the adequacy of an agency’s investment in its assets. Since it is unitless, an agency could individually calculate a Maintenance Sustainability Ratio, a Pavement Sustainability Ratio, and a Bridge Sustainability Ratio that are all combined into an overall ASI. One of the difficulties in calculating the ASI is defining the needed level of investment since needs are significantly impacted by targeted condition levels. Slight changes in targeted conditions can have a significant impact on the resulting ASI calculation.
- Life Cycle Measures - A life cycle performance measure is a relatively new leading measure, promoting the selection of sound, long-term strategies best able to maximize performance at the lowest possible cost. There are several life cycle performance measures under consideration, including the Remaining Service Interval (RSI), validated under an FHWA-sponsored research project. The RSI is based on identifying a structured sequence of the type and timing of various repair and replacement actions needed to achieve a desired LOS over a long timeframe at the minimum practicable cost. The results of the RSI evaluation may be used to generate a Life Cycle Impact Factor, summarizing the difference in life cycle costs associated with the various strategies being considered. Documentation from a pilot implementation of the RSI approach is available through the FHWA (https://www.fhwa.dot.gov/publications/research/infrastructure/pavements/21006/21006.pdf).
- Sustainability Measures – With an increased focus on identifying long-term sustainable solutions to transportation system needs, agencies may seek to develop new sustainability performance measures in order to properly indicate the impact a proposed solution may have on environmental conditions. The use of a recycling measure for gauging the amount of recycled material used in road construction is an example of this type of measure, as are measures for monitoring carbon dioxide emissions.
- Equity Measures -The increased emphasis on equity, inclusion, and diversity is impacting planning and investment decisions at several transportation agencies. As equity considerations are added, there has been some discussion related to the types of measurable performance measures that can be used without bias toward certain users or modes of transportation. In a case study prepared by the FHWA’s Transportation Asset Management Expert Task Group, a suggestion was made to further explore both quantitative and qualitative performance measures in this area.
TIP
Making performance measures publicly available through reports, scorecards, or dashboards increases transparency into agency operations, which can serve as motivation to improve staff’s desire to meet the standards established, thereby increasing the chance of success.
North Carolina DOT
The North Carolina DOT has an interactive Organizational Performance Scorecard that provides an online indicator of the Department’s success at meeting targets in the following six core goal areas:
- Make Transportation Safer.
- Provide Great Customer Service.
- Deliver and Maintain Infrastructure Effectively and Efficiently.
- Improve Reliability and Connectivity of Transportation Systems.
- Promote Economic Growth Through Better Use of Infrastructure.
- Make NCDOT a Great Place to Work.
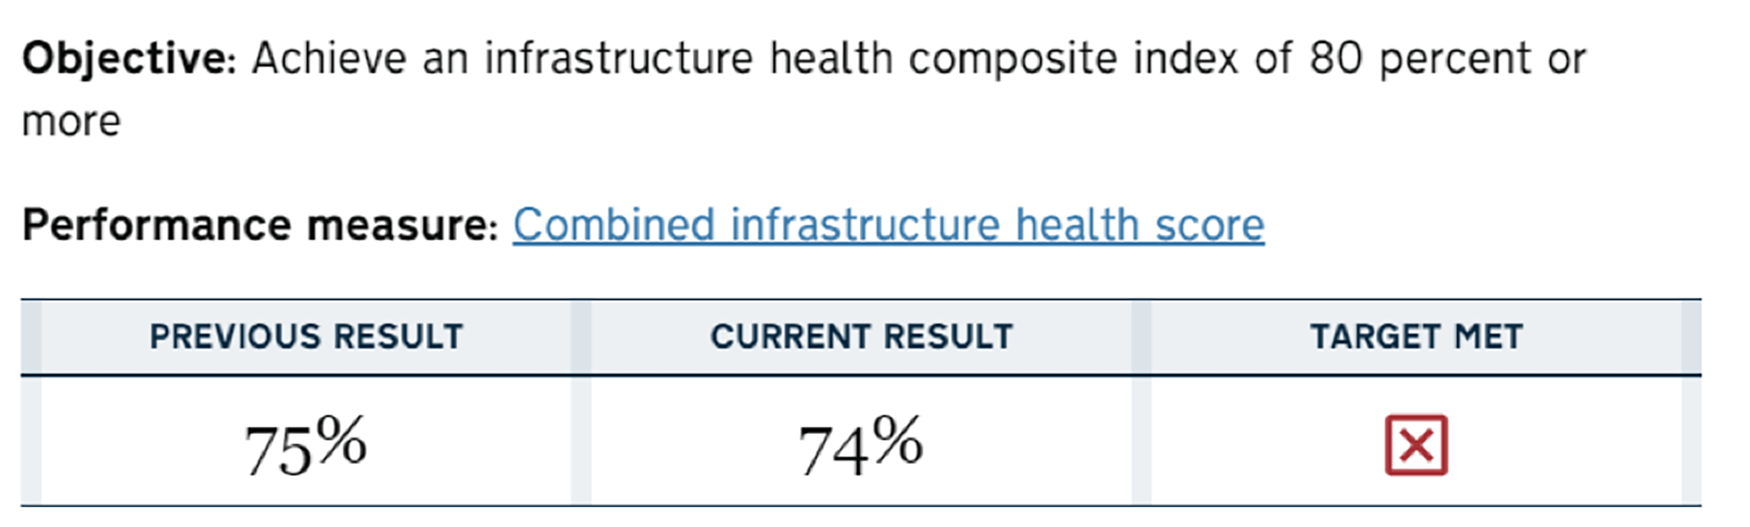
An example of how the information is shown; it presents the target for an overall infrastructure health index and the most recent results. As shown by the red “x” in the box on the far right, NCDOT is not currently meeting its target of a health index of 80 percent or more.
North Carolina DOT’s Organizational Performance Scorecard Website – Excerpt
Source: NCDOT. 2019.https://www.ncdot.gov/about-us/our-mission/Performance/Pages/default.aspx
6.1.2
Evaluating the Effectiveness of Performance Measures
Because of the important role performance measures have in supporting performance-based decisions, agencies should use care in selecting measures that drive the right types of results. This section introduces several approaches to evaluate the effectiveness of an agency’s performance measures.
Assessment
TPM Webinar #17 - Agency Innovations and Improvements Blitz
In its handbook for agency executives, AASHTO suggests an assessment of performance measures should consider the following:
- Is the number of performance numbers reasonable? – An agency should retain performance measures addressing critical areas of importance that are maintainable with time. The Maryland and New Mexico DOTs have approximately 80 measures reviewed on a regular basis, but the Florida and Pennsylvania DOTs use approximately 15 to 20 measures to review strategic performance. Some agencies identify a small number (< 10) of KPIs selected from the pool of operational and tactical measures that best reflect an agency’s progress toward achieving its overall goals.
- Are the measures meaningful? – Some agencies choose only to use easily measured performance activities because the information is easy to obtain. However, other measures may do a better job of driving good decision making.
- Does the level of detail in data collection match the level of detail required to drive decisions? – Agencies should balance data availability with the analytic rigor used to make decisions. For instance, if pavement markings are replaced every year, it is not necessary to collect retro-reflectivity information annually. Similarly, collecting data on one lane of a two-lane highway may be enough for approximating the condition across the full width of the roadway.
- Do they support the right decisions? – The performance measures should drive decisions in support of strategic objectives. For example, a performance measure based on the amount of overtime incurred after a snow event is less effective than one able to monitor the number of hours until the roads are cleared.
- Are existing data sources reliable? – In most situations, existing data can provide the information needed for performance management, but it must be reliable and maintained regularly to be useful.
An assessment of performance measures can be important, since many organizations find that over time, the number of performance measures they are managing can become unwieldy.
Pennsylvania DOT
After using performance measures for years, the Pennsylvania DOT recognized that the number of measures being used had increased to a level that was difficult to manage. In 2011, the Pennsylvania DOT conducted an assessment of their performance measures using the following series of questions to guide their decisions as to which measures to keep, which to change, or which to delete:
- Who is using the measure?
- What exactly is being measured?
- Why is this particular measure needed?
- Whose performance is being measured?
- Is the performance goal defined?
- Does a similar measure already exist?
- Is the existing measure meeting the needs and intent or should it be modified?
If a measure was needed where no measure exists, the following additional questions were used:
- Does the measure affect continuous improvement?
- Is the data for the measure updated as frequently as needed? Should it be updated monthly, quarterly, or yearly?
- Is the measure easy to quantify?
- Is the measure easy to understand?
- Is it clear who owns the measure?
- Does the measure provide a means of comparison?
- Have unintended consequences been investigated?
- Can the unintended consequences be successfully mitigated?
The process has helped to ensure that the agency is focused on the right measures to drive desired results and behaviors. The analysis found several issues that could be addressed, including eliminating duplicate or overly complicated measures, modifying measures that were driving unintended consequences, and resolving data quality issues.
SMART Evaluation
As discussed earlier, performance measures are used to set desired or targeted levels of service. Targets may be short-term, such as the 2- and 4-year targets state DOTs are required to submit to FHWA, or they may be long-term targets, such as the desired State of Good Repair (SOGR) serving as the basis for an agency’s TAMP.
Performance targets are evaluated using the “SMART” method, which evaluates whether targets are:
- Specific. The performance is explicitly described.
- Measurable. Progress towards the target can be monitored in a consistent manner.
- Achievable. The target considers past performance, expected changes in demand, available resources and other considerations that make it realistic.
- Relevant (also referenced as results-oriented). The target should be meaningful to the agency and drive the right outcomes.
- Time-related (also referenced as timely or time-bound). There is a stated timeframe for achieving the target.
Nevada DOT
The Nevada DOT recognized that although performance measures were being reported regularly, they were not driving agency policies or decisions. The assessment evaluated the performance measures being used in each of the five key performance areas shown in the figure as well as the organizational culture to support performance management.
The study recommended improvements to emphasize the importance of messaging in order to advance the agency’s performance management culture, extend the performance culture beyond the headquarters office to field staff, and develop job performance plans emphasizing accountability at the division, office and unit levels. The study also recommended the periodic review of performance measures to ensure their continued relevance to agency business processes.
Nevada DOT’s five key performance areas and measures
Source: Nevada DOT. 2017. Adapting a Culture for Performance Management at the Nevada Department of Transportation.
Benchmarking
In simple terms, benchmarking is a process of comparing performance and practice among similar organizations as part of an agency’s continuous improvement activities. Benchmarking provides an opportunity to learn about approaches used by high-performing organizations to uncover noteworthy practices, inform target-setting activities, or to foster innovation and improvement within an agency. Benchmarking should focus on improvement and lessons learned rather than as a way to penalize underperformers.
As mentioned in Chapter 1, AASHTO has developed a comparative benchmarking tool for enabling state DOTs to compare performance outcomes and practices with peer agencies as part of their continuous improvement activities (http://benchmarking.tpm-portal.com/). This includes a peer selection tool, so agencies can compare practices to peers with similar characteristics. It also features a performance comparison tool with a number of chart options enabling agencies to compare results. For instance, an agency may elect to compare pavement smoothness characteristics with a neighboring state. There is also a portal to facilitate the exchange of practices among registered DOT users through a Notable Practice Narrative.
An example from the AASHTO TPM Portal showing a comparison of bridge deck percentage determined to be structurally deficient is shown in Figure 6.2. Similar comparisons are available for safety, environmental, and non-motorized (bicycle and pedestrian) performance measures. For transit agencies, Transit Cooperative Research Program (TCRP) Report 141, A Methodology for Performance Measurement and Peer Comparison in the Public Transportation Agency, provides specific guidance for comparing performance with other agencies.
Figure 6.2 Example Performance Comparison from the AASHTO TPM Portal
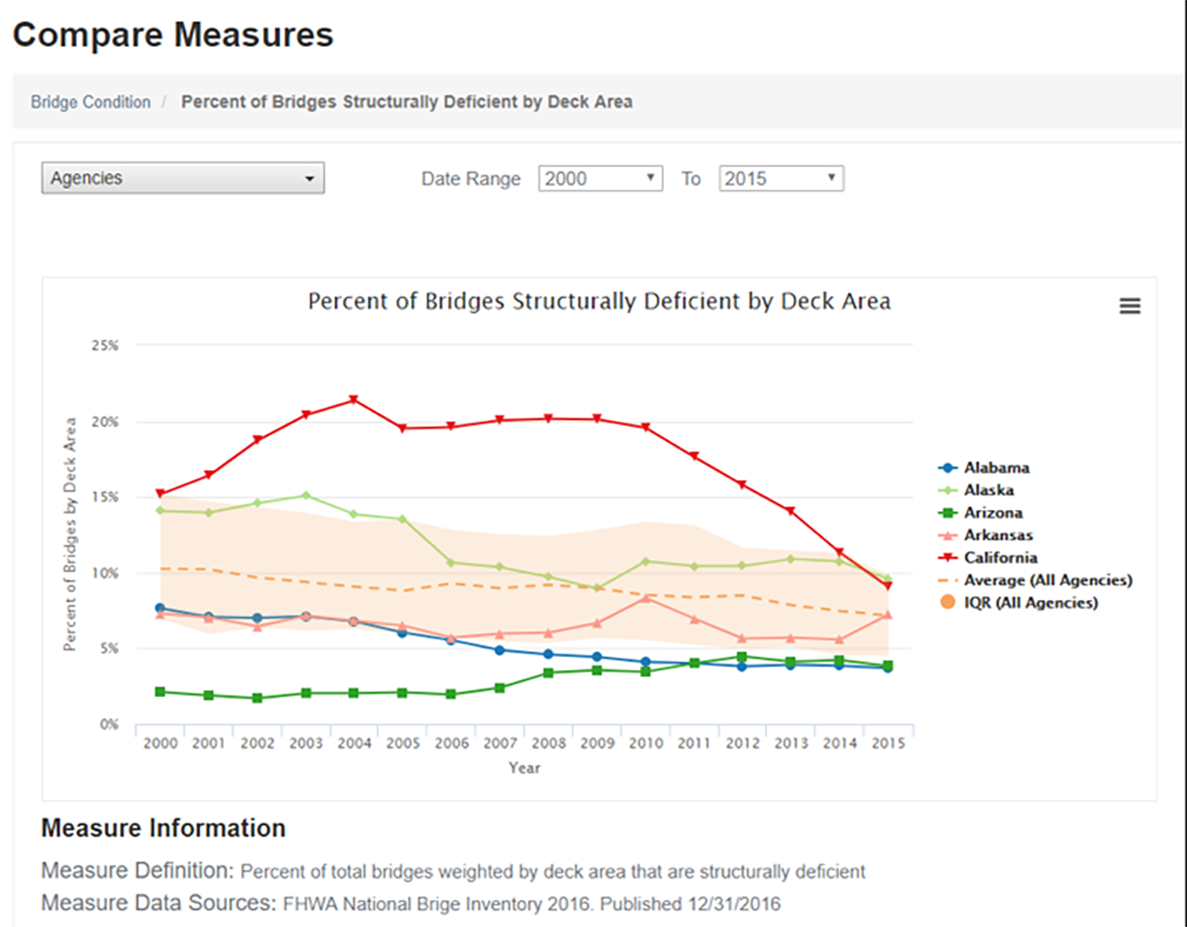
Source: TPM Portal. 2019. http://benchmarking.tpm-portal.com/compare/bridge-condition/deficient-bridges
Audits
Internationally, ISO standards include the conduct of periodic internal audits to help an agency evaluate whether its asset management program and components meet the agency’s needs, adhere to best practices and are being used to support decisions. In addition, agencies use auditing for service providers to confirm contract compliance in situations where road network maintenance and management activities have been outsourced.
TIP
The AASHTO TPM Benchmarking Tool (http://benchmarking.tpm-portal.com/) was designed to assist state DOTs with benchmarking TPM data, providing a data source and comparison tools.
6.1.3
Target Setting Methods
This subsection outlines methods for setting transportation performance targets, focusing on safety, infrastructure condition, reliability, and traffic congestion. It introduces quantitative target-setting approaches, such as policy-based methods, historical trends, probabilistic approaches, statistical models, and summarizes their ease of application, technical robustness, ease of communication, and support for agency policies. The guide also offers suggestions for selecting an appropriate target-setting approach.
Introduction
NCHRP Research Project 23-07, Guide to Effective Methods for Setting Transportation Performance Targets, presents several approaches for setting performance targets to support a TPM framework. It focuses on target setting for the national measures that are required under federal TPM requirements, including:
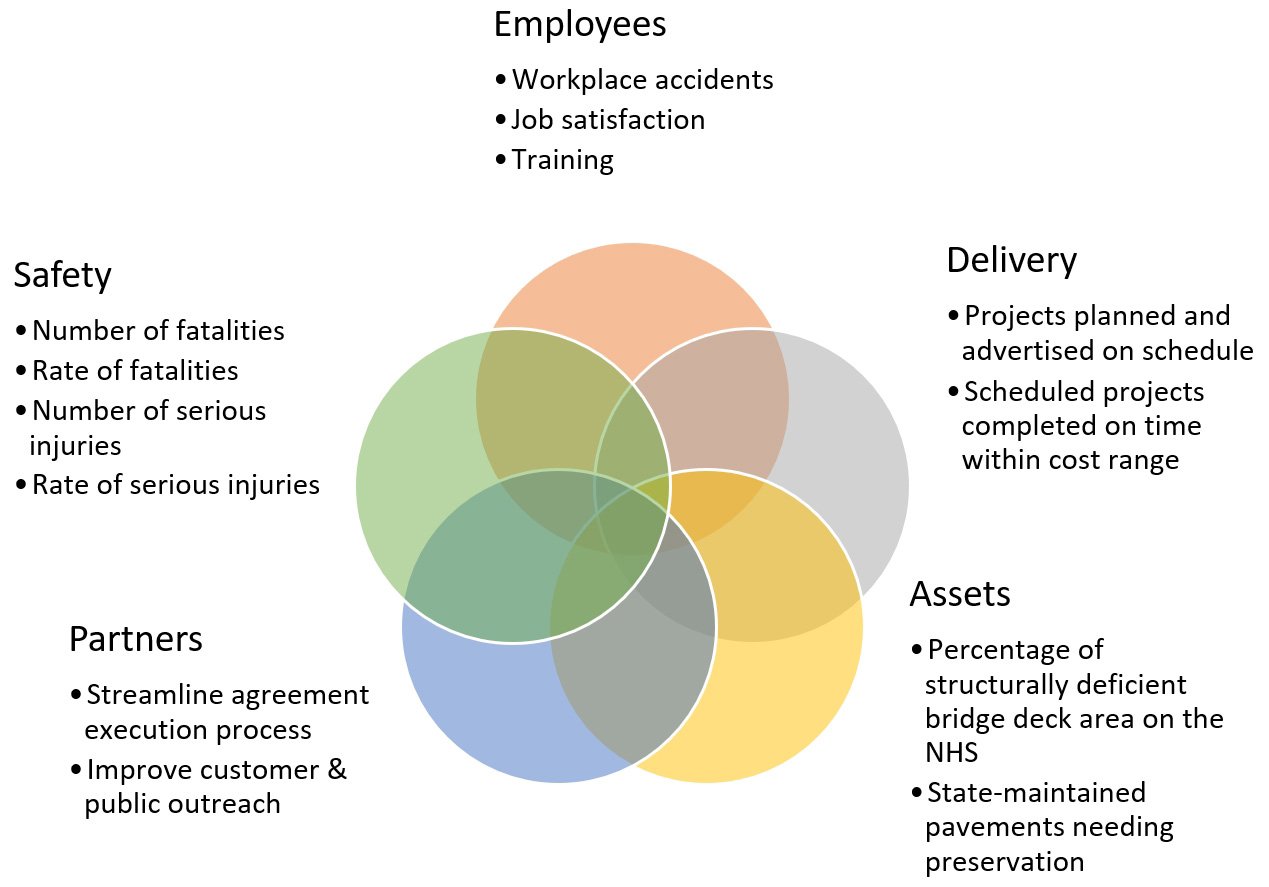
- Safety measures: Number of fatalities, rate of fatalities, number of serious injuries, rate of serious injuries, number of nonmotorized fatalities and nonmotorized serious injuries.
- Infrastructure condition measures: Percentage of the Interstate system pavements in good and poor condition, percentage of the non-Interstate NHS pavements in good and poor condition, and percentage of the NHS bridges in good and poor condition.
- Reliability (travel time and freight) measures: Percentage of person miles traveled on the Interstate and Non-Interstate NHS that is reliable and truck travel time reliability index.
- Congestion measures: Annual hours of peak hour excessive delay per capita and percentage of non-single-occupancy vehicle travel.
- Target setting for nonrequired measures, such as accessibility, greenhouse gas emissions, active transportation, transit ridership, and customer satisfaction are included in the final section of the guide.
TPM Webinar #12 - Target Setting
Target Setting Approaches
The guide recognizes that transportation agencies take different approaches to target setting. Some may prioritize setting realistic targets based on fiscal constraints. Other agencies may set aspirational (or fiscally unconstrained) or conservative targets.
Regardless of the approach to target setting, the guide recognizes that both quantitative and qualitative approaches may be considered. In some instances, qualitative approaches that are heavily influenced by politics or agency leadership may be appropriate. An annual target to reduce fatalities to address a long-term Vision Zero goal is an example of a qualitative target. Other approaches may use statistics or probabilities to define a quantitative target. The use of travel demand forecasts to set a mobility target illustrates the use of a quantitative approach to target setting. A combination of qualitative and quantitative approaches may also be used to set effective targets.
The following five quantitative methods for setting targets are presented in detail within the guide (Grant, M., et.al. 2023A):
- Policy-based approaches, such as establishing a maximum rate of change (e.g., annual increase of at least 2 percent).
- Historical trends (e.g., set a value based on a 5-year trend).
- Probabilistic and risk-based approaches that consider performance variability (e.g., performance based on the likelihood of increased storm frequency and intensity).
- Statistical models (e.g., rates of deterioration based on regression models).
- Other tools and models (e.g., output from a bridge or pavement management system).
When selecting the appropriate method for target setting, the guide offers the following tips (Grant, M., et al. 2023A):
- Understand the complexity of the methods - some methods require sophisticated data that may not be readily available and may result in marginal improvements in the target's effectiveness.
- Consider combining methods - by using several approaches, an agency has the benefit of considering the results from multiple methods in setting the final target.
The Guide (NCHRP Report 1035) presents several target-setting methods for each of the Federal performance measure categories along with a summary of their ease of use, robustness, ease of communication, and support for agency policies. A high-level synopsis of the information presented in the Guide is presented in the following table.
Table 6.2 - Features associated with different target-setting approaches (based on Grant, M., et.al. 2023A)
| Federal Performance Measure Category | Target Setting Approach | Description | Ease of Application | Technical Robustness | Ease of Communication | Allows for Policy Preference |
|---|---|---|---|---|---|---|
| Safety | Targeted Reduction | Defined decrease from baseline regardless of past trends | H | L | H | H |
| Safety | Time-Series Trend | Based solely on historical performance data | H | M | H | L |
| Safety | Trend Plus Other Factors | Adjustments made to results from other approaches | H | L | M | H |
| Safety | Multivariable Statistical Model | Statistical analysis considering multiple variables | L | H | M | L |
| Infrastructure Condition | Target Based on Change in Condition | Consensus decision | H | None | L | H |
| Infrastructure Condition | Time-Series Trend | Based solely on historical performance data | H | L | M | M |
| Infrastructure Condition | Time-Series Trend Plus Future Funding | Historical trends extrapolated into the future | H | L | M | M |
| Infrastructure Condition | Asset Management System | Condition forecasts based on expected funds | L | H | M | M |
| Infrastructure Condition | Scenario Analysis | Management system analysis of multiple scenarios | L | H | M | M |
| Reliability | Building off the Baseline with Assumptions | Qualitative approach to adjusting baseline values | H | L | H | M |
| Reliability | Time-Series Trend Analysis | Based solely on historical performance data | H | M | M | M |
| Reliability | Trend Plus Other Factors | Adjustments made to results from other approaches | H | M | M | M |
| Reliability | Performance Risk Analysis | Statistical analysis of variations due to risks | M | H | M | M |
| Reliability | Segment Risk Analysis | Analysis of individual segments to determine those that shift between reliable and unreliable | L | H | M | M |
| Reliability | Multivariable Statistical Model | Statistical analysis considering multiple variables | L | H | L | L |
| Traffic Congestion | Building off the Baseline with Assumptions | Qualitative approach to adjusting baseline values | H | L | H | H |
| Traffic Congestion | Time-Series Trend Analysis | Based solely on historical performance data | M | M | M | M |
| Traffic Congestion | Trend Plus Other Factors | Adjustments made to results from other approaches | M | M | H | H |
| Traffic Congestion | Travel Forecasting Model | Model used to estimate excessive delay for the base year and forecasted year | H | M | M | L |
| Traffic Congestion | Policy Based | Model based on regional policy goals | H | L | H | H |
Features Summary (L=Low, M=Medium, H=High)
New Jersey DOT
NCHRP Web-Only Document 358, which is a supplemental report to the Guide to Effective Methods for Setting Transportation Performance Targets, provides examples documenting how target-setting methods are being used by various transportation agencies. One of the examples illustrates how the New Jersey DOT piloted the use of a scenario analysis approach for setting its pavement infrastructure condition targets. An important consideration in the use of this approach was the availability of a pavement management system (PMS) capable of forecasting future pavement conditions. However, the New Jersey DOT had not established prediction models for the Federal cracking metric, so methods were developed to correlate forecasted conditions from existing models to the Federally-required cracking metric. Correlations were developed using three years of condition data collected in accordance with both the agency’s legacy Condition Status rating and the Federal measures in 0.1-mi segment lengths. Using both sets of data, correlations were developed based on the likelihood that a pavement section rated “Good” using the agency’s CS rating would also be classified as a “Good” pavement using the Federal definitions. The correlations found that 88.43 percent of the segments were rated “Good” based on both approaches (Grant, M., et.al. 2023B). A similar approach was used to correlate “Poor” conditions, but the analysis showed more variability in correlating segments at this condition level. To address the variability, New Jersey DOT decided to use 3-year averages to establish the final correlations, which are presented below (Grant, M., et.al. 2023B).
Table 6.A - Correlation between NJDOT CS and Federally-mandated condition ratings (Grant, M., et.al. 2023B)
| Federal Good | Federal Fair | Federal Poor | |
|---|---|---|---|
| NJDOT Good | 87.5% | 13.78% | 0.00% |
| NJDOT | 23.74% | 76.25% | 0.01% |
| NJDOT | 6.36% | 86.02% | 7.62% |
The correlations were applied to the predicted conditions generated by the PMS to determine the expected conditions using the Federally-mandated performance measures. Several scenarios were generated, allowing the NJDOT to use the results to set realistic Federal targets.
Addressing Disruptions to Performance in Target Setting
It is inevitable that agencies will face events that disrupt what might be expected to be typical performance. Sometimes these events alter performance for a short period of time before performance returns to typical patterns. In other situations, the event may alter performance for a long period of time, as the changes associated with working from home following the COVID-19 pandemic have had on traffic patterns, congestion, and safety. The guide provides examples illustrating times when an agency might choose to include or exclude the disruption or use the disruption to alter previous performance patterns.
Monitoring the State of Assets
Performance-based decision making depends on the availability of reliable and consistent data. For asset management decisions, asset inventory and condition information is most commonly used; however, other performance characteristics may also be used to monitor performance. This section introduces the types of inventory and condition information commonly used to support asset management decisions and describes strategies for keeping the data current. This section does not describe the methods used to collect inventory and condition information. That information is provided in
Chapter 7.
6.2.1
Types of Performance-Based Data to Monitor
This section describes the types of information that should be collected and maintained to support performance-based decisions for physical assets. This section focuses on asset inventory and condition information for life cycle management, but recognizes that other operational performance characteristics may be important to determine whether an asset is fulfilling its intended function.
Differences in Performance and Condition
The terms ‘performance’ and ‘condition’ are often used interchangeably, although they have different meanings in a performance-based environment. The performance of an asset relates to its ‘ability to provide the required level of service to customers3’ while condition is generally considered to mean the observed physical state of an asset, whether or not it impacts its performance. For example, a bridge with scour may continue to perform adequately in the short-term even though it may receive a low National Bridge Inventory (NBI) rating because of the deterioration.
Inventory Information
An asset inventory provides information other than performance data important for estimating the amount of work needed, identifying the location of work in the field and determining characteristics capable of influencing the type of work to be performed. The RCM approach introduced in Chapter 4 can be used to help an agency determine what information is needed to support the management of each type of asset. The asset inventory requirements for those assets managed based on a specified interval for repair, such as pavement markings, is very different than those required for an asset managed using a condition-based approach, such as pavements or bridges. Regardless of how detailed the asset inventory is, it is important an agency establish processes to ensure data quality and keep the inventory current over time.
There are several basic data attributes essential to effectively managing transportation assets, including asset type, quantity and location. Additional information that is important is to differentiate between the types of work to be performed, which may also be added to the inventory, the type of material used to construct the asset, the last time work was performed and factors influencing the use of the asset (e.g. traffic levels, highway functional classification or climatic conditions).
As discussed in Chapter 7, managing asset inventory information using an integrated approach to data management helps promote consistency in asset data across an agency and provides access to help ensure the data is used by decision makers at all levels of the organization. An out-of-date inventory makes it difficult for an agency to estimate work quantities accurately for budgeting purposes.
Condition Information
Asset condition information is used to determine how assets are performing and how performance changes over time. The lack of condition information may lead to premature or unexpected failures with the potential to be very costly, negatively impacting system performance and increasing agency risks. Methods of collecting asset condition information are discussed further in Chapter 7. To ensure that condition information remains current, it is important that the information is updated on a regular basis.
Asset Condition
There are several approaches for assessing asset conditions, each of which is influenced by the type of asset and the resources available to support the process. Typically, an assessment of asset condition involves a method of evaluating the presence of deficiencies and/or deterioration at the time of inspection. The results are used to assign a rating or LOS used to determine the need for maintenance, rehabilitation or replacement now or in the future. Asset condition ratings may also be used to establish rates of deterioration, allowing an agency to forecast future conditions for planning purposes.
Examples of commonly used types of asset condition ratings are listed below.
- A pavement condition index based on the type, amount and severity of distress present, which could be on a 0 to 100 scale, with 100 representing an excellent pavement.
- The National Bridge Inventory (NBI), which assigns a rating between 1 and 9 based on the deterioration present in each element (deck, superstructure, substructure and culvert).
- A LOS rating of A to F for maintenance assets, such as the percent blockage in a culvert or the percent of guardrail not functioning as intended.
Maintaining asset condition information is important for evaluating performance to determine whether improvements are needed to achieve the agency’s strategic objectives. The lack of current condition information, or a lack of confidence in the condition information, makes it difficult to present investment needs to stakeholders with any degree of confidence.
Asset Performance
The results of condition surveys or inspections are used to evaluate the performance of each asset in terms generally understood by stakeholders, such as Good, Fair or Poor.
It is common for transportation agencies to report the percent of the network in Good or Fair condition or the percent of drivers traveling on roads in Good and Fair condition. Asset performance can also be reported in terms of a health index, such as the Remaining Service Life (RSL) used by some state DOTs to indicate the amount of serviceable life left in the asset. In the maintenance community, some state DOTs have developed a Maintenance Health Index or overall LOS grade to represent the performance of the entire Maintenance Division rather than report the grades of each category of assets separately.
Asset performance also influences overall system performance, as demonstrated by the impact on system reliability associated with unplanned road or bridge closures due to flooding or an on-going lack of maintenance. Performance data related to delay, unplanned closure frequency, GHG emissions, and crash locations may all be impacted by asset conditions and affect an agency’s ability to achieve its broader, strategic performance objectives such as system reliability, congestion reduction, environmental sustainability, and freight and economic vitality. For example, it is important to monitor performance characteristics such as travel time reliability to determine whether capital improvements are needed to add additional lanes or whether ITS assets could improve traffic flow during peak periods.
Ohio DOT
The Ohio DOT recognizes the importance of integrated management systems to support both life cycle and comprehensive work planning activities. One of the tools developed by the Ohio DOT is its Transportation Information Mapping System (TIMS), which enables planners, engineers and executives to access and manage key asset, safety and operational data in an integrated web-mapping portal (https://gis.dot.state.oh.us/tims). The portal is available to both internal and external stakeholders and allows users to access information about the transportation system, create maps or share information. The data integration efforts enabling TIMS are now underpinning all management system implementations.
6.2.2
Maintaining Asset Data
This section describes several approaches to keeping asset inventory and condition information current, so it can be used reliably to track accomplishments and evaluate current and future needs. The methodologies used to collect the asset information is discussed in Chapter 7.
Maintaining Inventory Information
One of the challenges transportation agencies face is keeping their asset inventory current, because it can require business processes dependent on individuals or agency work areas that differ from the primary asset owners. For example, construction may be responsible for installing new guardrails as part of a pavement-resurfacing project, but the information is not always made available to the maintenance division responsible for budgeting and scheduling guardrail repairs.
Establishing Processes to Update Inventory Information
Some types of inventory information change regularly while other information changes infrequently. As a result, it is important to classify each type of data and establish procedures in order to ensure the inventory is updated as information changes. An agency should establish business processes to ensure any changes to the inventory are reflected in relevant databases. For example, each time a pavement improvement project is completed, the database should be updated with information about the new surface type, the project completion data and the other assets replaced as part of the project. Establishing these processes and holding individuals responsible for updating this information are important for the ongoing success of a performance-based management approach.
Maintaining Condition Information
Asset condition and performance information must also be updated on a regular cycle. In some cases, data collection cycles are mandated by regulations, such as federal requirements for reporting pavement and bridge condition information on the National Highway System. Where there are no requirements in place for condition reporting, the update frequency should be determined based on the resources available, how the asset is managed and the data analysis cycle. Different update frequencies may be established for different types of assets.
Asset condition information may be collected based on a regular interval schedule or an inspection may be triggered based on the asset’s condition. For example, an asset in poor condition may require inspection more frequently than an asset in good condition. In general, asset information is updated on a 2- to 4-year cycle, but in some cases asset data is collected more frequently. For instance, some agencies collect performance data on maintenance assets several times a year to ensure they are in good working order and performing as expected. The condition of other assets with a slower rate of deterioration may be conducted less frequently.
Virginia DOT
The Virginia DOT maintains most of the assets on state roads and regularly assesses the condition of those assets for determining investment needs. For pavements and bridges, there are asset leads at both the central office and in the districts to monitor conditions and update the database based on work completed. Asset leads at the central office manage statewide data monitoring and analysis and provide guidance on the work that is needed. The asset leads in the districts are responsible for implementing the work and recording completed work in the bridge and pavement management systems so the information is always current.
Monitoring Funding and Resource Allocation Methods
Understanding past funding and resource allocation trends provides valuable context for future investment strategies. This section discusses the types of trends commonly used in TAM and illustrates how the trends can be used to adjust a program.
6.3.1
Types of Funding and Resource Allocation Trends
This section describes several funding and resource allocation trends that are commonly used by the transportation industry.
Funding and Resource Allocation Trends
Historical trends related to the performance and condition of the highway system or the way investments have been made provide useful information for estimating future investment needs. These trends contain important insights into future needs and highlight the consequences associated with different tradeoffs in the various use of funds. This information can be useful in developing the life cycle management and financial planning portions of a TAMP.
The FHWA introduces the importance of historical trends for the following reasons:
- Illustrating whether past expenditures were adequate or whether they need to increase
- Helping an agency shift from a budgeting process based on incremental growth in expenditures to a performance-based approach addressing need
- Building agency confidence in forecasting future investment needs and conditions
Types of funding and resource allocation trends commonly include:
- Revenue trends over time by funding source
- Funding allocations by program category over time
- Expenditures by asset and work category over time
- Expenditures by system (e.g., Interstate, non-Interstate NHS and non-NHS) over time
- Expenditures by district or region over time
Revenue Trends by Funding Source
A summary of revenue trends by funding source provides an agency with a foundation for projecting the amount of revenue available in future years to address asset needs. These trends help an agency understand whether revenues are increasing or decreasing, identify which revenue sources have significant amounts of variability or more consistent growth rates over time, and illustrate whether the agency is relying on unsustainable funding. The information is a vital foundation for forecasting future revenue levels for planning purposes and helping formulate the assumptions upon which future revenue forecasts are based.
An example of a revenue trend table is provided in Table 6.3. The trends illustrate which revenue sources have increased or decreased over time and are thus important for making future revenue projections. The table also highlights how overall funding levels peaked between 2007 and 2009 largely due to state bonds in 2007, federal bonds in 2007 and 2009 and one-time ARRA (American Recovery and Reinvestment Act) funding in 2009. When these three funding sources ended, the available revenue reverted to 2005 levels. If the effects of inflation were taken into consideration, the agency could also show how the purchasing power of available funding has dropped in later years.
Table 6.3 Example of Historical Revenue Trends by Funding Source
| Sources | 2003 | 2005 | 2007 | 2009 | 2011 | 2013 | 2.15 |
|---|---|---|---|---|---|---|---|
| State Motor Fuel Tax | $658 | $651 | $644 | $637 | $630 | $624 | $617 |
| License, Vehicle Fees | $60 | $60 | $59 | $57 | $53 | $50 | $50 |
| Other | $21 | $21 | $23 | $22 | $21 | $22 | $22 |
| State Bonds | $20 | $76 | $296 | $92 | $0 | $0 | $0 |
| Federal-Aid | $725 | $789 | $825 | $857 | $900 | $888 | $877 |
| ARRA | $0 | $0 | $0 | $273 | $10 | $0 | $0 |
| Federal Bonds | $0 | $0 | $120 | $80 | $0 | $0 | $0 |
| Total Revenue | $1,484 | $1,597 | $1,967 | $2,018 | $1,614 | $1,584 | $1,566 |
Source: NHI 136002 – Financial Planning for Transportation Asset Management. Participant Workbook.
Funding Allocations by Program Category
Transportation agencies typically track funding allocations and expenditures by program category, but the number of categories and the category descriptions may vary depending on the agency. In general, funding allocations are tracked separately for the highest-value assets and the performance of these assets are incorporated into the agency’s strategic goals. This may lead agencies to track investments made in pavements, bridges, maintenance, safety and other assets. Within each of these categories, agencies can project the level of funding expected and predict the conditions and performance expected for it. Past trends in funding allocations by category can help indicate whether expected funding will be adequate to achieve the stated objectives.
Expenditures by Asset and Work Category
Information on past expenditures by asset and work type, along with resulting conditions, provides insight into the amount of funds needed for these activities in future years or helps set expectations for conditions achievable in future years. Where there are differences in planned expenditures and needed expenditures, the agency may report the existing financial gap.
Expenditures by System
Expenditures by system also provide valuable information, laying the groundwork for predicting how future funding levels will impact the condition of the Interstate, non-Interstate NHS and non-NHS assets. The information by system also conveys the agency’s past priorities for system investment, with higher levels of investment in high-volume facilities being common.
Expenditures by District or Region
Trends showing expenditures by district or region may be used to identify geographical areas requiring more focus on a particular type of work or experiencing an accelerated rate of asset deterioration. Information provided at this level can also be used to identify differences in production rates with the potential to serve as the basis for improving future practices. For example, a district with an unusually high production rate for repairing guardrail end treatments could share its experiences with other districts to improve the overall productivity rate at the statewide level.
Overcoming Challenges Associated With Trend Analysis
It can be difficult to predict future trends based on historical data, especially when there is a significant amount of variability occurring. For example, the FHWA construction inflation trends shown in Figure 6.3 illustrate how variability can have a significant impact on historical trends. In this example, the FHWA National Highway Construction Cost Index has a compound annual growth rate of 1.16 percent between 2003 and 2014. However, between 2005 and 2008, significant inflation occurred. An agency preparing a construction estimate in 2006 would look very different than one developed in 2003 or 2013. To address this type of challenge, the agency can include any assumptions made, when preparing an estimate based on trends with significant variability. It could also conduct a sensitivity analysis to better understand the consequences of the potential variability.
Figure 6.3 Actual and Compound Average Annual Construction Inflation Trends between 2003 and 2014
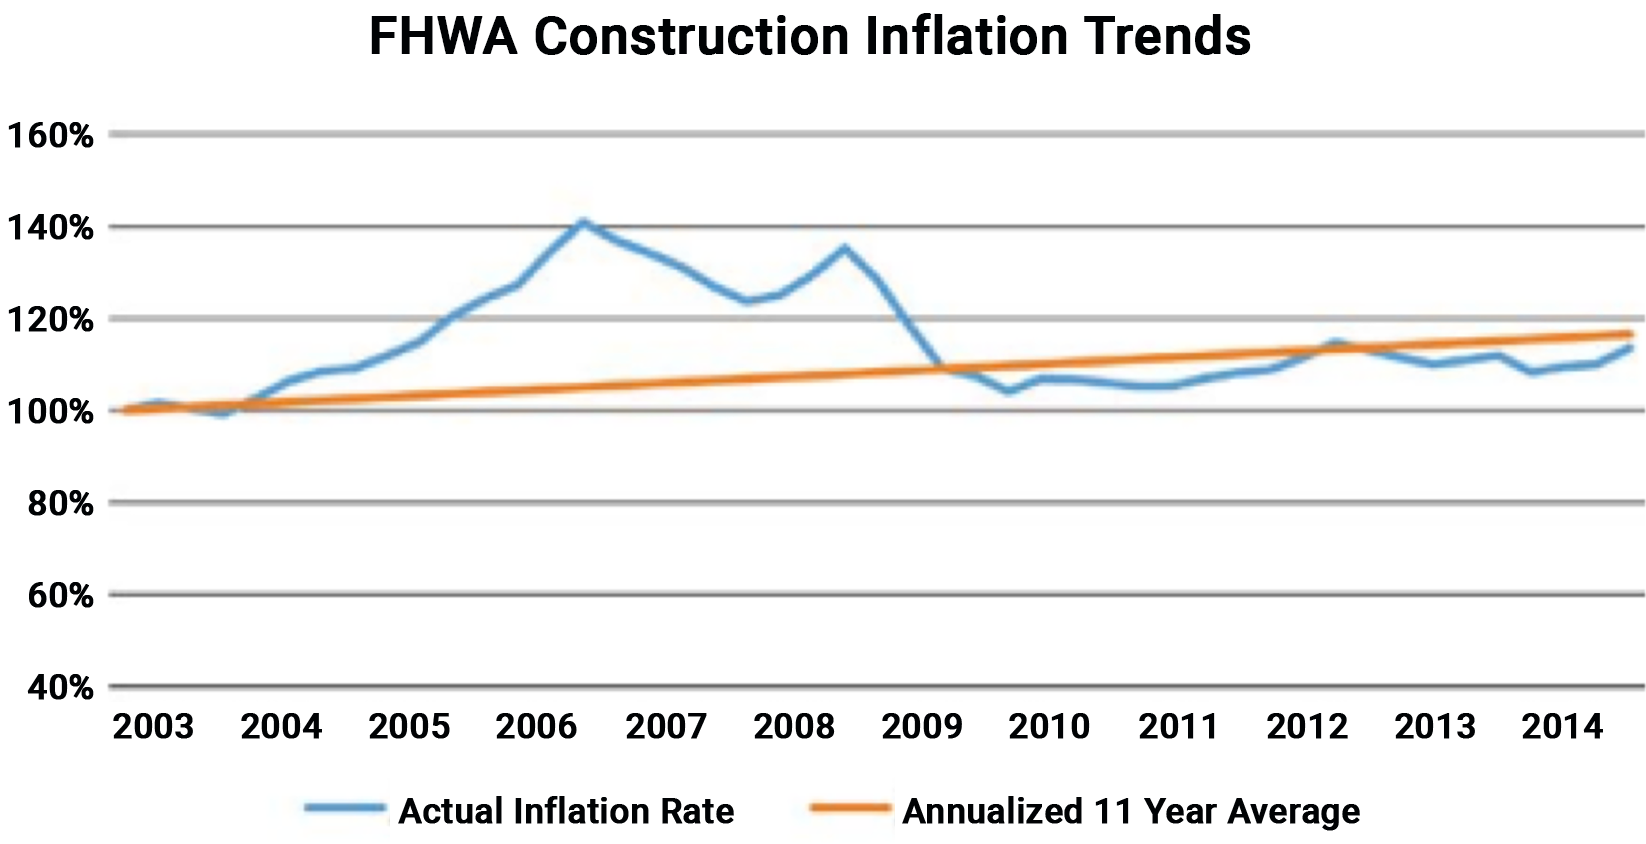
Source: FHWA. 2015. Managing Risks and Using Metrics in Transportation Asset Management Financial Plans.
Another challenge in using trends is the fact that past performance does not guarantee future results, especially if there have been changes in the condition impacting performance. For example, a bridge may have performed well for years, but changes in traffic volumes and weights could significantly increase the rate at which the bridge deteriorates. Similarly, the use of new bridge deck materials may last longer than the materials used previously. To address these challenges, an agency may find it beneficial to modify historical models to better reflect current and future conditions. Monitoring performance over time will allow the agency to develop new models specific to changes in traffic or materials.
A third challenge arises in trying to develop trends for expenditures in work activities when there are inconsistencies within the agency as to what treatments are included in each category. This typically occurs with work activities related to maintenance and preservation. For example, the categorization of a treatment may vary depending on whether the work was performed by inhouse forces or a contractor. Another example is when a preservation treatment is used as a stop-gap improvement on a project that needs more substantial repairs. Again, the actual performance of the stop-gap improvement could be much shorter than the application of that same treatment when used as a preservation improvement. The absence of standardized work categories or the use of stop-gap treatments consistently across the agency can make it difficult to show meaningful performance trends for these types of activities. As a result, it can be difficult to show the benefits associated with these treatments. The solution is to define treatments consistently throughout the agency and to ensure that the treatments are being used as expected.
6.3.2
Using Trend Data to Make Program Adjustments
This section illustrates how some agencies have successfully used historical trends to make program adjustments.
Adjusting a Program Based on Trends
TAM Guide Book Club #8: Strengthening How Data Supports Your TAM Program
The availability of historical trends is integral for making future projections as part of the planning and programming process. As shown by the examples included in this section, agencies have used trend data creatively to make program adjustments and more effectively align planned investments with strategic objectives.
Minnesota DOT
The Minnesota State Highway Investment Plan (MnSHIP) outlines a 20-year strategy for investing in the state highway system. The most recent document, published in 2017, outlines investment priorities for the period from 2018 to 2037 (http://minnesotago.org/application/files/3414/8431/5979/ MnSHIP_Final_Jan2017.pdf). One of the figures included in the plan uses historical inflation trends to illustrate the declining purchasing power of revenue due to construction costs growing at an annual rate of approximately 4.5 percent. This cost growth rate exceeds the projected annual revenue growth rate of approximately 2 percent, which is expected to erode over half of the buying power of revenues by 2037. As a result of this analysis, MnDOT was able to communicate its financial situation with stakeholders and could better manage the risks associated with continued construction cost increases over the planning period.
Anticipated Construction Revenue by Year Including Adjustments for Inflation
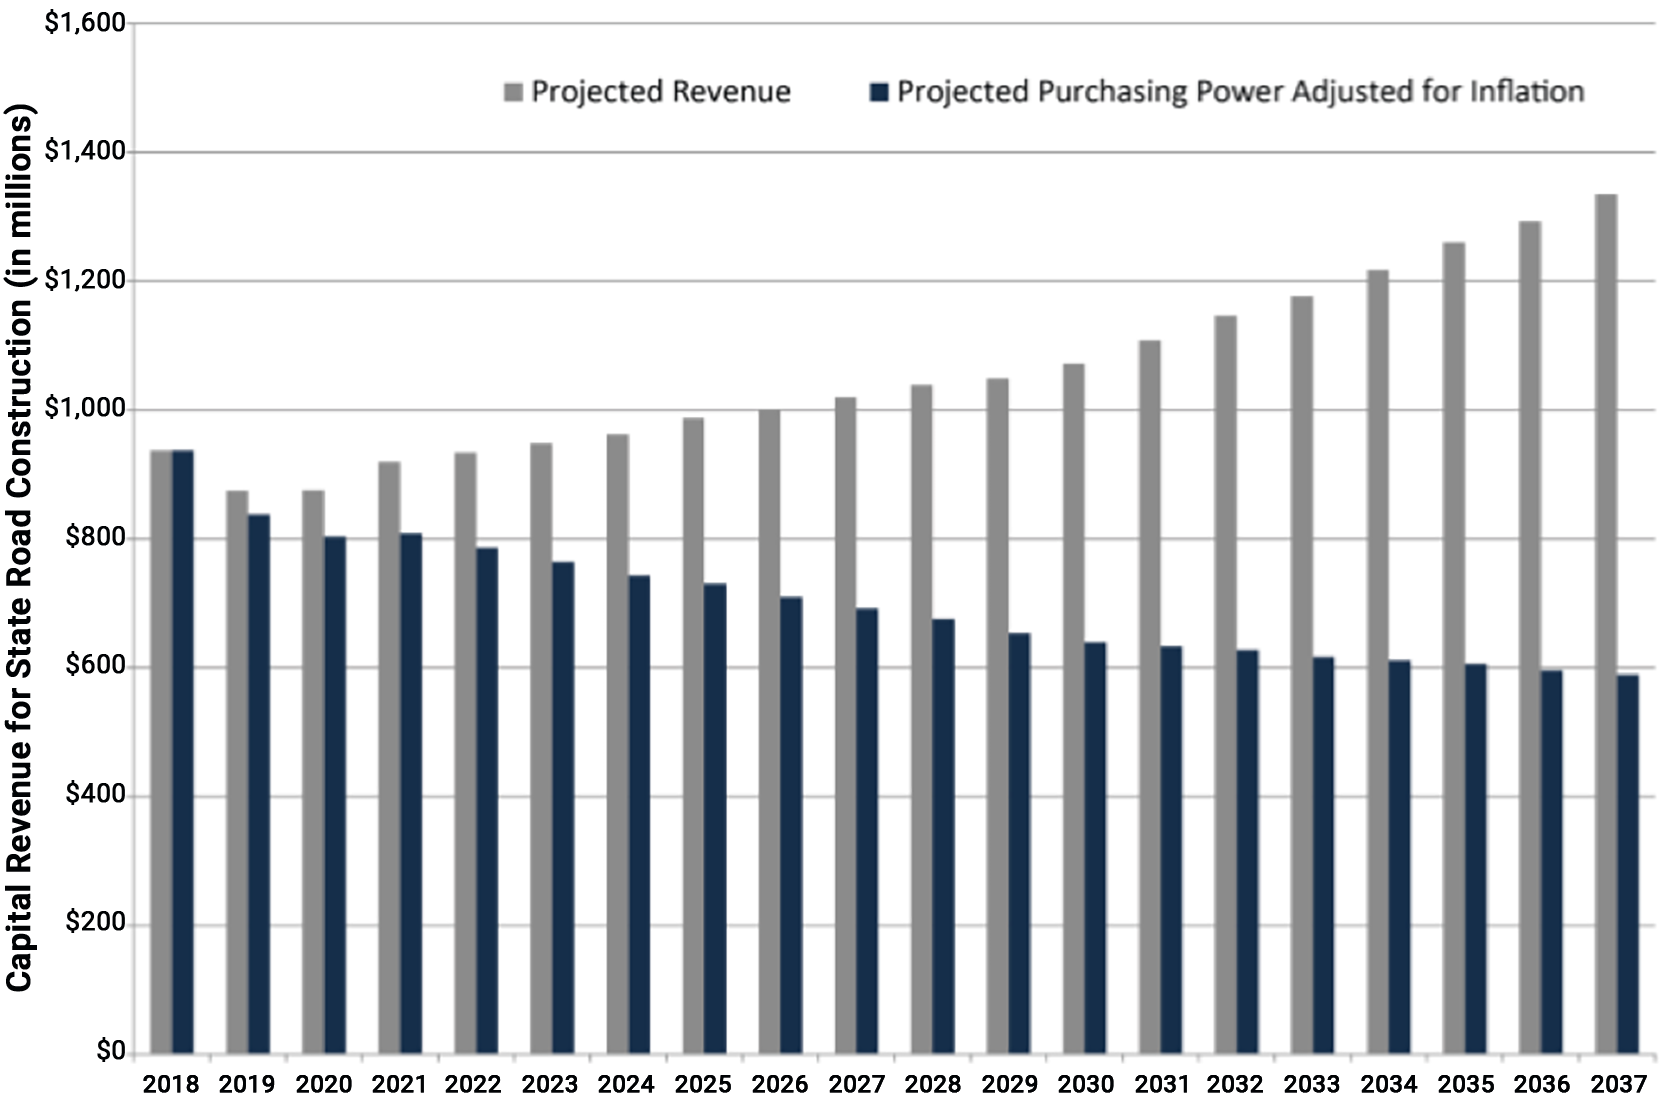
Source: Minnesota DOT. 20-Year State Highway Investment Plan 2018-2037.
Illinois DOT
The Illinois DOT used a graph showing the number of miles of state-maintained roads in need of unfunded rehabilitation or reconstruction, which was referred to as the backlog. The graph, shown in the figure to the right, illustrates the fact that the backlog was growing over time due to the inadequacy of funding. The increasing trend in backlog prompted the Illinois DOT to reconsider its approach to selecting projects and treatments, moving towards the increased use of preservation treatments to slow the rate at which pavement conditions drop into a backlog condition. In addition to the change in treatments, the Illinois DOT developed a new pavement performance measure based on the percent of the network in good enough condition to be a candidate for a preservation treatment. The change in performance measure was intended to shift funding priorities from deteriorated pavements to those that could be kept in good condition for a longer period of time. The changes were documented in the Illinois DOT’s April 2018 Transportation Asset Management Plan (http://www.idot.illinois.gov/transportation-system/ transportation-management/planning/tamp) and were used in developing the fiscal year 2019-2024 Multi-Year Proposed Highway Improvement Program. In addition, new software tools are being acquired to further support this improved approach to managing pavements and bridge assets.
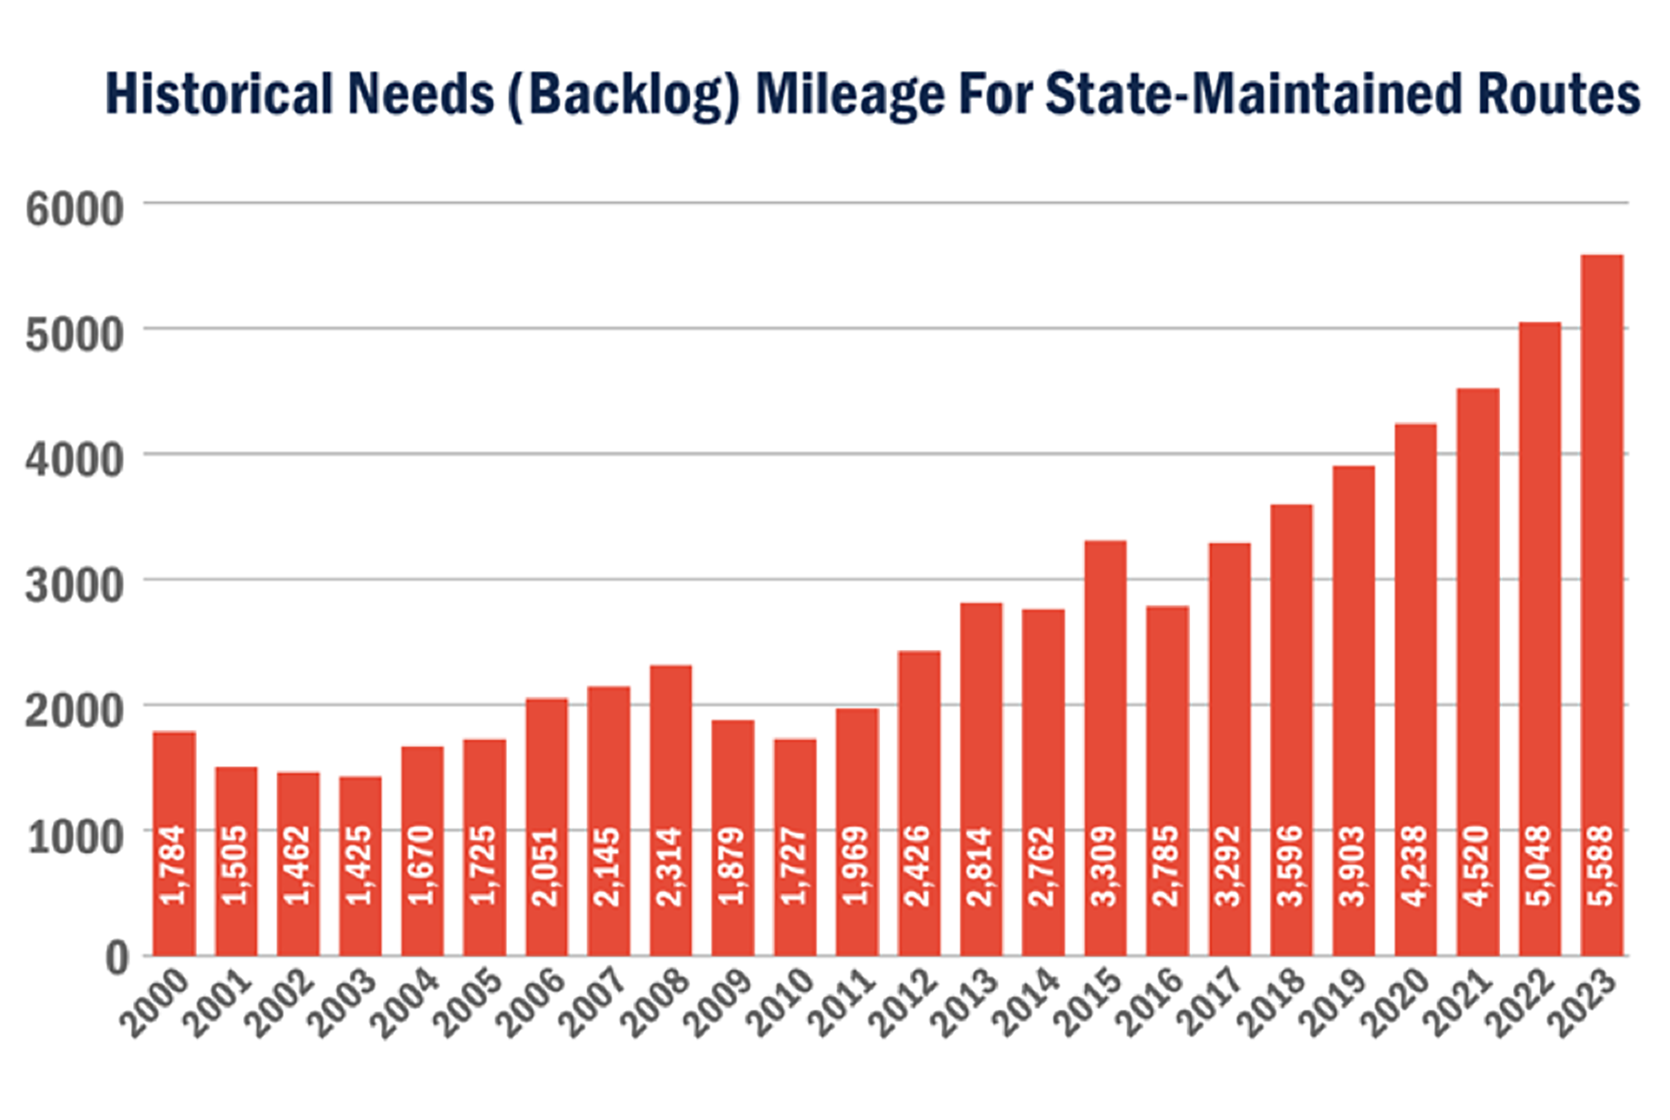
Source: Illinois DOT Transportation Asset Management Plan. 2018.
New Mexico DOT
In 2004, the New Mexico DOT realized that a significant percentage of state-maintained bridges were classified as structurally deficient. To address this issue, the agency targeted increased investments in bridge preservation. Going forward, the agency funded rehabilitation activities for bridges in poor condition and added preventive maintenance activities for bridges in good or fair condition to slow the rate of deterioration on these bridges. As shown in the figure to the right, the program has been very effective in improving bridge conditions. Adding a line to the graph showing the targeted conditions would help convey the impact that the increased preservation expenditures have had on achieving performance objectives.
Trend Showing the Decrease in Structurally Deficient Bridge Deck Area Resulting from Targeted Investments
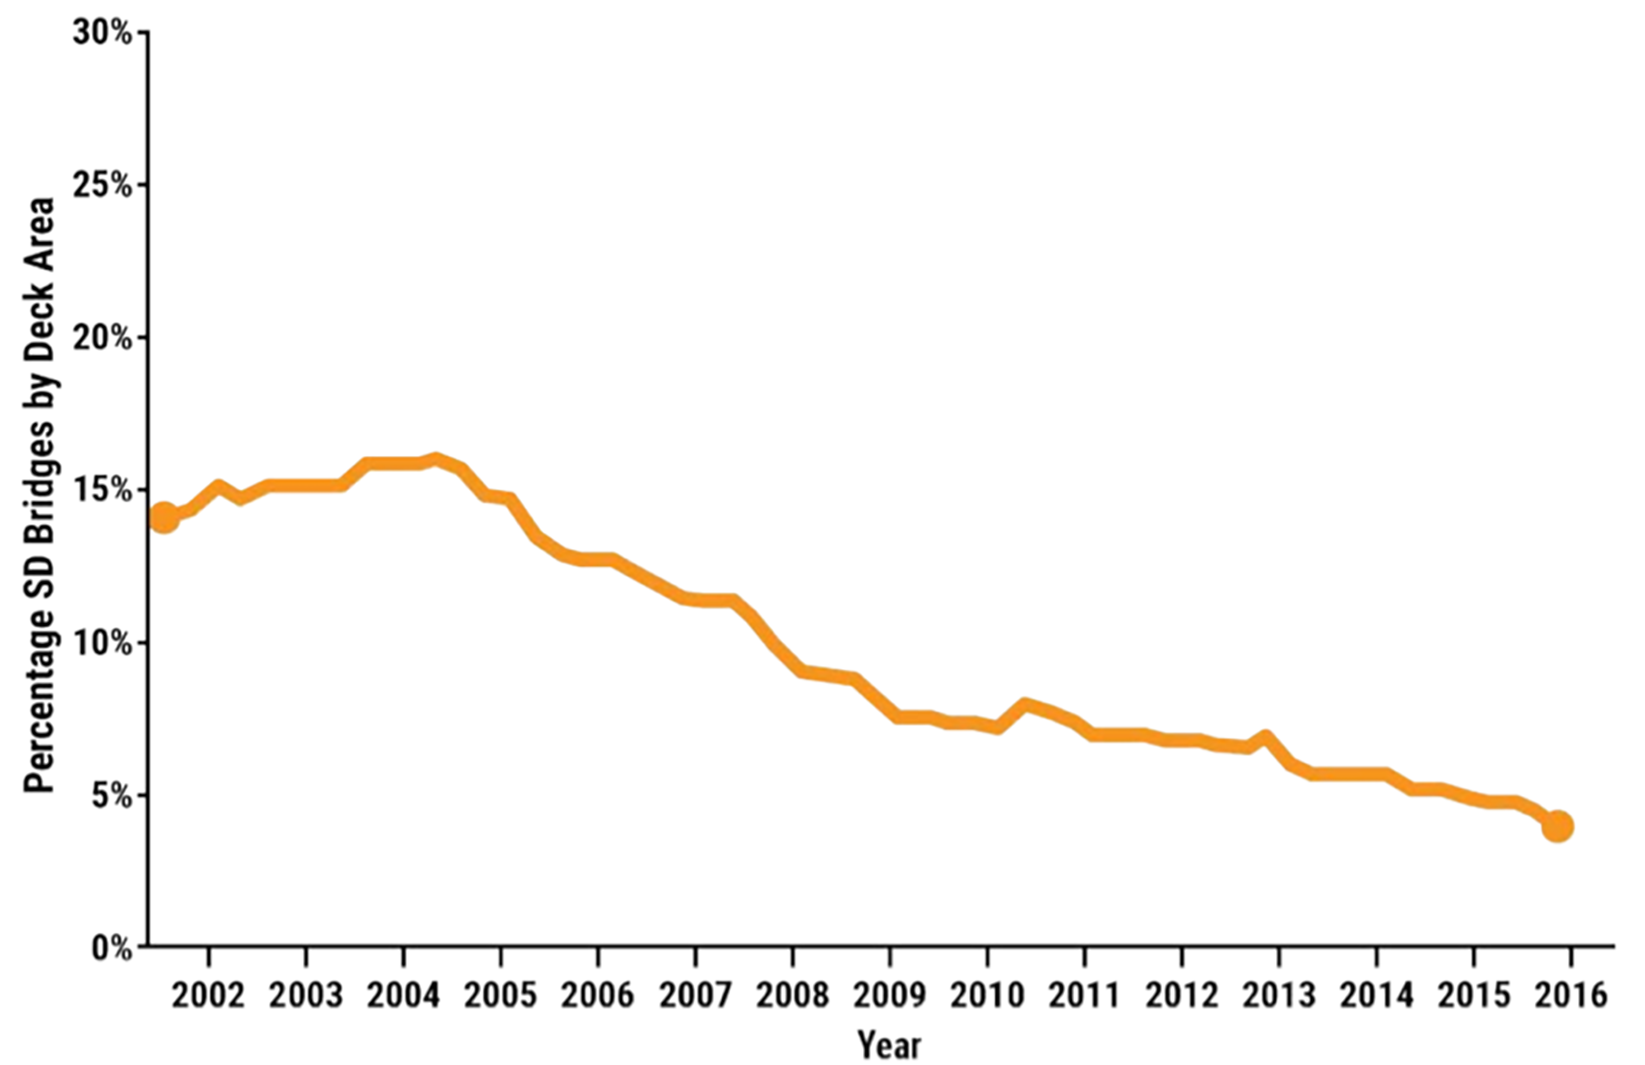
Source: New Mexico DOT Transportation Asset Management Plan. 2018.
South Dakota DOT
To determine the effectiveness of road investments, the South Dakota DOT uses historical trends and projects conditions for each road category to show whether targeted conditions can be achieved with planned investment scenarios. The figure to the right illustrates the type of graph developed for the Interstate network. As shown, the graph presents both historical and projected conditions based on a Surface Condition Index (SCI) that ranges from 0 to 5, with 5 representing a distress free pavement. Overlaid on the graph is the acceptable condition range, which in this case spans an SCI between 3.8 and 4.2. The graph shows that Interstate conditions gradually improved over time. Although it projects average future conditions to drop, they are expected to continue to fall into the acceptable condition range. The results of the analysis provide the agency with confidence that the planned investments will achieve the desired condition levels over the analysis period. In addition, the projections are updated annually to provide a picture of changing financial trends and funding availability. This allows the DOT to react to any downturn in the projections.
Past and Future Pavement Conditions and Goals
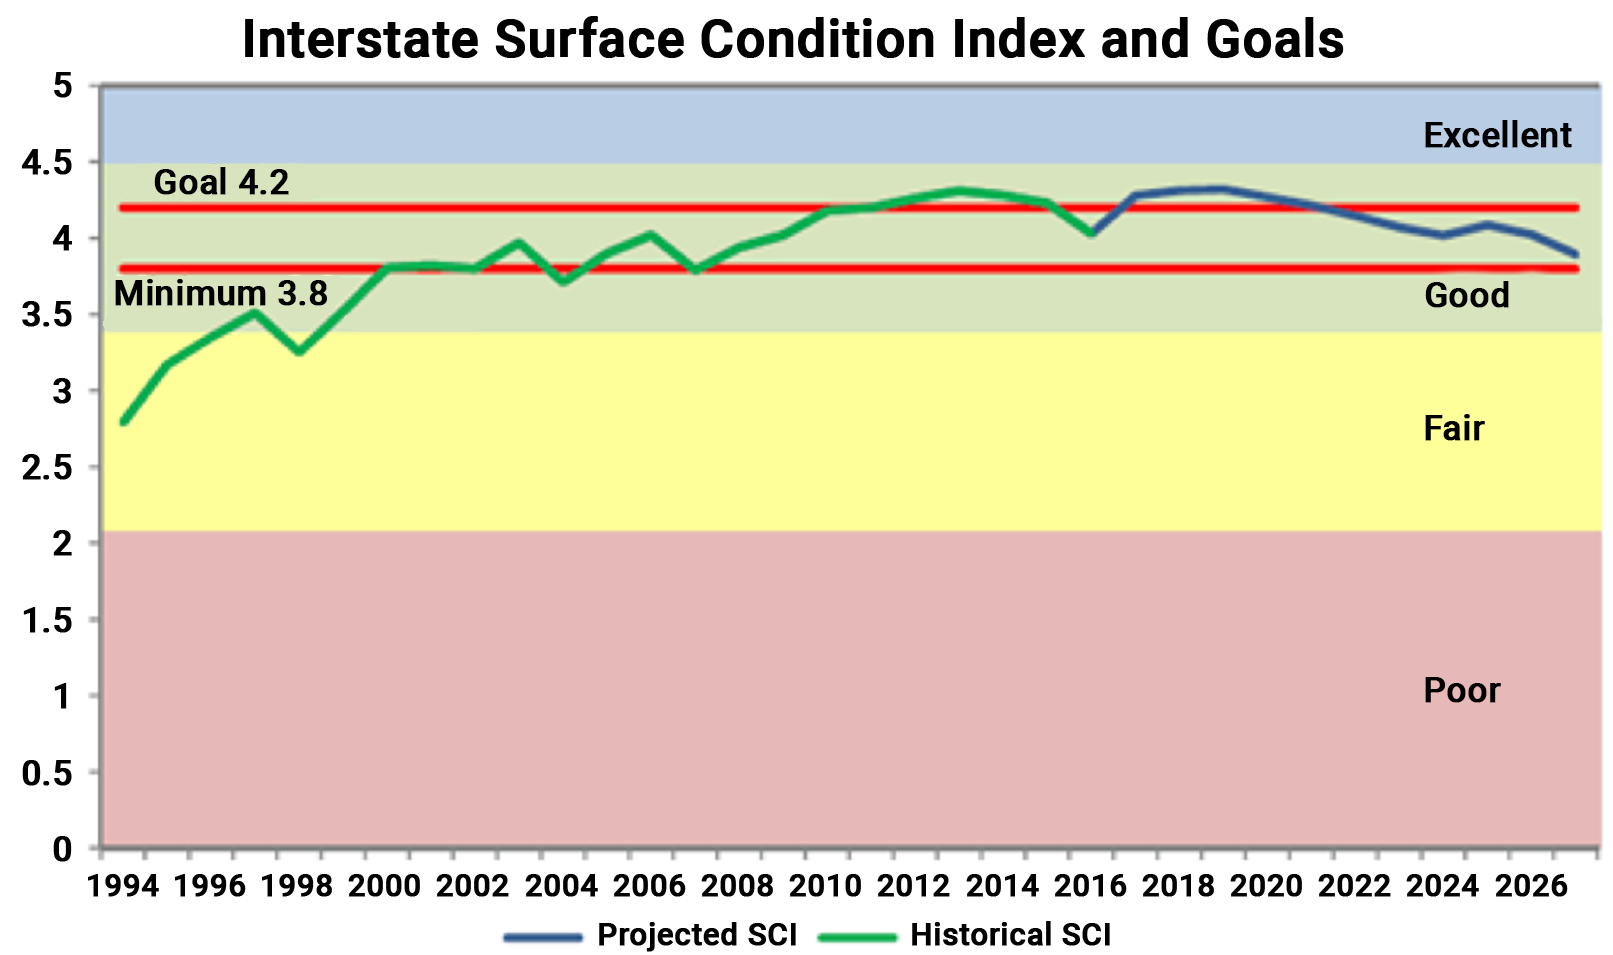
Source: South Dakota DOT Transportation Asset Management Plan. 2019. https://dot.sd.gov/media/documents/SDDOT2019TAMPFHWASubmittalrevised8-28-2019.pdf
Monitoring Asset Work and Costs
As discussed previously in Chapter 2, in order to reliably assess current and future work needs over an asset’s life cycle, it is important to ensure completed maintenance and capital work activities are tracked and incorporated into the asset management programs. This section establishes the importance of tracking work history information, presents approaches to track the information and illustrates how work history information can be used to update and improve performance predictions.
6.4.1
Importance of Tracking Work Activities and Treatment Costs
This section describes the factors that should be considered for keeping
a management system current.
Why It Is Important to Track Work Activities and Treatment Costs
Asset management systems, such as pavement and bridge management tools, rely on the availability of complete, up-to-date inventory information to serve as the basis for all system recommendations. At a minimum, the most recent work activity and completion date are necessary for establishing an asset’s age or the length of time since work was last performed. These factors are key to setting a maintenance service interval or predicting the need for future work. Treatment cost information is used to estimate the cost of recommended work activities, so realistic numbers are important for planning and budgeting.
Work Activities
The level of detail required to track work histories is largely dependent on the sophistication and maturity of the asset management program. It is important to have access to information indicating when the asset was installed or constructed, or when the most recent major work activities were performed. Additional information about maintenance activities performed to preserve or improve the asset is beneficial if it can be provided efficiently and incorporated into decisions about managing an asset over its life cycle.
An agency should incorporate completed work activities into a management system at least annually, at the end of each construction season. At a minimum, the asset management database should be updated to reflect any changes to the asset properties, such as a change from a concrete to an asphalt pavement, and the date when the change was made.
Treatment Costs
Including the cost of maintenance and rehabilitation activities in a computerized maintenance system provides a historical record of how treatment costs have changed over time. The information from the management system, as well as bid documents, can be used to establish unit costs for each type of work activity possibly recommended by the system. Unit prices for each work activity included in the system are needed.
For many transportation projects, improving the condition of the asset is only one part of the total cost of a project. There are many other costs to incorporate into the unit price when estimating the cost of a treatment recommendation, including the cost of pavement markings, guardrails and signs on a pavement project. If these costs are ignored, the cost of a project will be underestimated, and an agency may program more work than can be constructed over a given timeframe. Some agencies inflate treatment costs by a factor of 30 to 40 percent to ensure the costs associated with project design and the improvement of ancillary assets are considered in the unit cost for a given treatment. Using this approach, $0.30 to $0.40 is added to every dollar associated with the cost of the work itself. The inflated cost (e.g., $1.40) is stored in the management system as the unit cost for estimating treatment costs.
Different unit costs may also be established to reflect different costs in urban and rural areas, or in different geographic regions of a state. These differences improve the accuracy of asset budgeting activities by reflecting the realities agencies face due to work activities in highly congested areas, differences in the availability of contractors and the scarcity of materials in certain areas.
In addition to being used to estimate budget needs, treatment cost information serves many other purposes. For instance, the cost of a proposed project and its expected life can be used to determine a Return on Investment to help ensure that the most cost-effective projects are being selected. The information can also be used to compare the effectiveness of one treatment over another, or one life cycle strategy over another. Cost information has also been used to demonstrate the benefits to using proactive maintenance across a transportation network rather than reactive maintenance.
Montana, Tennessee, and Utah DOTs
Several state DOTs are employing the use of technology to track maintenance work activities as noted below.
When new assets are installed as part of a construction project for the Montana DOT, Construction personnel are required to provide Maintenance with the information needed for updating the asset inventory. Maintenance verifies the information provided by Construction before inputting it into the system.
The Tennessee DOT uses an automated data collection van to establish its asset inventory for approximately 20 assets. The inventory is entered into a maintenance management system at a summary level for each county and a “ghosting” technique is used to identify differences in the inventory from one year to the next year.
The Utah DOT extracts is asset inventory every two to three years from the LiDAR collected as part of the agency’s annual pavement condition surveys; however, the DOT is moving towards a continuous inventory updating process that would be the responsibility of Maintenance supervisors.
6.4.2
Establishing Business Processes to Support Work History and Cost Tracking
To ensure that work history and treatment cost information is kept current, business processes should be established to maintain the data over time. This section stresses the importance of building business processes to update the data regularly.
Assign Responsibility
One of the first steps in establishing business processes to support the maintenance of work history and cost information is assigning responsibility to the appropriate person for managing the information. The individual assigned responsibility for updating work history and cost data in the management system is not always the individual responsible for providing the data. For example, some agencies assign responsibility for updating completed work history and treatment cost information to the maintenance or construction division, since they are typically involved in closing out a project. Regardless of who is assigned responsibility for the task, a clear line of accountability should be established as part of the business process.
Establish Processes to Update Work Activities
As discussed in Chapter 7, technology is improving agencies’ ability to track completed work activities, so the information is available for use in an asset management system. The access to handheld data entry devices with map interfaces linked to a centralized database helps ensure all users of the information have immediate access to current and consistent information. Business processes reliant on field personnel to remember to provide information to another data user are generally not sustainable.
To help establish a reliable approach for keeping asset data current, an agency may consider developing a data and process flow map illustrating the flow and use of data across the agency. This type of document helps an agency better understand where the data comes from, where it is stored, who uses the information and what levels of access various users need. A data and process flow map may become part of an agency’s data governance documentation in order to protect the integrity of asset data.
Build Buy-In To Support the Business Processes
Key to the success of any business process is establishing buy-in among the individuals responsible for each required step. This involves familiarizing the individuals with their responsibilities, providing tools and guidance for completing the activities efficiently and effectively and demonstrating how the information is used to support agency decisions.
Florida DOT
To ensure that the asset inventory remains current, the Florida DOT assigns district personnel responsibility for maintaining asset inventories and establishes guidance that no data in the inventory can be more than five years old. For new construction projects, it is required that the inventory be updated within 90 days of completion. The Florida DOT district offices develop a Quality Control (QC) plan and perform a QC check on the data at least once a year. The Florida DOT Central Office develops a Quality Assurance Review (QAR) plan and performs a QAR on the district’s QC process and spot checks the data in the field. As a result of these requirements, the Florida DOT has a high degree of confidence in the numbers used for budgeting activities.
6.4.3
Using Work History Information to Improve Models
The availability of current work history and performance data allows agencies to develop and improve models used in a management system to predict future conditions and determine treatment effectiveness. This section describes and illustrates the use of this data to improve existing models.
Developing and Improving Asset Deterioration Models
An important function of an asset management system is the ability to predict asset deterioration rates so changes in condition over time can be modeled for use in planning and programming activities. In the absence of data, models can be developed based on expert judgment, but as historical performance trends are established based on actual data, the expert models should be replaced by or calibrated against the real data.
The AASHTO Transportation Asset Management Guide: A Focus on Implementation (2011) introduced the following thought process to help an agency evaluate their deterioration models and determine whether improved data is needed to enhance future forecasts:
- If there is disagreement with the timing for recommending a treatment, what is the difference? Does a difference of one to two years make a substantial difference to the program? This type of difference is typically the result of the program optimization models.
- If there is disagreement with the treatment, are the differences substantial, such as deck repairs versus bridge replacement? These differences are often the result of treatment rules but may indicate that deterioration rates are not correct. The deterioration model parameters may need to change (e.g., change traffic considerations or geographic location) or there may have been some work performed that the model is not aware of.
- If the differences are irreconcilable, the agency may decide to investigate the model setup and analysis further or may conduct research to see how other agencies have resolved similar issues.
Determining Treatment Effectiveness
The availability of work history and performance data also makes it possible to determine the effectiveness of different types of treatments over time. By adding cost information to an effectiveness analysis, an agency can determine the long-term cost-effectiveness of different treatment strategies.
North Carolina DOT
The North Carolina DOT conducted an analysis to determine the effectiveness of an open-graded friction course and a surface constructed with a FC-2 (friction course) gradation. Data from the pavement management database was used, including inventory data, construction information and pavement condition ratings. The performance data were plotted against the survey year for each pavement section where one of the two types of surface friction courses was applied. The results showed the performance of the open-graded friction course dropped at year 10, while the FC-2 graded surface dropped in performance at year 8. The study also found that all FC-2 sections had received another treatment by year 11. The results from the analysis were used to increase the use of open-graded friction courses across the state.
South Dakota DOT
In 2011, the South Dakota DOT initiated a project to revise the pavement deterioration models developed in 1997 using 17 years of historical pavement condition data. The tool for developing the models included features allowing all the condition-versus-age data points for each pavement meeting the family description (based on surface type and pavement structure) to be plotted on a graph, facilitating a comparison of the historical model and the recommended model based on the updated pavement condition information. In this example, the blue line (labeled as the user-defined model) represents the model being used in the pavement management system for predicting faulting on a thick, short-jointed doweled concrete pavement and the gold line (labeled as the regression equation). The regression analysis on the historical data, represented by the red data points, indicates faulting is occurring at a much more accelerated rate than was previously predicted. As a result, recommendations for addressing faulting were likely lagging the actual need observed in the field.
Illustration Showing How Historical Data can be Used to Modify a Deterioration Model
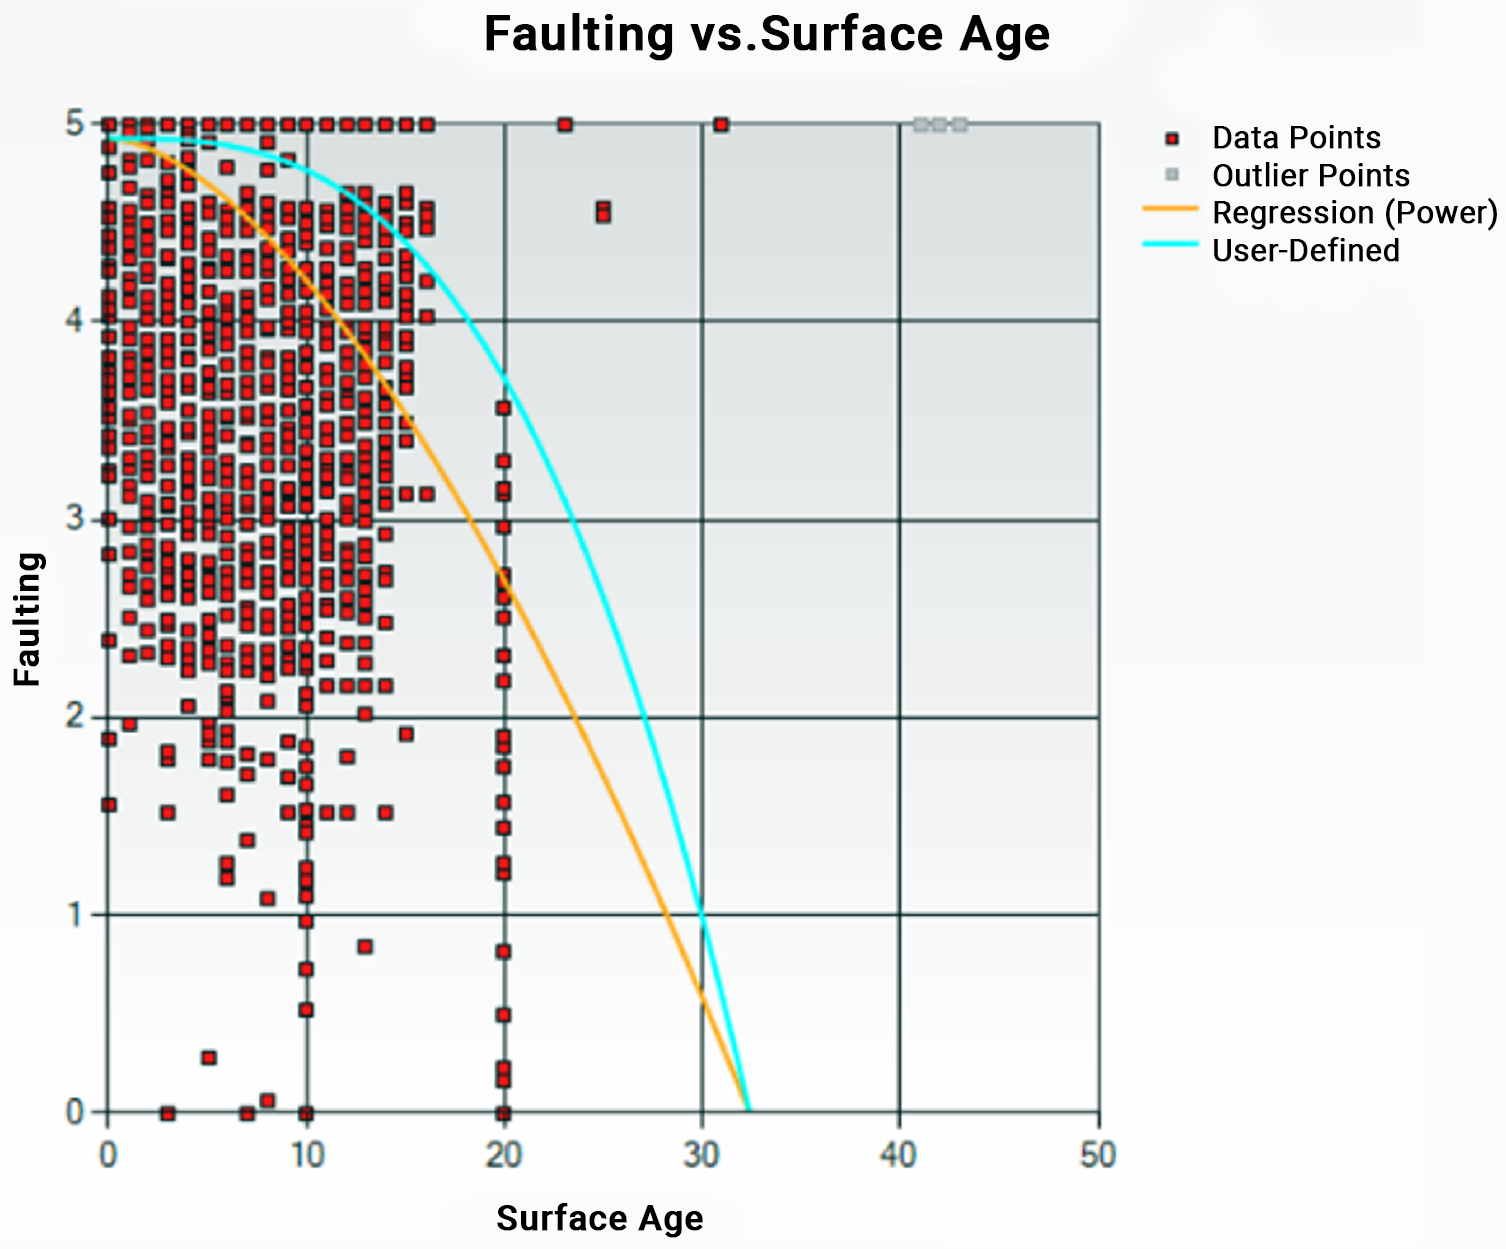
Source: South Dakota DOT. 2012. Technical Memo/Software Documentation
New Zealand Transport Agency
The Auckland Harbour Bridge corrosion protective coating system has been undergoing regular maintenance since the bridge opening in 1959. Historic practice was to spot abrasive blast corroded surfaces followed by spot painting and applying a full overcoat. While this process was effective in maintaining the protective coating, it also resulted in significant amount of contaminates being discharged into the Waitematā Harbour despite of the precautions being taken.
In an effort to reduce the discharge, various options have been considered taking into account the protective coating performance and longevity, with the aim to achieve the lowest practicable environmental discharge and whole of life costs.
One option involved collecting the abrasive blasting removal of the coating via the use of full scale containment to capture contaminants. However, it was found that this option would require strengthening of the bridge to safely carry the containment under wind loading at a cost of NZ$65M over a 10-year period.
As such, by undertaking a comprehensive review of the coating maintenance, a 40 years Coatings Maintenance Plan was developed. The identified lowest whole of life solution involved:
- On the land spans, use of full containment (where it could be supported from the ground), allowing for the full removal of the coating system via abrasive blasting, and its full reinstatement. These spans are to be left as long as possible before reinstating the protective coating, while ensuring minimal, if any section loss, to the steel superstructure.
- Spot repair and overcoating of other spans to maintain the existing coating for as long as practicably possible. A more proactive intervention approach is also adopted while using abseil techniques to minimise access costs.
- An outcomes based approach for consenting purposes that involved the establishment of low level discharge limits for contaminants deemed to be environmentally safe. This enables small areas of abrasive blasting without full containment for spans other than above land.
Thus, allowing for the continued corrosion protection of the bridge 125,000m2 external surface areas in a marine environment, while providing a cost effective and environmentally responsible solution.
Source: https://www.icevirtuallibrary.com/doi/abs/10.1680/jbren.18.00051
Toronto Transit Commission
The Toronto Transit Commission initiated a review to determine optimal bus life for their fleet as well as assess the potential for hybrid propulsion technology. Through specialized modelling methods, a data-driven approach was used to assess the total cost of ownership (TCO) for their fleet vehicles. This review analyzed historical asset work order records along with other capital and operating expenses to help identify the optimal asset life cycle. The four key areas analyzed were:
- Procurement/Installation: Asset Design Specifications & Procurement Cost
- Operations & Maintenance: Labor, Parts, Fuel (if applicable), Consumable Items and Outsourced Work
- Overhaul/Rehabilitation: Major Asset Refurbishment/Component Replacement Cost (ex. Transit Bus Transmission Rebuild or Facility Rehabilitation)
- Disposition: Salvage Value (End-of-Life)
The model provided insights on when the optimal time to dispose of a fleet vehicle to minimize overall fleet cost, the comparative TCO of different vehicle types, and the relative effect and up-time benefit gained for different operations and maintenance activities or rehab treatments, by engine or other component types used in the fleet. They advanced their understanding of treatment effectiveness and allowed them to make more informed decisions about fleet renewal.
Washington State DOT
The Washington State DOT conducted a pavement life cycle analysis using performance and cost data that demonstrated the cost-effectiveness of its pavement preservation projects. Based on the results that are documented in their Transportation Asset Management Plan (https://www.wsdot.wa.gov/sites/default/files/filefield_paths/WSDOT_TAMP_2019_Web.pdf), the DOT instituted a “one touch policy” requiring all capital projects to have had at least one pavement maintenance treatment by Maintenance or contracted work forces before it can be programmed for a pavement preservation project. This has enabled the DOT to defer capital improvements on pavements by two to three years, or in instances of multiple touches, by four to six years at a very low cost. In 2018, the agency received an additional $6 million to test a similar program on bridges. In addition to being a cost-effective use of available funds, the programs have helped build buy-in among maintenance personnel by demonstrating the importance of the data they collect.
Monitoring Risks and TAM Processes
Chapter 2 introduced a process for identifying, analyzing, evaluating and managing risks, including a step for monitoring and reviewing risks on a regular basis. Since risks are constantly changing, it is important to establish processes to track changes in risks over time and monitor actions taken to manage risks. The same is true of other business processes that support TAM; they should be monitored regularly to ensure that analysis results continue to support investment decisions and that any gaps between desired and actual levels of maturity are addressed. This section introduces tools used to track and manage risks, highlights methods of monitoring and evaluating TAM processes, suggests a structure for assigning responsibility for implementation of new processes, and illustrates successful practices used in transportation agencies.
6.5.1
Monitoring and Managing Risks
Risk registers, risk reports, and risk mitigation plans are commonly used tools to track and manage risks. This section describes and illustrates each of these tools.
Risk Register
A risk register is one of the most common tools for tracking and managing risks within an agency, since it provides a framework for capturing critical information about each risk, its importance to the agency, mitigation plans and tracking and managing responsibilities. A risk register is typically generated as a spreadsheet, though other formats are available. An example of a comprehensive risk register, which includes assignments for risk mitigation strategies, is presented in Figure 6.4. Over time, columns may be added to indicate when the risk information was last updated, what further action is required and whether adequate progress is being made towards the mitigation strategy.
A risk register should be reviewed at least quarterly to evaluate whether the risk register or the risk management plan for any of the performance areas needs to be updated. Periodic changes to the risk profile may be obtained through executive staff meetings meant to evaluate progress regularly, or ongoing reports tracking risk mitigation efforts and results. Annually, the agency may determine whether any strategic-level risks should be adjusted based on evaluation of the agency’s performance and the risk reports provided by the risk owners.
Figure 6.4 Excerpt from a Risk Register Showing Responsibility for Risk Mitigation Activities
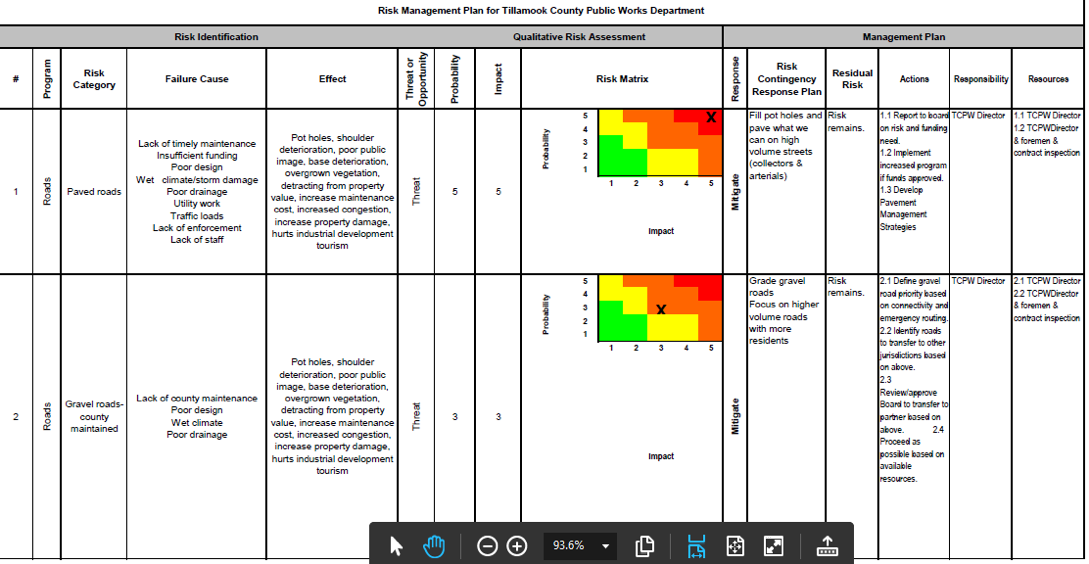
Source: Tillamook County Public Works Road Asset Management Plan. 2009.
Risk Reports
Risk reports, which reflect excerpts from the risk register, may be developed by risk owners to communicate ongoing activities and manage risks at any level of the organization. The type of risk report shown in Figure 6.5 conveys what steps are being taken to address project delivery risks.
TAM Webinar #50 - Improving Your Next TAMP Miniseries: Improving Risk Management and Resiliency
Risk Mitigation Plans
Some agencies see benefit in developing risk mitigation plans for their assets to ensure compliance with regulatory programs and help embed risk into all agency business activities. For example, a risk management plan may be developed when a bridge’s risk of failure reaches a certain threshold. These plans identify specific risks and mitigation strategies to undertake in order to reduce the likelihood or impact associated with the risk.
Figure 6.5 Sample Risk Report
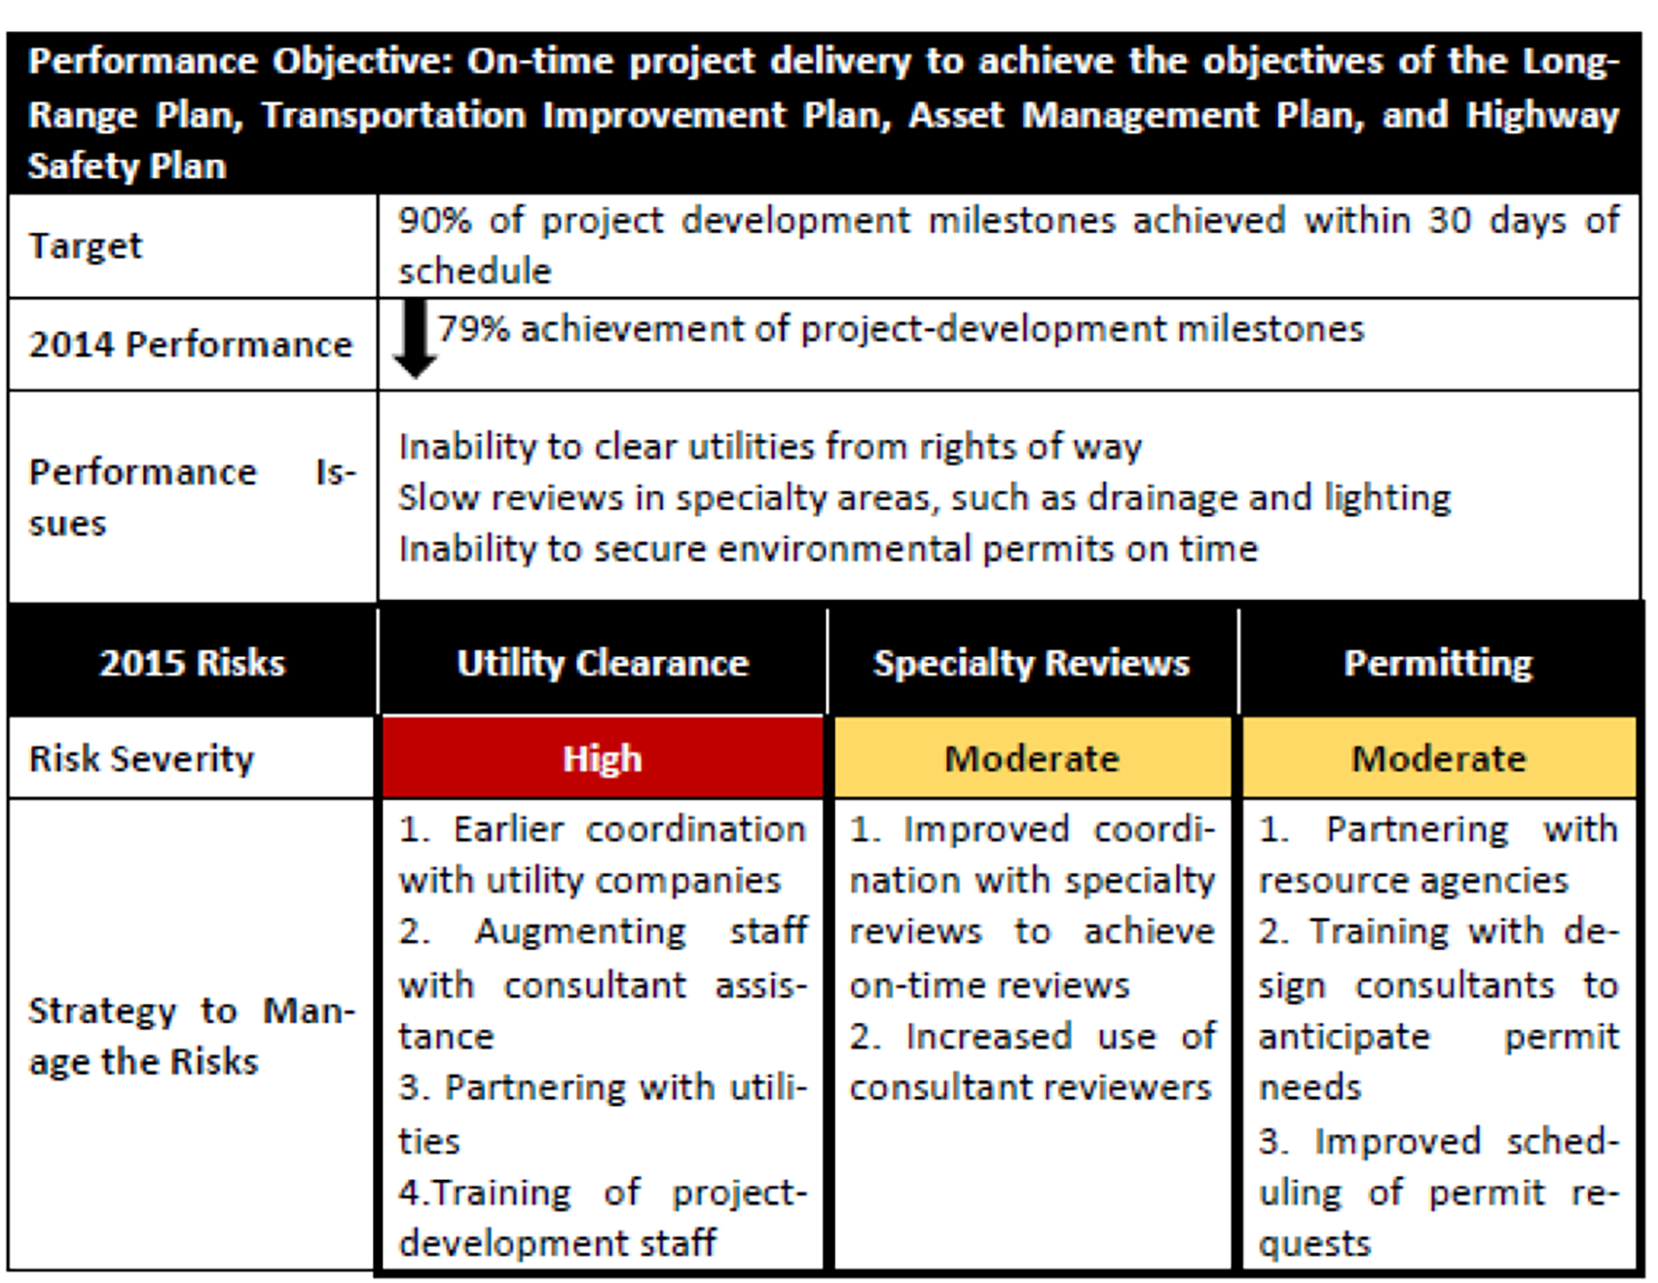
Source: AASHTO. 2016. Managing Risk Across the Enterprise: A Guide for State DOTs.
Washington State DOT
The Washington State DOT recognized the potential safety risk to highway travelers and the adverse impact on regional commerce associated with unstable slope failure. To become more proactive in managing this risk, WSDOT developed the Unstable Slope Management System (USMS) that provides a method for evaluating known unstable slopes and using the information to prioritize slopes for funding of proactive stabilization efforts. The mitigation objective of the unstable slope management program is to sustain a desired state of good repair and low risk over the life span (> 20 years) of known unstable slopes and constructed geotechnical assets at the lowest practicable cost.
Bay Area Rapid Transit Authority (BART)
BART developed a Local Hazard Mitigation Plan in 2017 to reduce or eliminate long-term risks to human life and property related to hazards such as earthquakes, tsunamis, landslides, flood, sea level rise, wildfire, and drought. The analysis focused primarily on high-priority fixed assets such as passenger stations, substations, switching stations, train control rooms, shops/yards, ventilation structures, and emergency exits. These assets were prioritized based on criticality in terms of the impact of an asset failure on reliable and safe service capabilities. The Local Hazard Mitigation Plan details the potential impacts associated with each hazard type and presents prioritized mitigation actions that were determined by votes from the participating members of a Task Force Committee called the Emergency Preparedness Task Force Committee (EPTFC) that is made up of senior managers from all BART departments. The plan is updated at least once every five years. An example of the type of mitigation strategies that were developed are presented in the Figure below. The Plan has helped identify agency priorities that are being addressed and has fostered collaboration among different Departments to reduce potential hazards.
Lessons Learned from Implementing Risk Management
Following the 2016 publication of the AASHTO Guide for Enterprise Risk Management, TRB initiated an NCHRP project to pilot the framework introduced in the Guide. Pilot case studies were conducted by the Tennessee, Utah, and Washington State DOTs; a peer exchange was conducted; and a national community of practice (COP) was formed to provide support for the implementation of risk management and to advocate for further research in this area. Several risk management tools were developed through the research that are documented in the NCRHP report.
A variety of different types of risks were considered during the pilot studies. The Tennessee DOT focused primarily on three types of risks:
- Those associated with inconsistencies in quick-clearance processes associated with crashes and other highway incidents.
- Those associated with roadway plans that could affect the quality, cost, and schedule for delivering projects.
- Those caused when incomplete project plans are submitted for bids.
Several tools were developed to better manage these risks, including checklists, plan submittal delay forms, and a Memorandum of Understanding with the Tennessee Department of Safety to clarify roles and responsibilities for quick clearances.
The Utah DOT pilot addressed four initiatives:
- Reduce risks to Utah DOT objectives by improving hiring practices and retention.
- Reduce risks of poor performance by enhancing the employee evaluating process and strengthening leadership skills.
- Reduce risks of poor performance through a knowledge management process.
- Develop a repeatable and scalable process to assess corridor risks caused by natural disasters.
The study improved leadership access to information for hiring and leading employees, provided a training toolkit for supervisors, and resulted in a process to integrate and incorporate risk and resilience assessments into existing decision-making processes.
Washington State DOT used the pilot to support the full integration of its enterprise risk management practices. The agency also elected to address cultural sensitivity and inclusion in workforce development activities. These efforts resulted in new workforce development and outreach materials.
The pilot studies helped expose the participating agencies to strategies for managing risk. They demonstrated the importance of promoting enterprise risk management concepts among agency leaders to mainstream the concepts into common agency practices. This increases the likelihood that enterprise risk management practices endure beyond changes in agency leadership.
The participants also recognized important links between risk management and both performance and asset management programs. Several agencies recognized the importance of risk management to improving the resilience of a highway network to unexpected events such as flooding or erosion. The pilot studies demonstrated that the ability to use risks to inform planning and investment decisions can be beneficial.
6.5.2
Monitoring TAM Processes and Improvements
As discussed throughout this Guide, TAM is an on-going process that needs to be monitored regularly to ensure that it continues to support an agency’s business decisions. This section presents tools and methodologies used to accomplish this. It also builds on the application of some of the tools introduced in section 2.5.1, Assessing Current Practice.
Gap Assessment
A gap assessment is used to identify differences, or gaps, between an agency’s practices with those suggested as part of an established asset management framework. The results of a gap assessment can be used to identify changes in business processes that are needed or can serve as the basis for developing priorities as part of an asset management implementation plan. The gap analysis tool available through the AASHTO TAM Portal is an example of a tool that can be used by an agency to assess practices so they can be compared to desired, or more established, practices. A summary of the gap analysis tool and other frameworks for assessing current practice was presented in Figure 2.6. An example of a chart showing targeted and current ratings in eight assessment areas over a 2-year period is presented in Figure 6.6. While the agency’s targeted, or desired, scores remained consistently at a rating of 5 over both years, the graph is helpful for determining what assessment areas have improved over the 2-year period and which have not.
Figure 6.6 Example Comparing Assessment Area Scores from Two Different Rating Periods
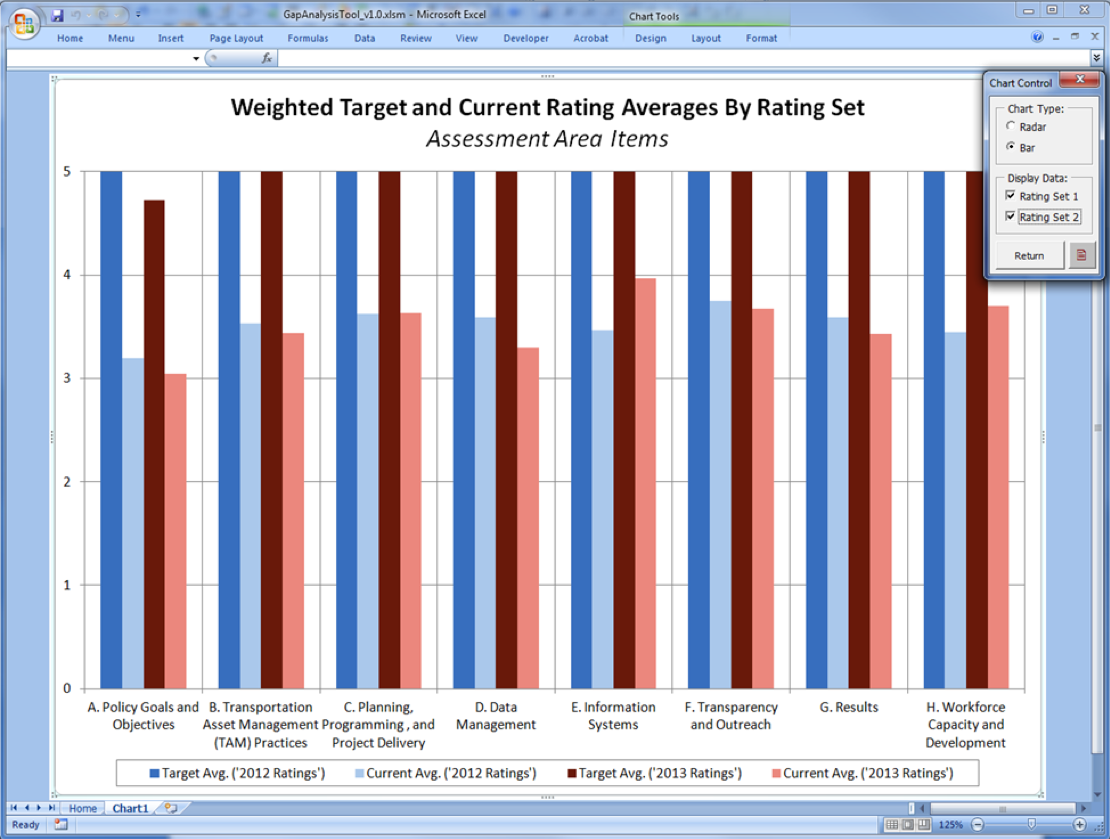
Source: AASHTO. 2015. Transportation Asset Management Gap Analysis Tool User Guide
TAM Webinar #29 - Process Improvements
Lean Six Sigma
A lean six sigma framework uses statistical analyses as part of a continuous improvement approach to evaluate the cause of defects and methodically make improvements to processes to eliminate them. Six sigma is widely used in manufacturing sectors, but can also be applied to many TAM functions. For instance, a six sigma analysis would be useful in analyzing the root cause of defects associated with a poorly-performing asset. Combining a six sigma approach with a Lean framework, which focuses on reducing waste, can help agencies develop more efficient and sustainable processes.
New Brunswick DTI
The New Brunswick Department of Transportation and Infrastructure (NB DTI) implemented Lean Six Sigma to better understand and document existing practices and identify where improvements could be implemented for savings or service improvement. The Lean Six Sigma methodology helps to improve performance through a collaborative process that systematically removes waste and reduces variation while improving customer satisfaction. For NBDTI, the application of this methodology has resulted in increased efficiency, cost savings, refined procurement methods, improvements to delivery of operational programs and services, and has supported the application of asset management decision-making to pavements, bridges, culverts, facilities and other transportation infrastructure.
ISO 33000 Process Assessment
The International Organization for Standardization (ISO) has introduced a variety of processes to support Asset Management. ISO 33000 is a standard for Process Assessment, providing a structured approach to help agencies better understand their processes, evaluate the suitability of their existing practices, and to determine the suitability of another organization’s processes as a way of improving practices.
TAM Webinar #63 - Consistency Reporting
The Balanced Scorecard
The Balanced Scorecard approach was initially developed to enable organizations to make complex tradeoff decisions that balanced different types of performance criteria. For example, the framework could be used to help determine the tradeoff between improving the level of service provided in a corridor with improving environmental sustainability on a statewide basis. The balanced scorecard analysis takes a holistic and balanced approach to these types of issues, by simultaneously evaluating competing and dissimilar needs (such as Customer Satisfaction, Sustainability, and Safety). The advantage to the balance scorecard approach is the fact that multiple measures are considered, rather than a single set of measures that might disregard an important factor in the decision. The results produce a rational set of investment decisions that considers all of the factors that the agency views as most important to the final selection.
6.5.3
Managing Implementation Responsibilities and Processes
Monitoring the implementation of new business processes benefits from a clear definition of roles and responsibilities. This section illustrates approaches that agencies use to assign responsibility for implementation activities so that progress can be tracked.
Assigning Responsibility for Managing Risks and Implementation Activities
A key step in managing risks and other implementation activities is establishing a set of roles and responsibilities for each of the tasks at hand. The risk management process introduced in Chapter 2 includes a step for monitoring risks on a regular basis through a risk register or some other format.
Risks
When assigning responsibilities for managing risks, different types of risks are normally assigned to different individuals or divisions within a transportation agency:
- Strategic risks – Impact the agency’s ability to achieve its goals and objectives. Ignoring risks at this level can cascade down to impact programs and projects at other levels of the agency. For this reason, strategic risks are generally assigned to members of agency leadership and may be addressed by incorporating risks into regular management meetings and key policy documents.
- Program risks – Impact an organization’s ability to administer a program in a coordinated way. Risks at this level are typically the responsibility of the program manager ensuring there are effective controls over risk and documenting risk activities.
- Project risks – In many agencies, a project risk management process is in place with responsibility for managing risks assigned to the project manager. At this level, primary responsibilities include managing risks associated with the project scope, schedule and quality.
- Activity risks – Associated with routine activities performed by the agency, such as snow and ice control, incident response and pavement management modeling. Risks at this level are typically managed and monitored by the activity leader.
An agency may elect to appoint a Chief Risk Officer or to create an Enterprise Risk Unit charged with coordinating the agency’s risk processes and training agency personnel on risk management. If such a unit is created, the Chief Risk Officer often reports directly to the agency’s chief executive officer or another high-ranking executive, symbolizing the importance of risk management to the agency. Agencies without a formal Risk Unit may rely on the Asset Management Coordinator to serve in this role. Examples showing how risk roles and responsibilities have been assigned are provided in Figures 6.8 and 6.9.
Process Improvements
The success of a TAM Improvement Plan that outlines steps the agency plans to take to enhance its asset management program will also benefit from a clear set of roles and responsibilities for:
- Implementing the suggested changes,
- Monitoring progress, and
- Repeating the assessment periodically.
Ownership for the implementation of the planned enhancements generally lies with the TAM Coordinator in an agency, with specific tasks assigned to one or more individuals with the specialized skills and capabilities that are needed.
A major function of the implementation leader is to ensure that all roles are understood and that the various assignments are being carried out as intended. This may require building buy-in among the team members, who are likely busy with other responsibilities. It is also important that the leader have the authority responsibility to hold individuals accountable for progress, even if they report to a different division within the agency.
Table 6.4 Risk Types and Owners
| Risk Levels | Owners | Types of Risks |
|---|---|---|
| Strategic Risks | CEO Senior Staff Board or Commission |
|
| Program Risks | Leaders of major programs, such as safety, pavement, bridge, maintenance, information technology, project delivery, human resources |
|
| Project Risks | Project Managers |
|
| Activity Risks | Activity Managers |
|
Source: Transportation Research Board. 2014. Managing Risk Across the Enterprise: A Guide for State DOTs.
The availability of adequate resources is also important to the successful implementation of an improvement plan. Establishing clear role descriptions that describe the required tasks to be completed and the requirements needed to implement the changes enables an agency to compare the availability of existing staff to the implementation requirements. In some instances, staff may be temporarily assigned responsibility for a particular activity, such as developing a TAMP, to address a specific need.
Table 6.5 Risk Management Roles and Responsibilities for the Highways Agency, England
| Project Manager |
|
| Project Team Member |
|
| Project Risk Manager |
|
| Risk Owner (Action Owner) |
|
Source: Washington State DOT. 2018. Project Risk Management Guide.
Using a RACI Matrix to Assign Roles and Responsibilities
A variety of tools can be used to track roles and responsibilities, including spreadsheets or various type of matrices. One form of responsibility assignment matrix is known as a RACI matrix. The term RACI is taken from the words:
- Responsible. Assigning responsibility for getting the work done or making a needed decision. This is typically the person who gets the work done.
- Accountable. Identifying the person who is responsible for making sure the work is done and is ultimately answerable for the activity or decision.
- Consulted. Recognizing that others will provide information needed to complete an activity.
- Informed. Keeping people aware of progress that is made.
A RACI matrix can be used for virtually any type of activity with a combination of tasks, milestones, and key decisions that will be carried out by several different individuals. It is a common technique used for managing different types of construction, implementation, and monitoring activities and is especially useful when responsibilities are divided across divisions or departments within an organization. For that reason, it is commonly used as part of an enterprise-wide risk management program to help ensure that risks are monitored regularly. An example of a RACI matrix showing responsibilities for adopting an enterprise risk management (ERM) policy is shown in figure 6.7.
Figure 6.7 Example RACI Chart
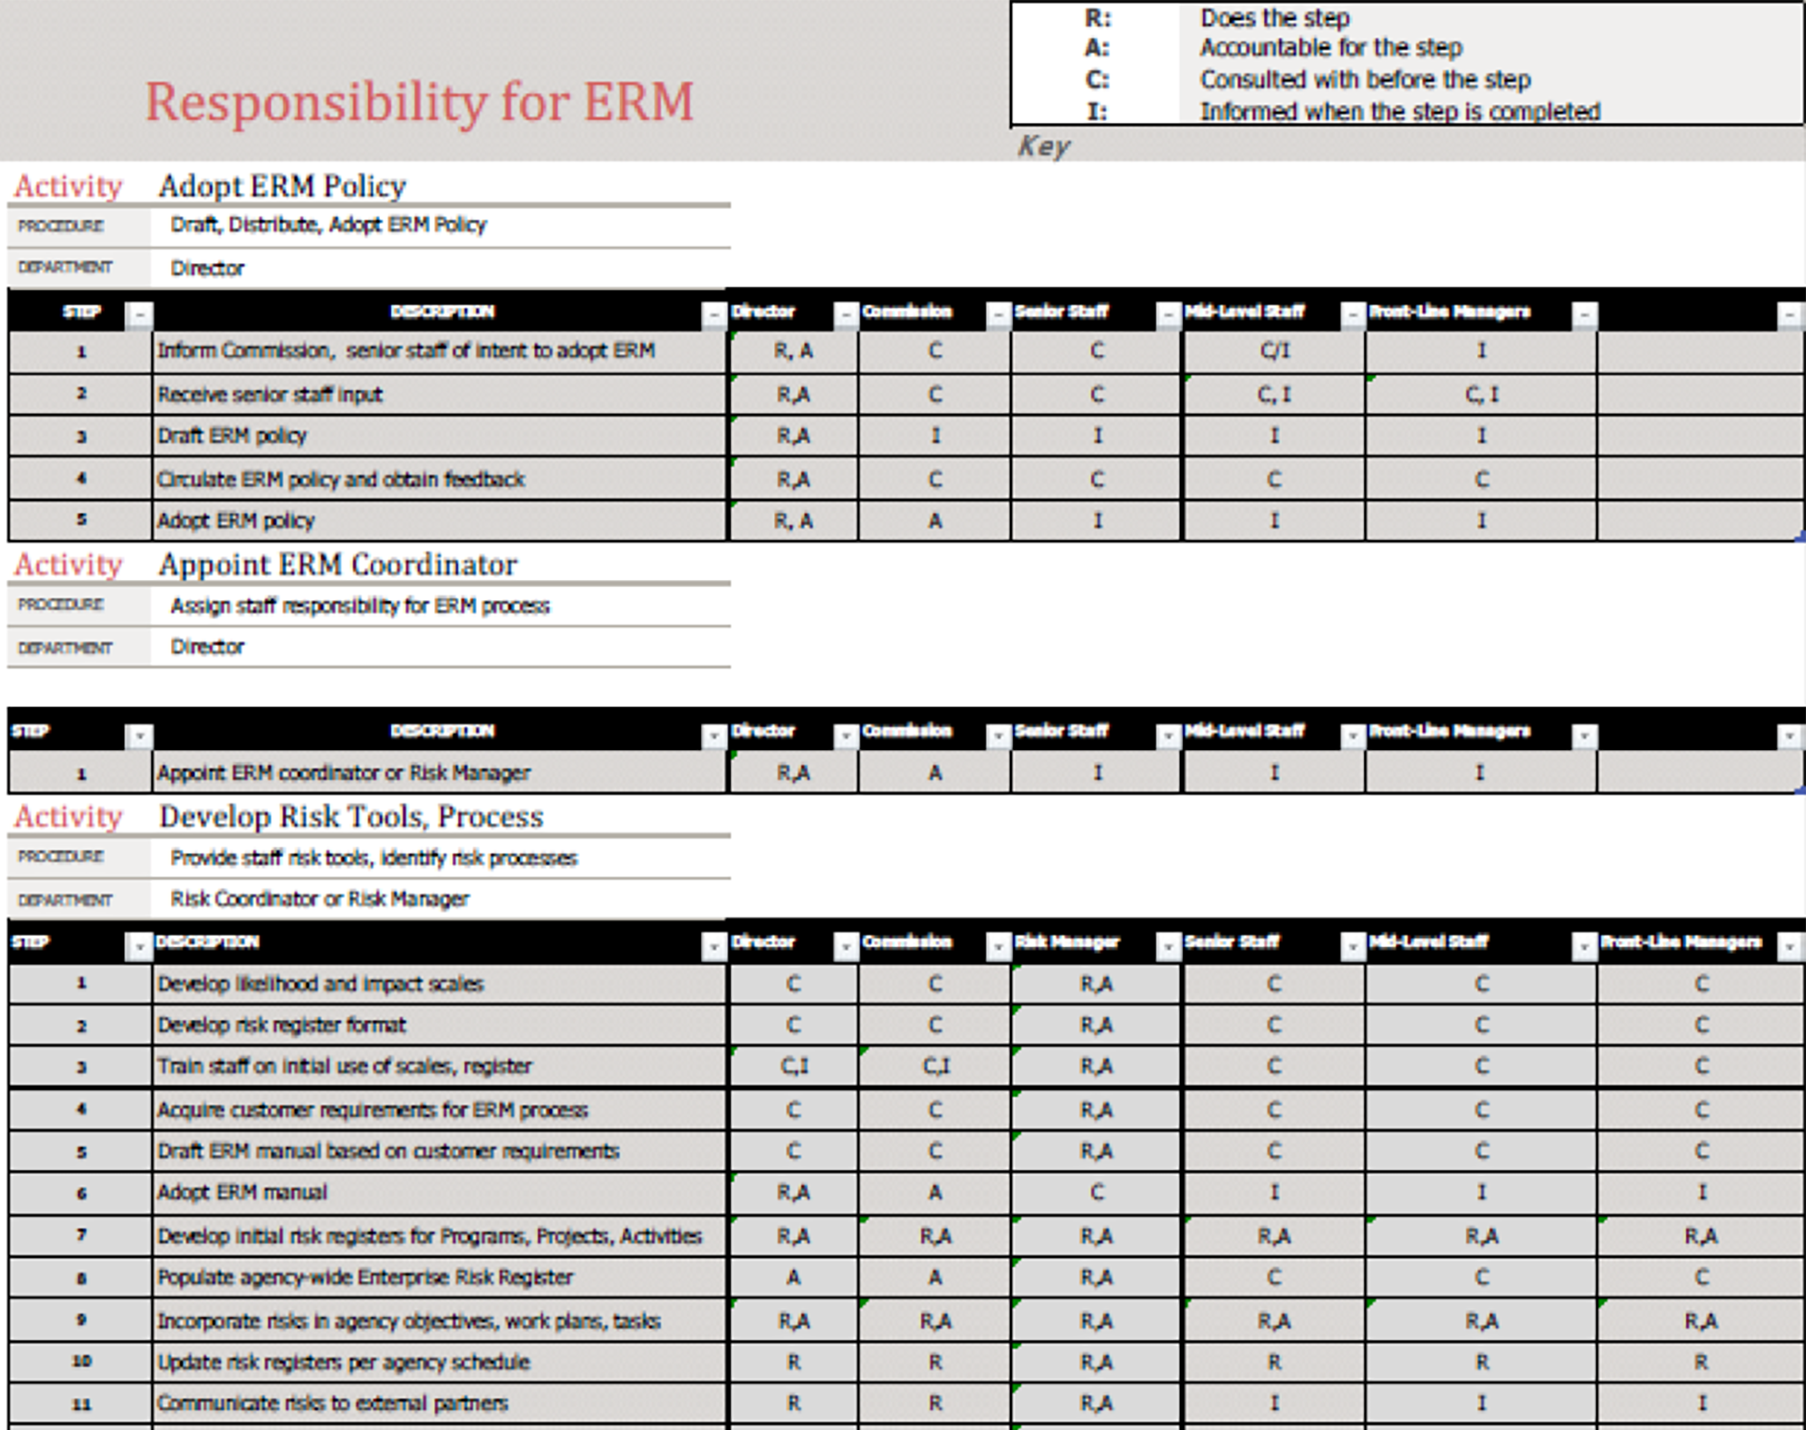
Source: AASHTO. 2016. Managing Risk Across the Enterprise: A Guide for State DOTs.
Seattle DOT
The City of Seattle has a Sidewalk Safety Repair Program to oversee the maintenance of the City’s many sidewalks and curbs to keep them safe and accessible. The Program includes a process for monitoring sidewalk conditions, investigating complaints of unsafe or inaccessible sidewalks, determining repair responsibility (e.g.., adjacent property owner, City, or other utility), using existing conditions to proactively mitigate conditions (beveling and asphalt shimming), and permanently repairing sidewalks that are the City’s responsibility. Repairs are leveraged with other capital projects as much as possible, so coordination with other Divisions is vital to the effectiveness of the program.
Because of the number of Divisions involved in managing sidewalks, the City assigned roles and responsibilities in a RACI matrix, that identifies those with Responsibility (R) or Accountability (A), those that need to be Consulted (C), and those that need to be Informed (I). The RACI matrix developed by the City includes one additional role beyond the four that are commonly included in the matrix. The City of Seattle added an “S” to represent a support role for personnel who might provide information to the process but are not necessarily responsible for completing the activity. The RACI matrix has served the City well by clarifying the responsibilities of each of the Divisions involved in some aspect of the Program so the program looks seamless to the public, as shown on the City’s website (https://www.seattle.gov/transportation/projects-and-programs/programs/maintenance-and-paving/sidewalk-repair-program).
Excerpt From a RACI Matrix Developed by the City of Seattle for Managing Roles and Responsibilities for its Sidewalk Repair Program
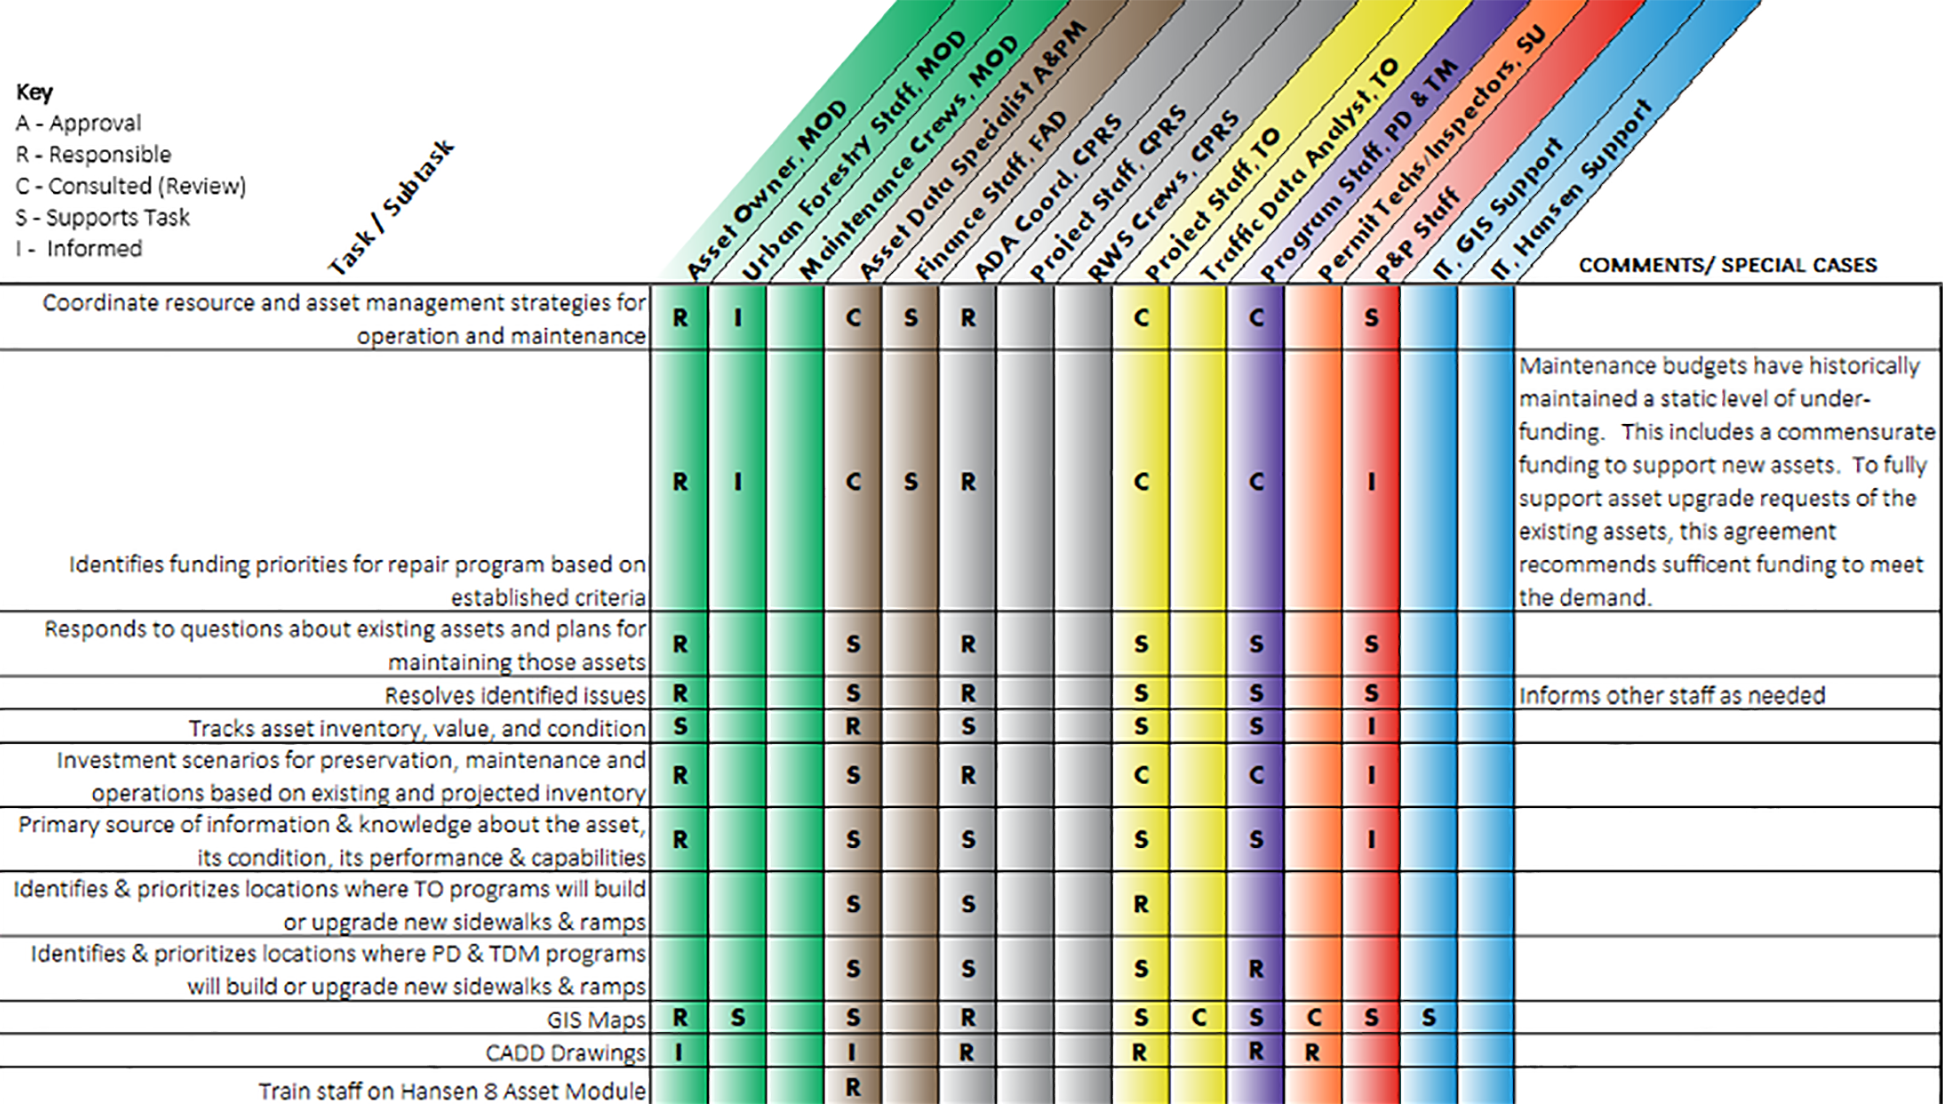
Source: City of Seattle. 2019.
Incorporating Maintenance Costs into a TAMP
As discussed in section 6.4 monitoring asset work and costs is essential to assessing progress towards TAM objectives and continually improving TAM analyses and forecasts. This section describes specific challenges and approaches to capturing costs related to the maintenance of highway infrastructure assets.
6.6.1
Categorizing and Tracking Maintenance Activities and Costs
Maintenance can be performed at any stage of the asset life cycle. Some maintenance work may or may not change the measured asset condition, extend the expected asset life cycle, or reduce risk. NCHRP Report 1076: Guide for Incorporating Maintenance Costs Into a TAMP establishes five categories of maintenance work to be considered in the incorporation of maintenance costs into TAM Analyses.
Operations and Routine Maintenance
TAM Webinar #59 - Incorporating Maintenance Costs Into a TAMP
Operational and routine maintenance activities may restore or sustain the functionality of an asset, but they do not change measured asset conditions (e.g., road patrol, mowing, and snow and ice control). These activities do not typically have a direct impact on an asset’s service life. Therefore, these are activities that are not generally considered in lifecycle planning (LCP) analysis. An absence of routine maintenance may increase the likelihood of some risks, as the performance of these tasks is typically assumed as part of the highway design process (Allen, et. al. 2023).
Preventive Maintenance
As the name indicates, preventive maintenance prevents or addresses deterioration to delay a decline in measured conditions but does not significantly improve conditions. Common examples include crack seal, chip seal, sweeping, drain cleaning, bridge washing (Allen, et. al. 2023).
Repair
Repairing damage or deterioration improves the measurable asset condition and restores function but does not restore or improve structure, capacity, or functionality. Examples of repairs include milling and inlaying pavement, bridge deck repairs, and bridge member repairs. These activities may include replacement of parts but not major components. The quantity of repair, rather than the type of activity, is what typically designates an activity as maintenance instead of rehabilitation or preservation (Allen, et. al. 2023).
Unit or Major Component Repair
Unit or component replacement goes beyond repair to remove and replace one or more individual asset components, restoring functionality for that component. Examples include sign panel replacement, striping, and traffic signal component replacement. For some assets, such as ground mounted signs, the entire asset may be replaced under a maintenance action because of the mechanism by which the replacement is delivered or funded (Allen, et. al. 2023).
Organizational Strengthening
Organizational strengthening includes activities that are not directly asset related. These activities may mitigate risk or improve organizational capacity. Examples include training, emergency preparedness, management systems and their use (Allen, et. al. 2023).
6.6.2
Capturing Maintenance Cost and Accomplishment Data
This subsection discusses the challenges of capturing maintenance costs for TAMPs, particularly when maintenance work is delivered by in-house crews or through different contract mechanisms. It emphasizes the need to align costs from different sources, such as in-house and contract maintenance costs, both financially and in terms of units of accomplishment. Examples are provided to illustrate approaches for aligning and tracking maintenance costs.
Introduction
The majority of asset management costs, for large transportation agencies, are contract costs for preservation, renewal, and construction of assets. However, maintenance investments have a significant impact on asset conditions and should be accounted for in a TAMP. Capturing maintenance costs for inclusion in a TAMP often poses unique challenges, because maintenance work is often delivered by in-house crews or through different contract mechanisms than major capital projects. These costs may also be tracked through different IT systems than capital costs.
When capturing costs for incorporation into a TAMP, it is also important to capture what is purchased, or accomplished, with those investments. Maintenance accomplishments are typically captured in terms of maintenance activities. However, the units of accomplishment for these activities may not easily align with asset management measures. Further the units of accomplishment may vary between work performed by in-house crews and work performed by contract.
In-House Maintenance Costs
Maintenance crews commonly report their efforts and accomplishments on a daily basis through a work reporting system. Most State DOTs currently use some form of maintenance management systems (MMS) to report work performed, along with the resulting accomplishments and costs.
In-house maintenance costs commonly include the cost of labor, equipment, materials, and overhead expenses related to work performed by maintenance field crews. These costs are captured through work order or daily report records, in which costs are associated with one or more actions, commonly called “tasks,” performed by the crew. Each task has an associated task code, which serves as a unique identifier, and a specific unit of measure for reporting accomplishments. For example, the task of “ditch cleaning” may have a unit of accomplishment of “feet,” or the task of “mowing” may have a unit of accomplishment of “acres.”
Contract Costs
Maintenance contract costs, like typical construction contract costs, are captured in terms of contract pay items. These pay items commonly do not align with the maintenance. Moreover, the unit of accomplishment may depend on the type of contract used to procure the work. For example, a contract to clean ditches may have a pay item measured in feet of ditch cleaned, cubic yards of material removed, or hours of work performed.
Maintenance contracts may be funded from an agency's Capital program or Maintenance budget. In many cases maintenance contracts funded through different programs are managed with different systems and have different means of tracking both costs and accomplishments. All of these differences can make tracking maintenance costs more challenging than the costs for other work types.
Aligning Costs from Different Sources
To incorporate maintenance costs into a TAMP, the costs from multiple sources need to be aligned in regard to both their financial components and their units of accomplishment.
The primary source of misalignment between in-house and contract maintenance costs is that in-house costs are captured through individual components of labor, equipment, materials, and overhead, whereas contract costs are captured based on pay items that combine each of these components. The labor costs captured through maintenance management systems (MMS) may or may not include an estimate of overhead costs. To facilitate comparison of in-house labor costs to contract costs an overhead multiplier should be applied. Best practices for ensuring in-house costs are accurate includes interfacing the maintenance management systems with the agency’s financial or enterprise resource planning (ERP) system.
Once the costs are aligned financially, they must be aligned to common units of accomplishment to allow them to be incorporated into asset management analyses. The Maryland DOT State Highway Administration (MDOTSHA) and Texas DOT (TxDOT) offer two examples of how this alignment can be accomplished. These examples are taken from NCHRP Report 1076, Guide for Incorporating Maintenance Costs into a Transportation Asset Management Plan. TxDOT’s approach requires inspectors on maintenance contracts to enter daily accomplishment information into both the Capital Program management system, SiteManager, and the MMS. MDOTSHA has developed a set of Project Cost Activity (PCA) codes to track in-house maintenance expenses. These codes are incorporated into the records of all maintenance contracts to facilitate alignment of costs and accomplishments.
Maryland DOT
The MDOT SHA reports labor, equipment, and materials costs for its State forces’ work into the electronic team activity cards (eTAC) system. These costs are captured by asset or unit. MDOT SHA enters contract data into the FHWA Financial Management Information System (FMIS) and other contract management software. The contract systems and eTAC assign a Project Cost Activity (PCA) code for each expense. The PCA codes allow the costs from similar work, delivered by different means, to be aggregated. The PCA codes are linked to the twenty-one Maryland Condition Assessment Reporting System (MCARS) elements to align costs with asset performance. MDOT SHA uses QlikView to aggregate the work output, cost data, and MCARS data and associate each to the appropriate PCA code for the work activity accomplished (see Figure 6-B, a screenshot of QlikView provided by MDOT SHA). Data aggregation with QlikView works well if data is accurate with the PCA codes, costs, and accomplishments.
Screenshot of QlikView
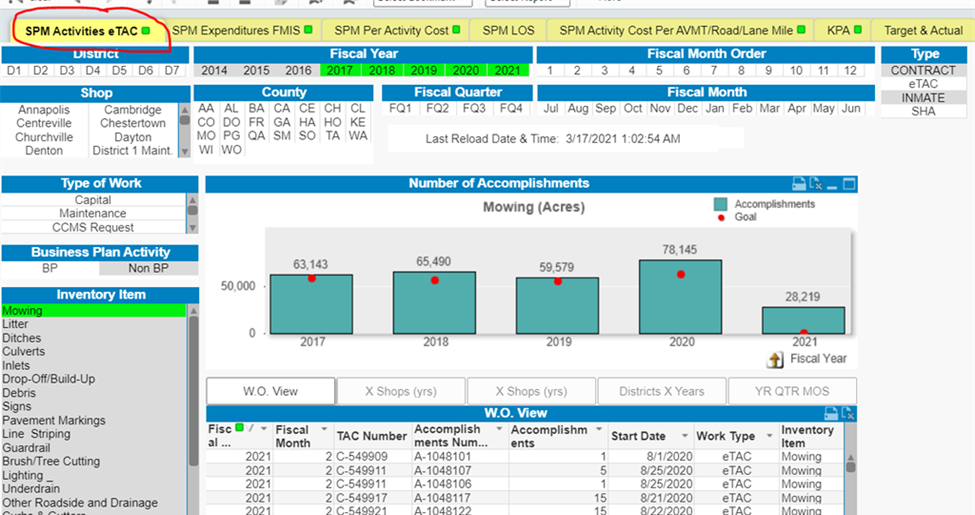
Source: MDOT SHA
This approach enables MDOT SHA to perform an analysis to determine whether in-house or contracted maintenance provides a more cost-efficient result for the activity or asset. This is an important analysis to consider when developing maintenance work programs as it allows an agency to be strategic with limited resources” (Allen, et. al. 2023).
*Note: This practice example was derived from NCHRP Research Report 1076: A Guide to Incorporating Maintenance Costs into a Transportation Asset Management Plan.
Texas DOT
TxDOT provides an example of effective contract maintenance cost data collection processes. TxDOT contracts approximately 52 percent ($620 million) of its $1.2 billion maintenance budget for routine maintenance. Contracted work is interfaced into TxDOT’s MMS in two ways: from its enterprise resource planning (ERP) software and from its construction contract management software. TxDOT typically uses work orders (WO) for contracts less than $25,000. The process for capturing and reporting contract maintenance costs is shown in Figure 6-A.
Figure 6-A: TxDOT Contract Purchase Order Data Collection Process
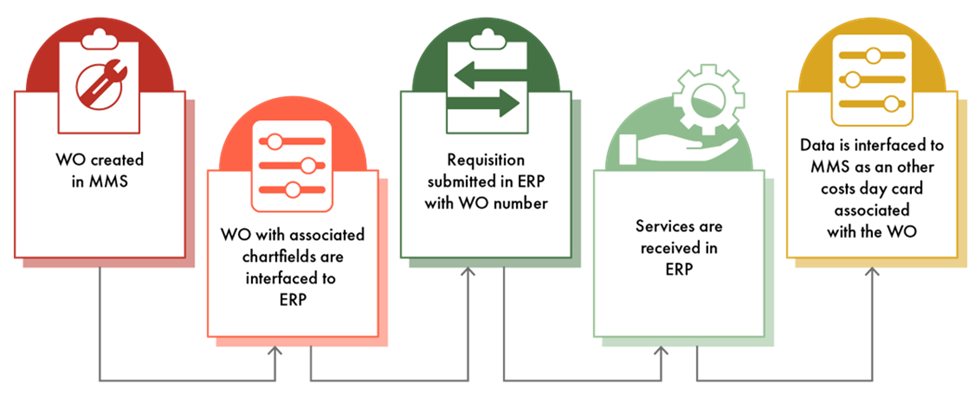
Source: Texas DOT
For larger projects, TxDOT utilizes AASHTOWare Site Manager, including the Routine Maintenance Contract Administration module. Daily work reports allow inspectors to capture work performed at the job site such as personnel, equipment, work items, quantities, descriptions, etc. Over 3,700 pay items are used on routine maintenance contracts and the Maintenance Distribution Window, a custom upgrade to Site Manager, ties the pay item cost to the MMS function code (i.e., what work is being performed) and amount of work performed. The MMS then provides reports by function code for both in-house and contracted work and TxDOT actively monitors data quality to ensure accurate reporting and analysis” (Allen, et. al. 2023).
*Note: This practice example was derived from NCHRP Research Report 1076: A Guide to Incorporating Maintenance Costs into a Transportation Asset Management Plan.
6.6.3
Incorporating Maintenance Costs into TAMP Analysis
This subsection introduces strategies for incorporating maintenance costs into key TAMP analyses, such as lifecycle planning, risk analysis, and financial/investment planning. It also provides insights into addressing unexpected disruptions using historical trends and other data. While many agencies capture maintenance costs and asset conditions within an MMS, few agencies use that data for the type of long-term analysis used to develop a TAMP.
Life Cycle Planning
One benefit of categorizing maintenance activities by their impact on the asset life cycle is that it facilitates incorporation of costs from those activities into Life Cycle Planning (LCP) analysis.
- Preventive Maintenance, Repair, and Unit Replacement costs are all critical inputs to LCP analysis. These costs are sometimes considered under the Preservation work type by State DOTs. Assets are typically eligible for each type of maintenance activity at a specific point in their lifecycles. Once a certain level of deterioration has been reached, a given type of activity ceases to be a cost-effective treatment. To incorporate these maintenance activities into LCP for a given asset class, agencies should consider the following:
-
- The size of the asset inventory.
- The number (or percentage) of assets eligible for the activity type.
- The length of time a typical asset is eligible for the activity type.
- The available treatments and their unit costs.
- How the application of each treatment impacts asset conditions.
- The quantity of each treatment to be applied in each year of the analysis.
- Operations, routine maintenance, and Organizational Strengthening costs do not have a direct impact on future conditions, and are generally not included in LCP analysis.
Risk Management
Maintenance crews and contracts are often critical components of risk mitigation strategies. The way these resources are deployed to address risks depends on the type of risk, which can be broadly incorporated into two categories: events and trends.
Risk Events
Maintenance resources represent a transportation agency’s first responders to major and minor disruptive events. Costs for response to risk events can be captured using normal work reporting procedures. Agencies often apply a code to signify if the work being reported is in response to a specific event. In some cases, the agency may be deploying maintenance resources in response to an event that has not yet been identified. In these cases, staff may need to review past records so they can be associated correctly.
Trends and Long-Term Change
Maintenance can be deployed to address long-term trends that impact asset conditions. Other trends may impact an agency’s ability to deploy maintenance. Examples of trends that impact maintenance include the following (Allen, et.al. 2023).
- Changes to regulations, requirements or standards may require a rapid response to replace non-conforming assets, or may impact the cost of future maintenance.
- Changing customer expectations may lead to changes in maintenance performance standards and drive future budget changes.
- Funding fluctuations may provide a boost to or decline in maintenance capabilities. In turn this could lead to changes in asset performance, or vulnerabilities.
- Aging infrastructure can lead to network wide changes in maintenance needs. This can occur cyclically, following large building cycles, such as the interstate construction era from 1960 to 1980.
- Staff turnover due to retirements can create a need for better knowledge management.
- Rapid system expansion can lead to an increased need for future maintenance. Since the need is not immediate, there can be a lag between the need arising and an awareness of that need among executives and legislators who establish maintenance budgets.
- Long-term or gradual environmental changes can impact asset performance by exposing infrastructure to conditions it was not designed to withstand. Maintenance may be required to retrofit or replace poorly performing assets.
Financial Planning
The TAMP Financial Plan should consider all sources of funding used to support maintenance. The Financial Plans should indicate how that available funding is expected to be used over the TAMP time period. This will typically require extrapolation or forecasting beyond established maintenance budgets. The maintenance activity categories can be helpful in determining how to account for this funding within the plan.
- Preventive Maintenance, Repairs, and Unit Replacements are often funded and delivered by multiple programs. As such some of these costs may be captured under the Preservation work type, and some captured under Maintenance. Agencies should take care in understanding how this work is funded and delivered to ensure costs are fully captured and not double counted in the TAMP.
- Funding for Operations and Routine Maintenance may come from its own budget line or be part of overall maintenance funding. Additionally, some operations expenses may be funded out of capital programming through programs such as the Congestion Mitigation and Air Quality (CMAQ) program. These activities are generally performed in a similar fashion regardless of asset condition. Therefore, these are commonly included as fixed-cost items that reduce the amount of funding available for activities that improve asset condition. Typically, this is included as an average annual cost.
- Organizational Strengthening activities can be budgeted separately from the other categories to clearly communicate their importance and show what activities are planned. These activities can be tracked using the time, labor, and material features in a maintenance management system.
A process for developing TAMP financial plans has been established through several documents. Most recently, NCHRP Report 1076, Guide for Incorporating Maintenance Costs into a TAMP updated this process to better incorporate maintenance costs (Allen et. al. 2023).
- Determine the scope of the TAM program.
- Identify maintenance fund sources.
- Establish maintenance fund uses.
- Structure maintenance sources and uses list.
- Validated the list.
- Document Constraints.
- Document assumptions about fixed costs.
Investment Strategies
As described in Chapter 5 of this guide, investment strategies establish a long-term plan for how the agency will apply its resources to achieve its asset management objectives. Agencies typically develop investment strategies through a scenario-based planning process. In this process the agency evaluates costs and benefits of different investment scenarios to choose the most appropriate. Since the majority of TAM funding comes through capital programming that has traditionally been the focus of investment strategy development, incorporating maintenance costs and benefits into this process may require incorporation of additional performance measures, such as those established through Maintenance Quality Assurance (MQA). MQA performance measures are often more directly related to investments in maintenance activities, whether through in-house crews or contracts. NCHRP Report 1076, Guide for Incorporating Maintenance Costs into a TAMP suggests the following steps for developing investment strategies that fully incorporate maintenance investments and benefits (Allen et. al. 2023).
- Define the role of maintenance in each scenario.
- Identify existing commitments to future investments in maintenance.
- Incorporate MMS and MQA data to improve predictions of future conditions.
- Perform initial budget allocations, including maintenance.
- Identify candidate projects and field crew capacity.
- Develop scenarios for analysis.
- Review predicted future conditions and predicted maintenance needs.
- Finalize funding levels by use.
- Document maintenance strategies for addressing performance gaps.
- Document assumptions and strategies.
September 1, 2016 | AASHTO
This guide discusses the range of risks a transportation agency faces and details how to establish an enterprise risk management program.
External Link: https://store.transportation.org/Item/PublicationDetail?ID=2706
September 1, 2010 | FHWA
This report ties core TAM concepts to real-world case studies nationwide and worldwide to show how they can enhance sustainability and accountability.
External Link: https://www.fhwa.dot.gov/asset/10009/tam_topr806.pdf
November 1, 2023 | IDG Communications, Inc.
A RACI matrix is a simple, effective means for defining project roles and responsibilities, providing a comprehensive chart of who is responsible, accountable, consulted, and informed every step of the way.
External Link: https://www.cio.com/article/2395825/project-management-how-to-design-a-successful-raci-project-plan.html
September 1, 2012 | AASHTO
This guide aims to provide strategies and insights for state DOTs on management of their pavement.
External Link: https://store.transportation.org/Item/CollectionDetail?ID=117
March 19, 2004 | AASHTO
This guide links together, using strategic performance measures, strategic planning and performance measurement to translate organizational vision into a small group of measurable, meaningful, and accurate performance measures.
External Link: https://trid.trb.org/View/696635
October 19, 2023 | Engineering News-Record
This website contains an explanation of the indexes methodology and a complete history of the 20-city national average for the CCI and BCI. Both indexes have a materials and labor component. In the second issue of each month ENR publishes the CCI, BCI, materials index, skilled labor index and common labor index for 20 cities and the national average.
External Link: https://www.enr.com/economics
March 1, 2023 | Transportation Research Board
This document, the Bridge Inspector’s Reference Manual (BIRM), is a comprehensive reference manual on programs, procedures, and techniques for inspecting and evaluating a variety of in-service highway bridges. It was intended to replace the Bridge Inspector’s Reference Training Manual (BITM) 90 which was first published in 1991 to assist in training highway personnel for the new discipline of bridge safety inspection.
External Link: https://trid.trb.org/view/2219426
January 1, 2018 | FHWA
This resource provides information on performance monitoring. Performance measures are used to prioritize projects, provide feedback on the effectiveness of long-term strategies, refine goals and objectives, and improve processes for the delivery of transportation services.
External Link: https://tmcpfs.ops.fhwa.dot.gov/cfprojects/uploaded_files/tms_pmer_brochure.pdf
September 1, 2006 | FHWA
An overview of TAM principles and processes.
External Link: http://www.trb.org/publications/nchrp/nchrp_rpt_551.pdf
September 1, 2010 | Transportation Research Board
Measuring Transportation Network Performance explores ways to monitor transportation network performance by developing new or integrating existing performance measures from different transportation modes and multiple jurisdictions.
External Link: https://nap.nationalacademies.org/catalog/14425/measuring-transportation-network-performance
January 1, 2012 | Transportation Research Board
Estimating Life Expectancies of Highway Assets, Volume 1: Guidebook addresses how to apply a methodology for estimating the life expectancies of major types of highway system assets. The methodology is designed for use in lifecycle cost analyses that support management decision making.
External Link: https://nap.nationalacademies.org/catalog/22782/estimating-life-expectancies-of-highway-assets-volume-1-guidebook
January 1, 2019 | FHWA
A Guide to Developing Financial Plans and Performance Measures for Transportation Asset Management presents guidance for state departments of transportation (DOTs) and other agencies conducting financial analyses and developing financial plans to support efficient and effective management of the agency’s transportation assets.
External Link: https://www.nap.edu/catalog/25285/a-guide-to-developing-financial-plans-and-performance-measures-for-transportation-asset-management
January 1, 2019 | Transportation Research Board
Benchmarking and Comparative Measurement for Effective Performance Management by Transportation Agencies presents guidance and examples for selection of peer groups to ensure that benchmarking is effectively applied to enhance transportation system performance.
September 1, 2015 | Transportation Research Board
Maintenance Quality Assurance Field Inspection Practices summarizes practices used by state transportation agencies to support maintenance investments.
External Link: https://www.nap.edu/catalog/22201/maintenance-quality-assurance-field-inspection-practices
September 1, 2016 | Transportation Research Board
Life-Cycle Cost Analysis for Management of Highway Assets documents the state of the practice of life-cycle cost analysis (LCCA) and risk-based analysis into state highway agencies' asset management plans for pavements and bridges on the National Highway System. The objective of this project was to develop an inventory of quantitative asset-level, project-level, or corridor-level processes and models for predicting life-cycle costs associated with the preservation and replacement of highway assets.
External Link: https://www.nap.edu/catalog/23515/life-cycle-cost-analysis-for-management-of-highway-assets
January 1, 2010 | Transportation Research Board
A Methodology for Performance Measurement and Peer Comparison in the Public Transportation Industry explores the use of performance measurement and benchmarking as tools to help identify the strengths and weaknesses of a transit organization, set goals or performance targets, and identify best practices to improve performance.
External Link: https://www.nap.edu/catalog/14402/a-methodology-for-performance-measurement-and-peer-comparison-in-the-public-transportation-industry
September 1, 2017 | U.S. Department of Transportation: Bureau of Transportation Statistics
Chapter 1 introduces the Transportation Services Index, a monthly summary of freight and passenger movement. - Chapter 2 explains what transportation contributes to the American economy. - Chapter 3 examines the costs that households and businesses pay for transportation. - Chapter 4 analyzes transportation-related employment. - Chapter 5 explains and examines trends in transportation productivity. - Chapter 6 analyzes household spending on transportation goods and services. - Chapter 7 examines government transportation spending and revenue. - Chapter 8 discusses transportation assets and infrastructure.
April 14, 2023 | FHWA
This website serves as a central database for FHWA resources surrounding the topic of Transportation Performance Management.
External Link: https://www.fhwa.dot.gov/tpm/
May 25, 2023 | FHWA
This resource serves as a database for all case studies, reports, and other publications from the FHWA that pertain to the topic: Asset Management.
External Link: https://www.fhwa.dot.gov/asset/
May 28, 2018 | Austroads
The resource provides asset management practitioners with an understanding of the factors that contribute to enabling and sustaining continual improvement. The current challenges within the industry in relation to continual improvement are discussed, with a framework provided for successful implementation.
External Link: https://austroads.com.au/publications/asset-management/ap-r571-18
February 1, 2021 | FHWA
This case study summarizes some of the good risk management practices used by various state DOTs.
External Link: https://rosap.ntl.bts.gov/view/dot/55725
August 1, 2023 | FHWA
This report builds on information gathered from developing state DOT case studies on identifying and managing financial risks. This report summarizes the common financial risks considered in state DOT TAMPs and how these factors influence the development of TAMP investment strategies.
External Link: https://www.fhwa.dot.gov/asset/pubs/hif23049.pdf
January 1, 2022 | FHWA
Implementation of the AASHTO Guide for Enterprise Risk Management documents how several state departments of transportation are adopting risk management principles and practices.
External Link: https://nap.nationalacademies.org/catalog/26516/implementation-of-the-aashto-guide-for-enterprise-risk-management
December 30, 2022 | Transportation Research Board
Guide to Effective Methods for Setting Transportation Performance Targets, from TRB's National Cooperative Highway Research Program, is designed to help state DOTs and metropolitan planning organizations identify effective methods for setting transportation performance targets based on established national measures.
External Link: https://apps.trb.org/cmsfeed/TRBNetProjectDisplay.asp?ProjectID=4788
June 28, 2017 | FHWA
This resource defines and positions terminology used when discussing the concept of asset sustainability.
External Link: https://www.fhwa.dot.gov/planning/processes/statewide/practices/asset_sustainability_index/page01.cfm
December 31, 2020 | FHWA
This resource includes all the implementation plan activities with scheduled completion dates between 2018 and 2020. There are 38 of these activities in the plan, 37 of which are completed.
External Link: https://www.fhwa.dot.gov/tpm/plan/
June 1, 2018 | FHWA
National Performance Measures for Congestion, Reliability, and Freight, and CMAQ Traffic Congestion: General Guidance and Step-by-Step Metric Calculation Procedures presents recommended steps for calculating the National Highway System performance metrics, the Truck Travel Time Reliability metrics, and the Peak Hour Excessive Delay metric.
External Link: https://www.fhwa.dot.gov/tpm/guidance/hif18040.pdf
July 1, 2019 | FHWA
This paper examines how the transportation asset management processes in 23 CFR 515, the transportation performance management processes in 23 CFR 490, and the planning requirements in 23 CFR 450 increase the linkage between asset management and performance management.
External Link: https://www.fhwa.dot.gov/asset/etg/pubs/whitepaper2.pdf
January 1, 2023 | Transportation Research Board
Guide to Effective Methods for Setting Transportation Performance Targets, from TRB's National Cooperative Highway Research Program, is designed to help state DOTs and metropolitan planning organizations identify effective methods for setting transportation performance targets based on established national measures.
External Link: https://nap.nationalacademies.org/catalog/26764/guide-to-effective-methods-for-setting-transportation-performance-targets
March 1, 2021 | Transportation Research Board
This white paper outlines, in simple terms, the fundamental concepts associated with the RSI framework. The document leads the reader through the basic process of RSI application and uses simple examples to illustrate how the RSI framework can be used to support investment decisions.
External Link: https://trid.trb.org/view/1833123
September 20, 2023 | FHWA
This resource summarizes the Federal Highway Administration (FHWA) report Development of Next Generation Pavement Performance Measures and connects the effort to a broader project to develop Performance Management Objectives. Furthermore, the resource describes key findings from the research and explores how they can be used to support agency decision-making strategies.
External Link: https://trid.trb.org/View/2259800
September 20, 2023 | FHWA
This TechBrief serves as a follow up to Next-Generation Pavement Performance Measures (FHWA-HRT-23-102). It outlines the Federal Highway Administration (FHWA) report Development of Next Generation Pavement Performance Measures and Asset Management in an ongoing effort to develop and refine Performance Management Objectives.
External Link: https://trid.trb.org/View/2259801
June 9, 2022 | FHWA
The purpose of the project is to identify, analyze, communicate, and deploy a set of leading indicators of transportation performance. The project will produce a report that shows how transportation agencies can deploy leading indicators to monitor and adjust performance measure targets for the national performance-measurement areas (including infrastructure condition), and lays out an approach that transportation agencies can use to identify, analyze, and select their own leading or lagging indicators to inform investment decision-making.
External Link: https://highways.dot.gov/research/rtportfolio/infrastructure-performance-management
January 1, 2022 | Transportation Research Board
Managing Performance to Enhance Decision-Making: Making Targets Matter offers a set of feedback enrichment strategies illustrated by case studies of how agencies are effectively incorporating people- and data-based feedback into decision-making on transportation issues ranging from long-term strategy development to medium-term program development to day-to-day operations.
External Link: https://nap.nationalacademies.org/catalog/26600/managing-performance-to-enhance-decision-making-making-targets-matter
January 1, 2022 | FHWA
Implementation of the AASHTO Guide for Enterprise Risk Management documents how several state departments of transportation are adopting risk management principles and practices.
External Link: https://nap.nationalacademies.org/catalog/26516/implementation-of-the-aashto-guide-for-enterprise-risk-management
January 1, 2022 | USDOT OST-R
This project develops a comprehensive analytical framework for risk-based infrastructure asset management for both normal and extreme management conditions.
External Link: https://cait.rutgers.edu/wp-content/uploads/2020/12/cait-utc-reg-38-final_v3.pdf