5.1.3
Prototypical Resource Allocation Process
The basic resource allocation approach includes seven basic steps. Specific approaches to resource allocation differ depending on where resources are being allocated and the organizational context.
This section describes a basic resource allocation process. The resource allocation process can be used to answer three key questions:
- What resources are required and how should they be distributed over time to best meet the long-term goals and objectives?
- What performance targets are achievable given available resources?
- How should resources be used in the short term to best support the goals and objectives?
The details of the process differ depending on what resources are being allocated to what investments, the timeframe and the particular circumstances faced by the organization.
A generic process is presented here as a framework for assessing the different allocation processes used by different organizations, as well as to help structure the discussion of issues related to resource allocation presented in subsequent sections of this chapter. The process is iterative; it is frequently necessary to walk through the process in order to establish a proposed allocation, review the proposed solution, and then revisit the assumptions made earlier, altogether resulting in a revised outcome.
TIP
Almost all agencies already have structured resource allocation processes; introducing TAM or improving TAM practice should begin with assessing existing processes to identify areas where asset-related data and TAM process analysis outputs (e.g. life cycle planning outputs) can be incorporated.
In applying the prototypical process, it is important to consider that organizations typically have different resource allocation processes for allocating different resources over different time periods. The basic steps in the process are the same regardless of the specific context, but the details of how each step is performed may vary.
For example, in considering how to allocate resources over a period of 10 years or more, an organization might consider what funding is needed and how best to allocate funds across multiple investment categories while setting aside decisions about specific projects. In this case, the key resource being allocated is money, and the emphasis of the process will be on Step 1 – Establish Goals and Objectives and 3 – Quantify Targets. Further, in this case there may be less emphasis on Step 2 – Determine Constraints, and the prioritization performed in Step 5 may yield identification of high-level priorities rather than a prioritization of specific projects.
On the other hand, when considering how best to use staff resources and materials to perform maintenance work in the short term (less than one year), the organization would apply the process differently. In this case, the resources being allocated would include time and materials. The emphasis on the process will be on Step 2 – Determine Constraints, Step 5 – Prioritize Investments, and Step 7 – Finalize Allocation and Plans. In this case the specific allocation may not have a significant impact on the goals and objectives established in Step 1, and the prediction of future performance in Step 6 is less relevant than in the case of a longer-term allocation.
The practice examples in this section show how agencies have implemented this basic process to address different resource allocation challenges.
TIP
Although a generic framework for resource allocation is presented, agency context and other factors (e.g. legal requirements) will create the need for agencies to allocate resources in different ways.
Michigan DOT
Michigan DOT recently introduced principles of performance-based contracting to their routine highway maintenance delivery. The focus of this initiative was on developing a better understanding of performance, providing more consistency of service, encouraging innovation adoption and identifying efficiency opportunities.
To achieve this MDOT developed performance measures for 23 non-winter maintenance activities. They then examined how these activities contributed to the objectives and community outcomes MDOT wanted to achieve (e.g. safety, reliability, economic benefit, and quality of life) and used that analysis to select six initial key measures for which targets were set to focus the effort. The performance monitoring system helped one MDOT region identify unsealed shoulders (ensuring they are even and traversable) as an area requiring improvement. They invested in additional shoulder maintenance in 2015 and from this realized a performance increase of more than 30%.
MDOT is using this performance monitoring approach to better understand the cost of improving its maintenance level of service. The agency is also identifying specific resources to focus in areas where it can achieve a more consistent and safer outcome.
Southland District Council (New Zealand)
Southland District Council (SDC) manages one of the largest road networks in New Zealand. Dairy farming is critical to the economy of the local area and more broadly to the Country (SDC generates 10% of New Zealand’s dairy exports). In the period 2000-2010 there had been significant expansion of the dairy farming industry and further expansion was likely. Maintenance and renewal costs were estimated to increase significantly and SDC’s road rates were already among the highest in the country. SDC recognized that a new approach was necessary and they could not keep doing things the same way.
SDC developed the Economic Network Plan as an asset management approach that allowed SDC to determine where investment in the network would provide the greatest financial return to the community. The Economic Network Plan considered the following services provided by the network:
- Safety
- Road Condition (Levels of Service)
- Enable Exports
- Service Delivery
- Customer Quality
Consideration of the resources required to maintain the network led SDC to the decision that its highest volume roads would be maintained to its then-current LOS standard. These roads represented 20% of the road network but carried nearly 70% of the traffic. The remaining 80% of the network would have a reduction in standard over time. The Economic Network Plan provided the basis for this change.
Like many agencies, the SDC was forced to take a different approach when financial constraints required change. It enabled all parties to focus on:
- Shifting from ‘Engineering’ to ‘Customer Service Network Management’ (why the service is provided)
- Managing customer expectations proactively rather than reacting to them
- Making safety a priority
- Investing in technology and information to understand, manage and integrate with HCV operators
Source: https://www.nzta.govt.nz/assets/Road-Efficiency-Group-2/docs/southlandnetworkplan.pdf
Note: For more information on this example, see the case study on the SDC’s experience in the International Infrastructure Management Manual (IIMM).
South Dakota DOT
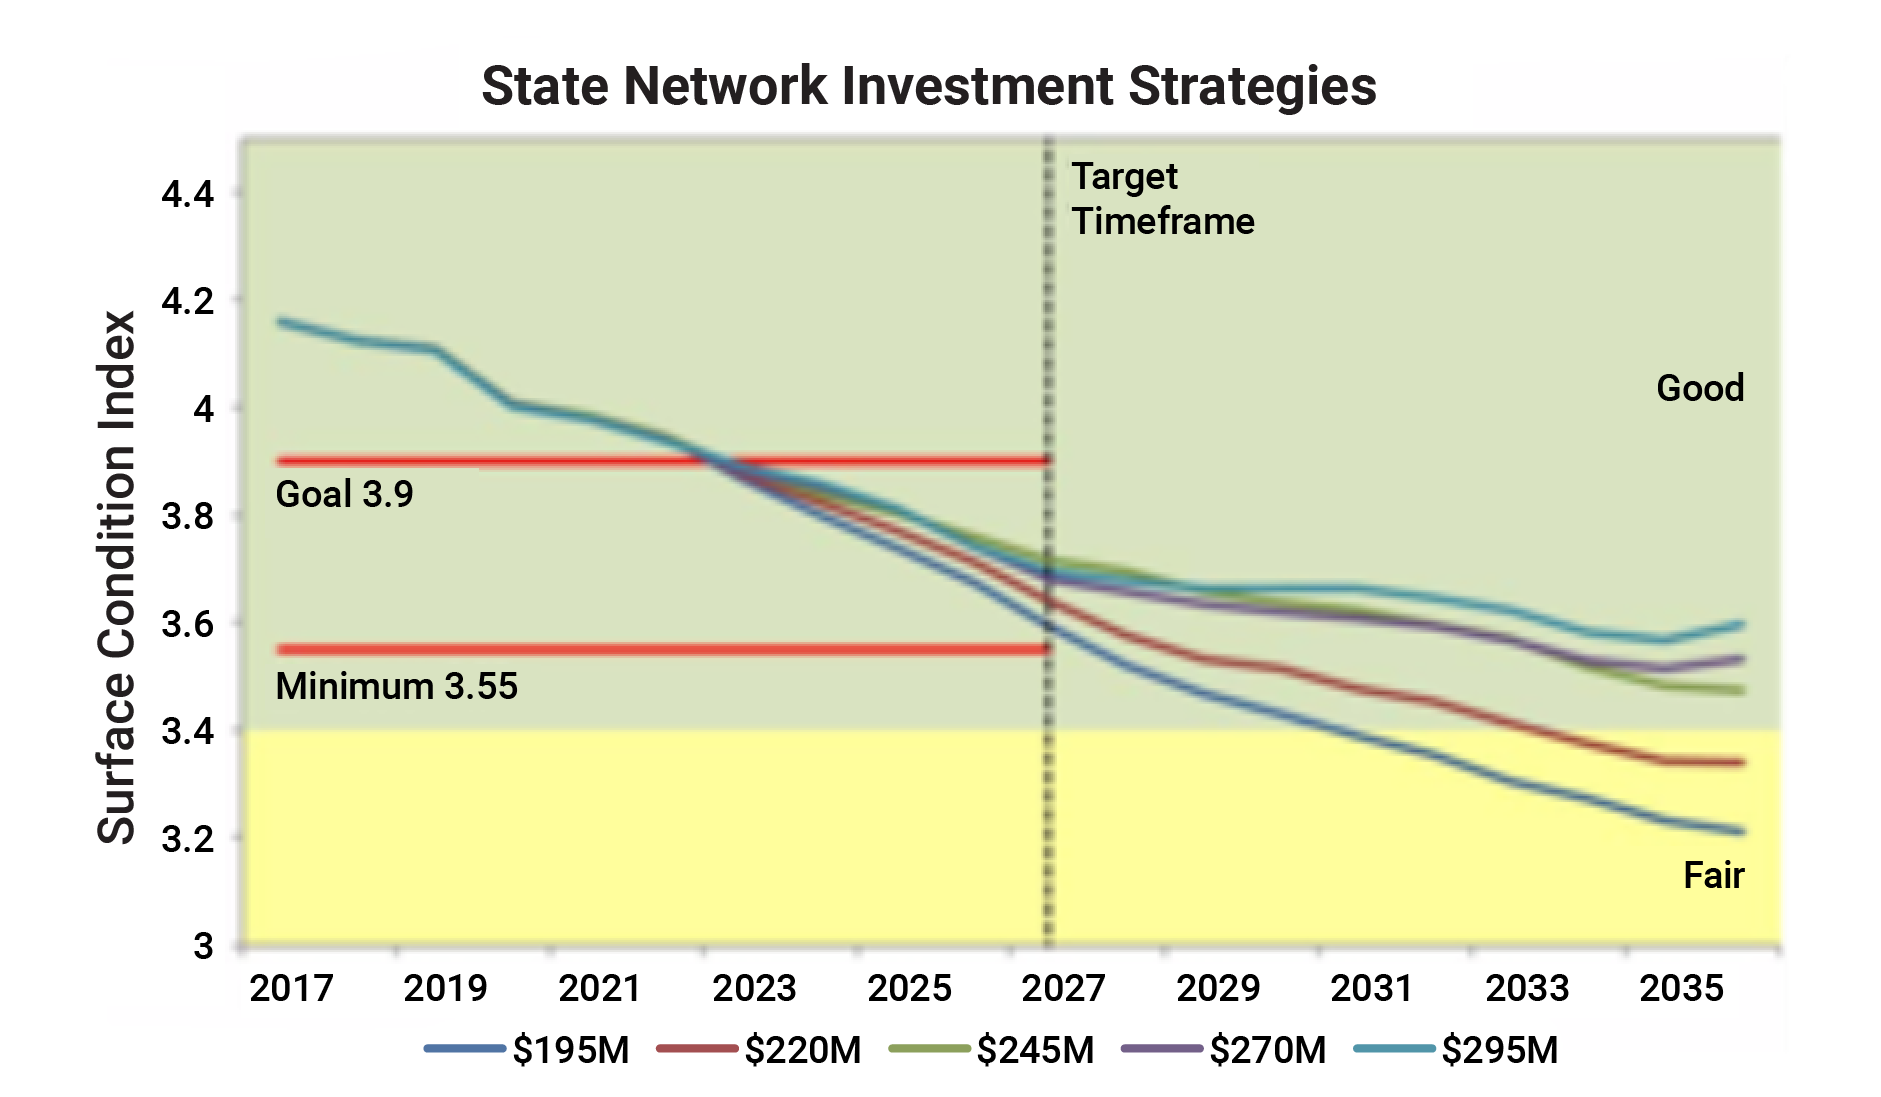
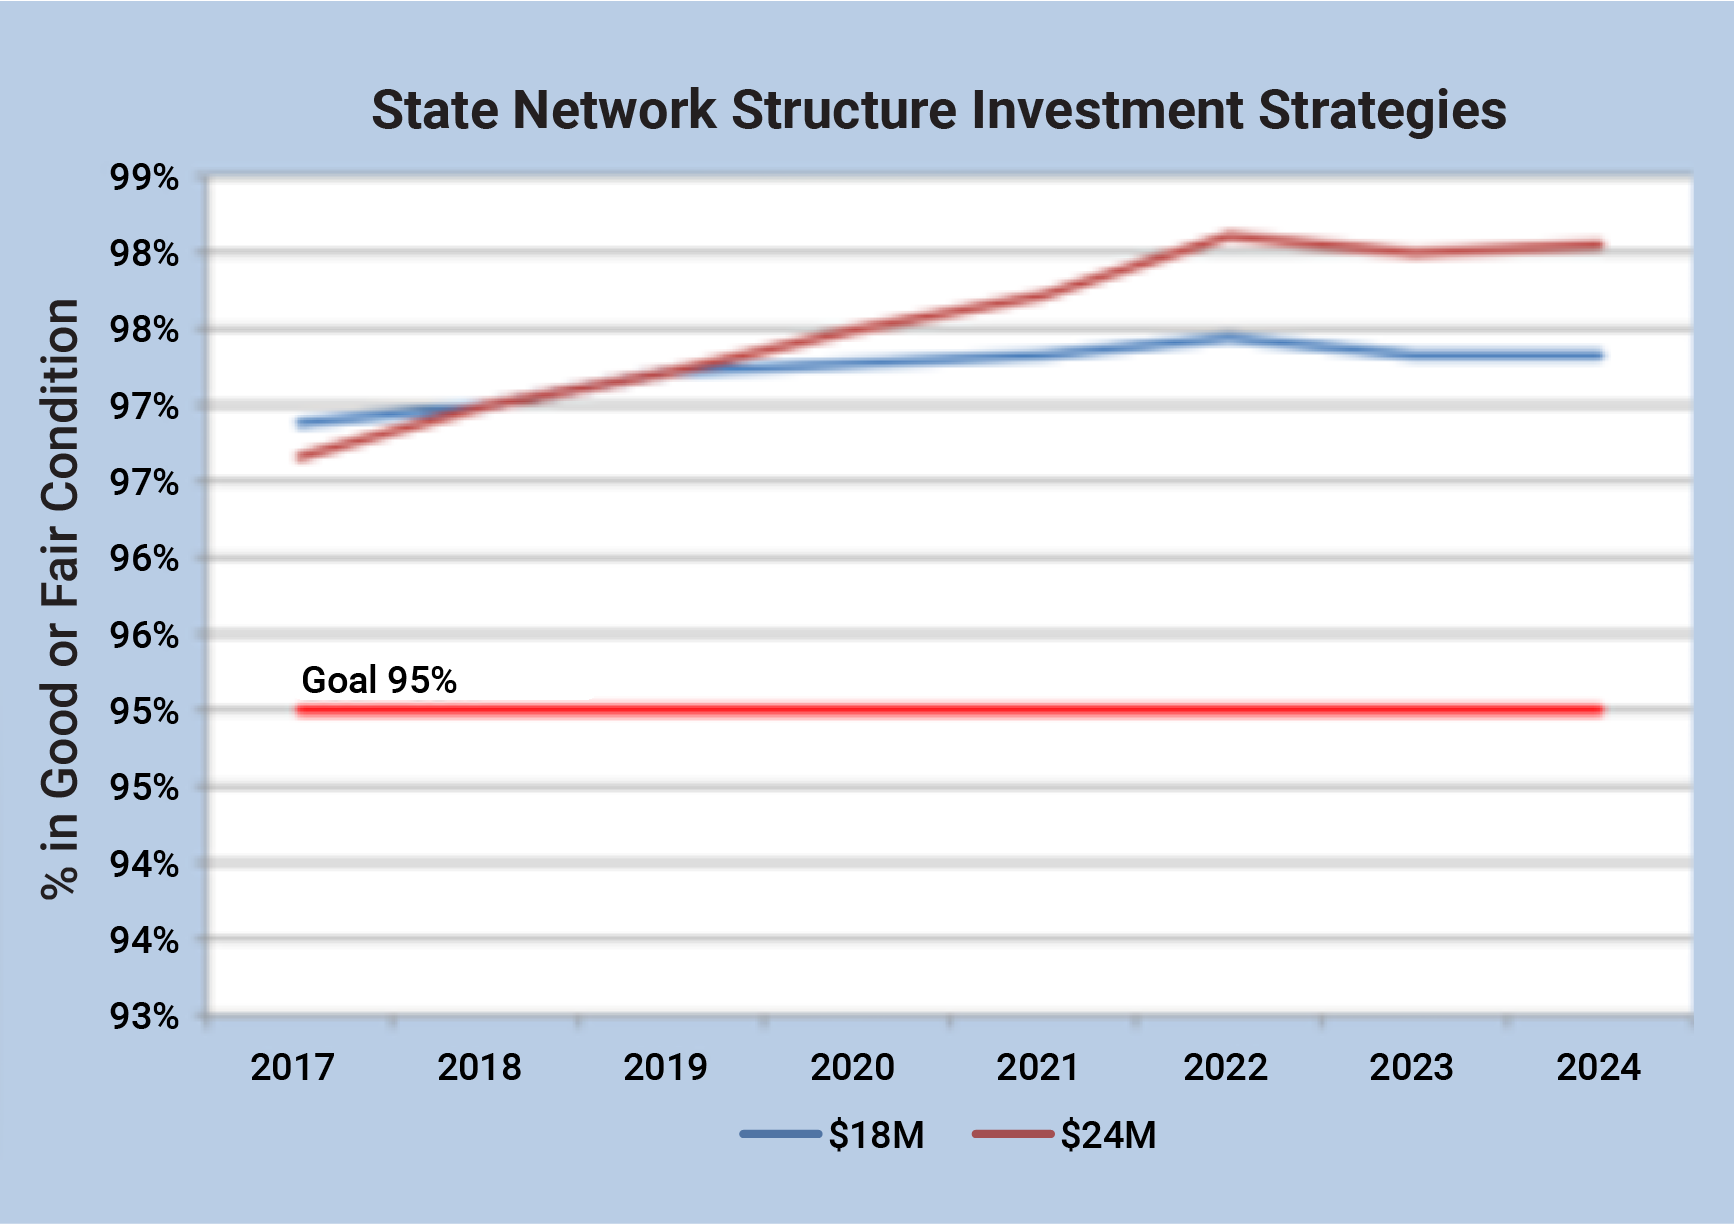
SDDOT’s agency mission is “to efficiently provide a safe and effective public transportation system.” To support this high-level goal the agency sets ten-year objectives for its pavements and bridges, as well as a minimum acceptable condition for pavements. For pavements SDDOT summarizes conditions using Surface Condition Index (SCI), a composite measure represented on a scale from 0 (worst condition) to 5 (best conditions) that incorporates measures of roughness, rutting, faulting and distress indices. For bridges, SDDOT summarizes conditions based on the percentage of structures in good or fair condition, using the FHWA good/fair/poor measure for classifying the condition of a bridge.
To determine how to allocate capital funds for state-owned pavements and bridges SDDOT relies heavily on its pavement and bridge management systems. The agency predicts conditions for a 10-year period for a range of different budget levels, and then compares the predicted performance to the agency’s goals and objectives. The figures, reproduced from SDDOT’s 2018 TAMP, show results in terms of predicted SCI over time for five budget scenarios generated using SDDOT’s Pavement Management System (PMS), and results in terms of percent of bridges in good or fair condition for two budget scenarios generated using the agency’s Bridge Management System (BMS).
Given the projections as well as additional projections of pavement condition for six functional systems, the agency uses its Trade-Off Tool to evaluate the impact of different funding scenarios and recommends the funding distribution that will produce the greatest benefit. The final result of the analysis is a distribution of funding between asset type and functional system, as well as the distribution of funds between four types of work:
- Construction and Reconstruction
- Resurfacing and Asphalt Surface Treatment
- Rehabilitation and
- Safety
Decisions about what capital projects to perform are then made given the funding level established in the trade-off analysis.
Source: SDDOT Transportation Asset Management Plan. 2018.http://www.sddot.com/resources/reports/SDDOT2018TAMPFHWASubmittal.pdf
State Network Investment Strategies
State Network Structure Investment Strategies
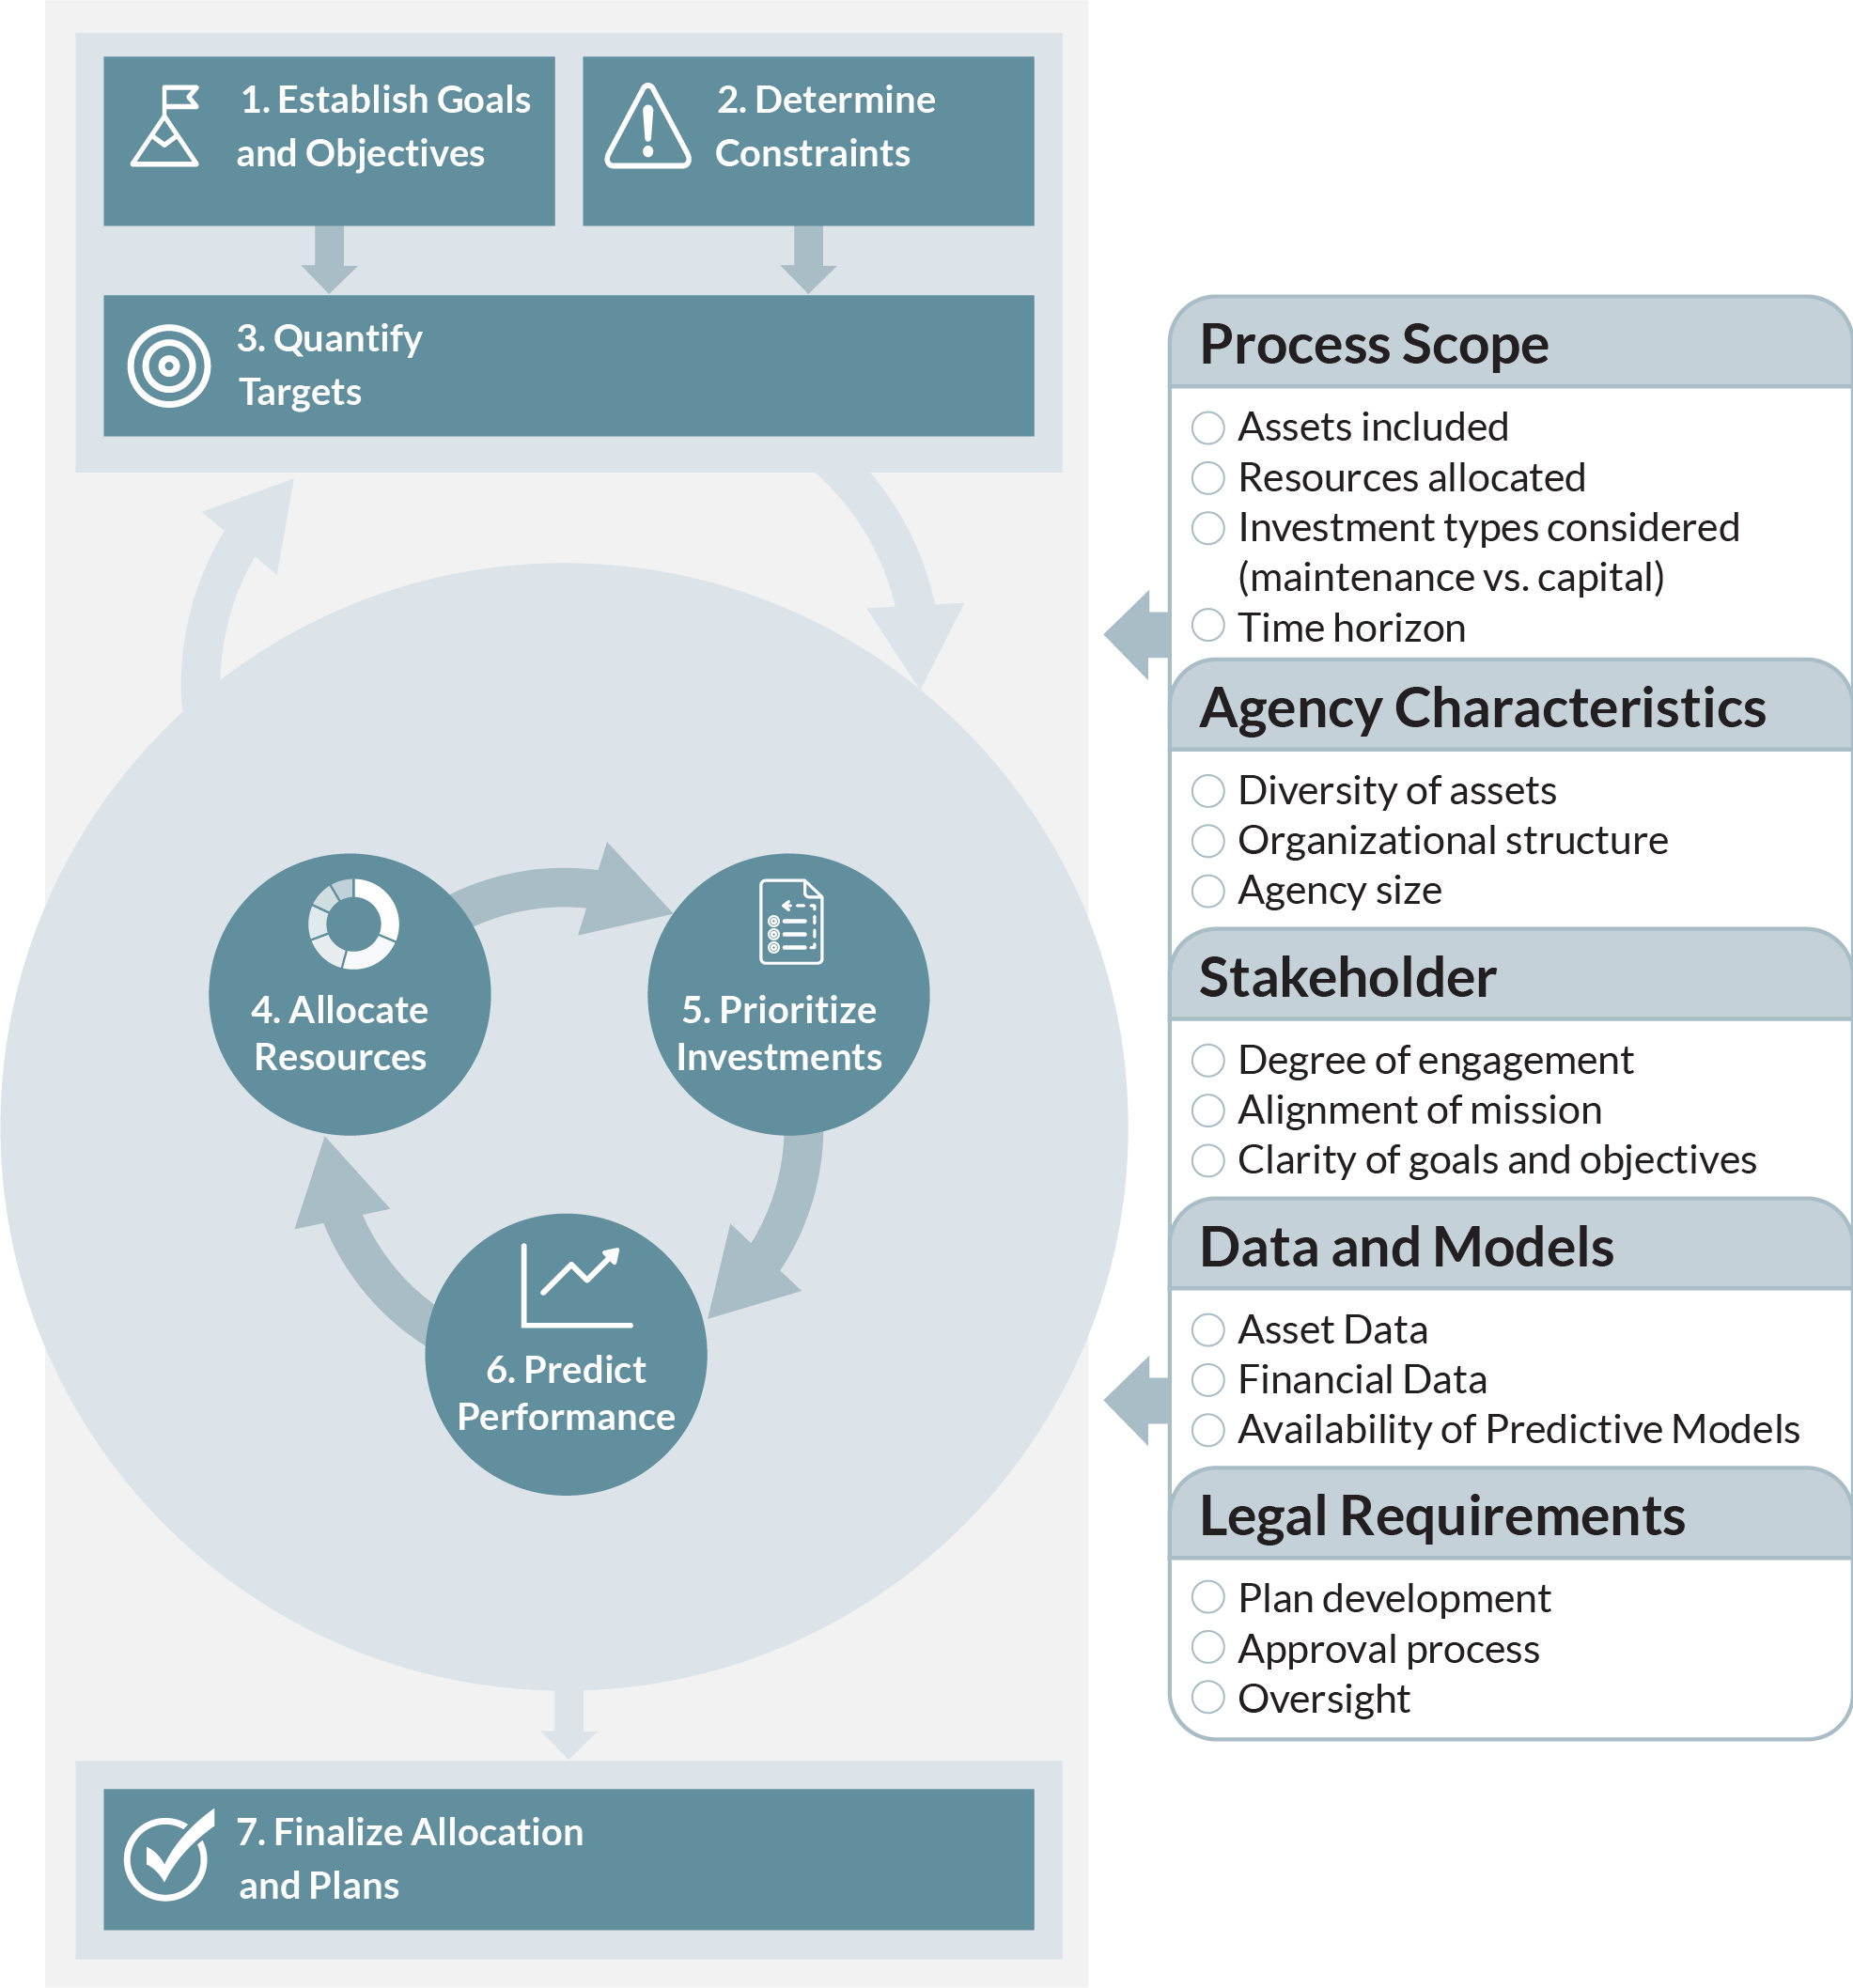
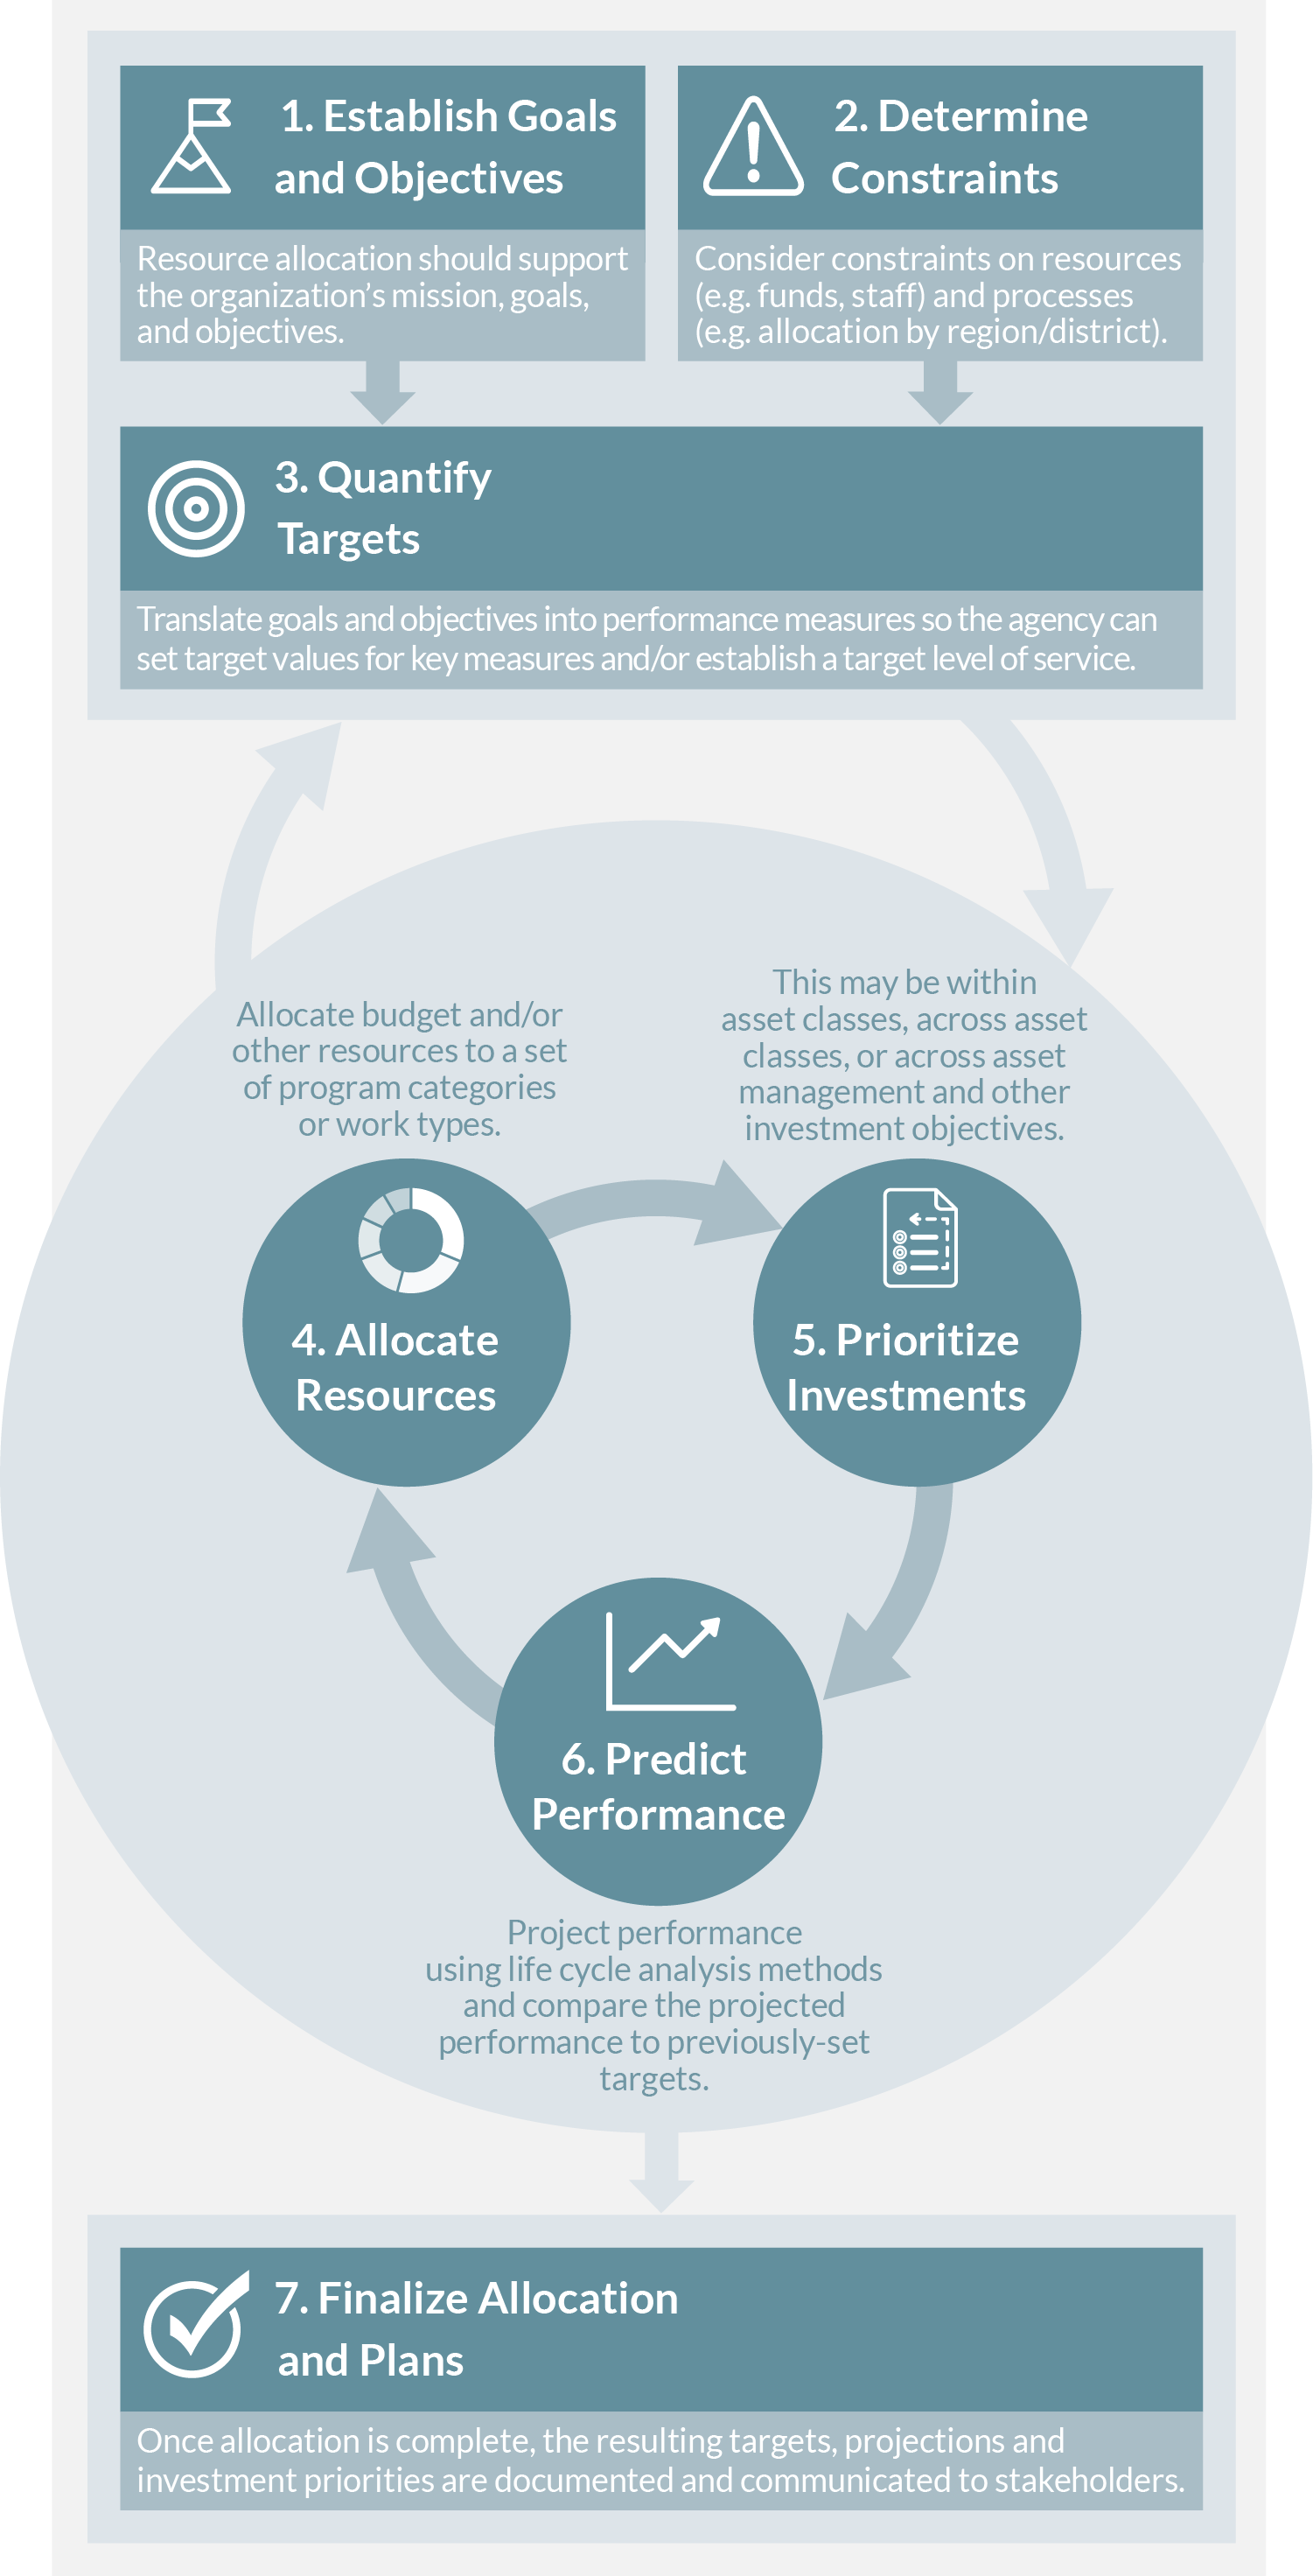
There are Seven Basic Steps in the Resource Allocation Process
- Establish Goals and Objectives. The mission, vision and broad agency goals are meant to guide decision-making across an organization. Goals and objectives may be articulated in an organization’s LRTP and/or TAMP. Ideally, the resource allocation process should support achieving these.
- Determine Constraints. Establish what resources must be allocated, and what the constraints on them are. Typically this will include constraints on available funds, but may include constraints on staff, contractor capacity, equipment, materials, or other resources. Further, there may be other constraints relevant to the process, such as constraints to distribute funds equitably between different regions or areas, or constraints on exactly how certain resources can be used.
- Quantify Targets. Translate goals and objectives into specific criteria for supporting allocation decisions. Where feasible, define performance measures that quantify the level of achievement. Set target values for key measures and establish a target level of service as discussed in Section 5.4.
- Allocate Resources. Split the budget and other resources to the set of program categories or types of work. The allocation specifies the distribution of resources between different categories or work types. The details of how this step is performed are dependent on the details of the resources being allocated, assets being analyzed, and types of investments under consideration.
- Prioritize Investments. Determine what specific investments to make given the overall allocation of resources. This determination may be made within an asset class, across asset classes or across asset management and other investment objectives (e.g. safety or mobility) depending on how the process is structured. The prioritization should maximize achievement of the organization’s goals and objectives as quantified using the measures and targets set in Step 3 subject to the constraints established in Step 4.
- Project Performance. Predict future performance given the assumed allocation and priorities, and compare the predicted performance to previously established targets. This may result in revisions to the constraints, targets or outcomes of other steps described above. To the extent that the targets are set for asset conditions, use the life cycle analysis methods described in Chapter 4 to predict future asset condition.
- Finalize Allocation and Plans. Once allocation is complete, document the resulting targets, projections and investment priorities and communicate these to stakeholders. Further work may be required following completion of the formal process, such as developing maintenance plans based on the set of approved projects.
Figure 5.1 The Resource Allocation Process
Factors Impacting the Resource Allocation Process
The specifics of how an organization can and should approach resource allocation depend upon a number of different factors. Understanding these factors is key in developing a successful approach to resource allocation.
Figure 5.2 Factors Impacting the Resource Allocation Process