Section 7.3
Asset Data Sharing, Reporting and Visualization
This section covers approaches to sharing, reporting and visualizing asset data to support agency decision making. It builds on the discussion of TAM Information Integration in section 7.1 and focuses on how to get value from the integrated data. This involves careful planning to define the needs of different users and design ways of delivering and sharing data to meet varying needs.
7.3.1
Designing Effective Reports and Visualizations
A wide variety of reports, maps, charts and infographics can be produced to convert raw data into actionable information. Designing effective reports and visualizations begins with a good understanding of who will be consuming the information, what their questions are, and what key messages the agency wants to communicate.
TAM Webinar #45 - TAM Communication and Visualization
Different types of information users for asset data and sample questions they may have are shown in Table 7.4. This can be used as a starting point for identifying what types of reports and visualizations should be created. Keep in mind that increasingly, reports and visualizations are not static – they include multiple options for filtering, sorting and navigating information.
Some reports/visualizations are primarily for analysis, exploration and insight; others are primarily for communication. Some may be designed for both purposes. Those designed for analysis should emphasize flexibility – with multiple options for viewing, filtering, sorting, and exporting to various formats. Those designed for communication should emphasize simplicity and clarity of message; and clean, aesthetically pleasing design. They should reflect what the agency wants people to learn or know.
All reports/visualizations should include information that helps the user to understand:
- the sources of the data being presented and the effective date for the data (e.g. what calendar year is represented)
- the assumptions used for any calculated items
- definitions of any acronyms or potentially unfamiliar terms
- who to contact for further information
A wide array of tools and techniques are available for reporting and visualization – tabular reports, maps, charts, dashboards, infographics, and combinations. GIS is an essential visualization tool with many applications and can be integral to information presentation. While some visualizations can be produced using standard office applications, many agencies use desktop publishing and business intelligence offerings. There are several general resources available on design of effective visualizations – see the reference list at the end of this chapter. Chapter 6 contains additional examples of data visualizations.
Table 7.4 Information Needs of Different Users
| User Type | Sample Questions | Types of Reports/Visualizations |
|---|---|---|
| Analyst | Are the asset locations in this new inventory valid? | Map showing asset locations Report listing asset locations outside of the ranges of valid route-milepoint/mileposts. |
| Analyst | Are the observed changes in asset condition from the last inspection reasonable? | Time series plot/grid of asset condition + intervening project/maintenance activities |
| Analyst | What is the expected service life for asset X? What are the key factors impacting service life? | Minimum, maximum, mean, median life for selected asset type – with breakdowns by subtype (e.g. concrete versus asphalt pavement), last treatment, geographic region, road class. Map of assets with low (e.g. 25th percentile) lives with available information on contributing factors (e.g. reported drainage issues, soil quality, materials, contractor, use of road salt, etc.) |
| Asset/Maintenance Manager | What is the state of my asset(s)? | Fact sheet showing inventory, condition distribu- tion, age distribution, value, performance projec- tions and targets (if applicable) |
| Asset/Maintenance Manager | Which assets should be considered for treatment? | Map and listing of assets showing condition information and (if available) assigned treatment need – overlaid with programmed work. Drill down to condition and work detail. |
| Asset/Maintenance Manager | What should I budget for preventive maintenance? | Report showing asset quantities, unit cost for preventive maintenance, planned maintenance interval, and average annual cost over 5 year period. Separate report to inform selection of a unit cost – historical cost per unit of work or historical labor/ equipment/materials utilization per unit of work. |
| Project Engineer | What assets are within the footprint of a project I am scoping? | Listing of assets and associated quantities for a defined location (route/from MP, to MP) |
| Project Engineer | Are there opportunities to coordinate work? | Map showing identified needs, proposed projects, programmed projects. |
| Executive | What have we been spending to maintain our assets? | Time series chart showing expenditures with breakdown by asset type, work type (maintenance versus capital), district/region. Display asset quantities and conditions on same time scale to compare expenditures against results. |
| Executive | What is our backlog of needs? | Chart showing current needs backlog for selected assets – with available breakdowns by district/ region, road class, asset type. Accompanying chart showing 5-10 year changes in backlog and projected backlog given revenue and funding allocation assumptions. |
| Executive | How do asset conditions compare across districts/regions? | Infographic showing asset condition (Good-Fair-Poor) bar charts superimposed on map of districts/regions. |
| Executive | How should we allocate our available funding across different assets/ projects? | Charts showing results of investment versus performance analysis Charts showing allocation and performance results of a prioritization exercise with drill down to prioritized project lists. |
| Funding/Oversight Agency (State/Federal) | How does the current and projected asset condition compare to the established target? | Trend line showing current and projected conditions under different funding scenarios with separate line for target. |
| Funding/Oversight Agency (State/Federal) | How do the actual pavement and bridge program accomplishments compare to those that were planned? | Chart showing planned, actual, percent difference and explanation. |
| General Public | When will my street be paved? When will the bridge replacement project be completed? How is the DOT using its funding? | Map showing programmed projects with status/ schedule/funding information |
Connecticut DOT
To complement the Connecticut TAMP, Connecticut DOT (CTDOT) developed a series of asset Fact Sheets providing at-a-glance summaries of asset inventory and condition, State of Good Repair definitions, performance projections, targets and asset valuation for bridges, pavements, and five additional assets included in the TAMP. The asset Fact Sheets pair simplified graphs and other information displays with supporting contextual detail; a format that helps communicate CTDOT’s TAM approach to policy makers, executives, and other non-technical stakeholders.
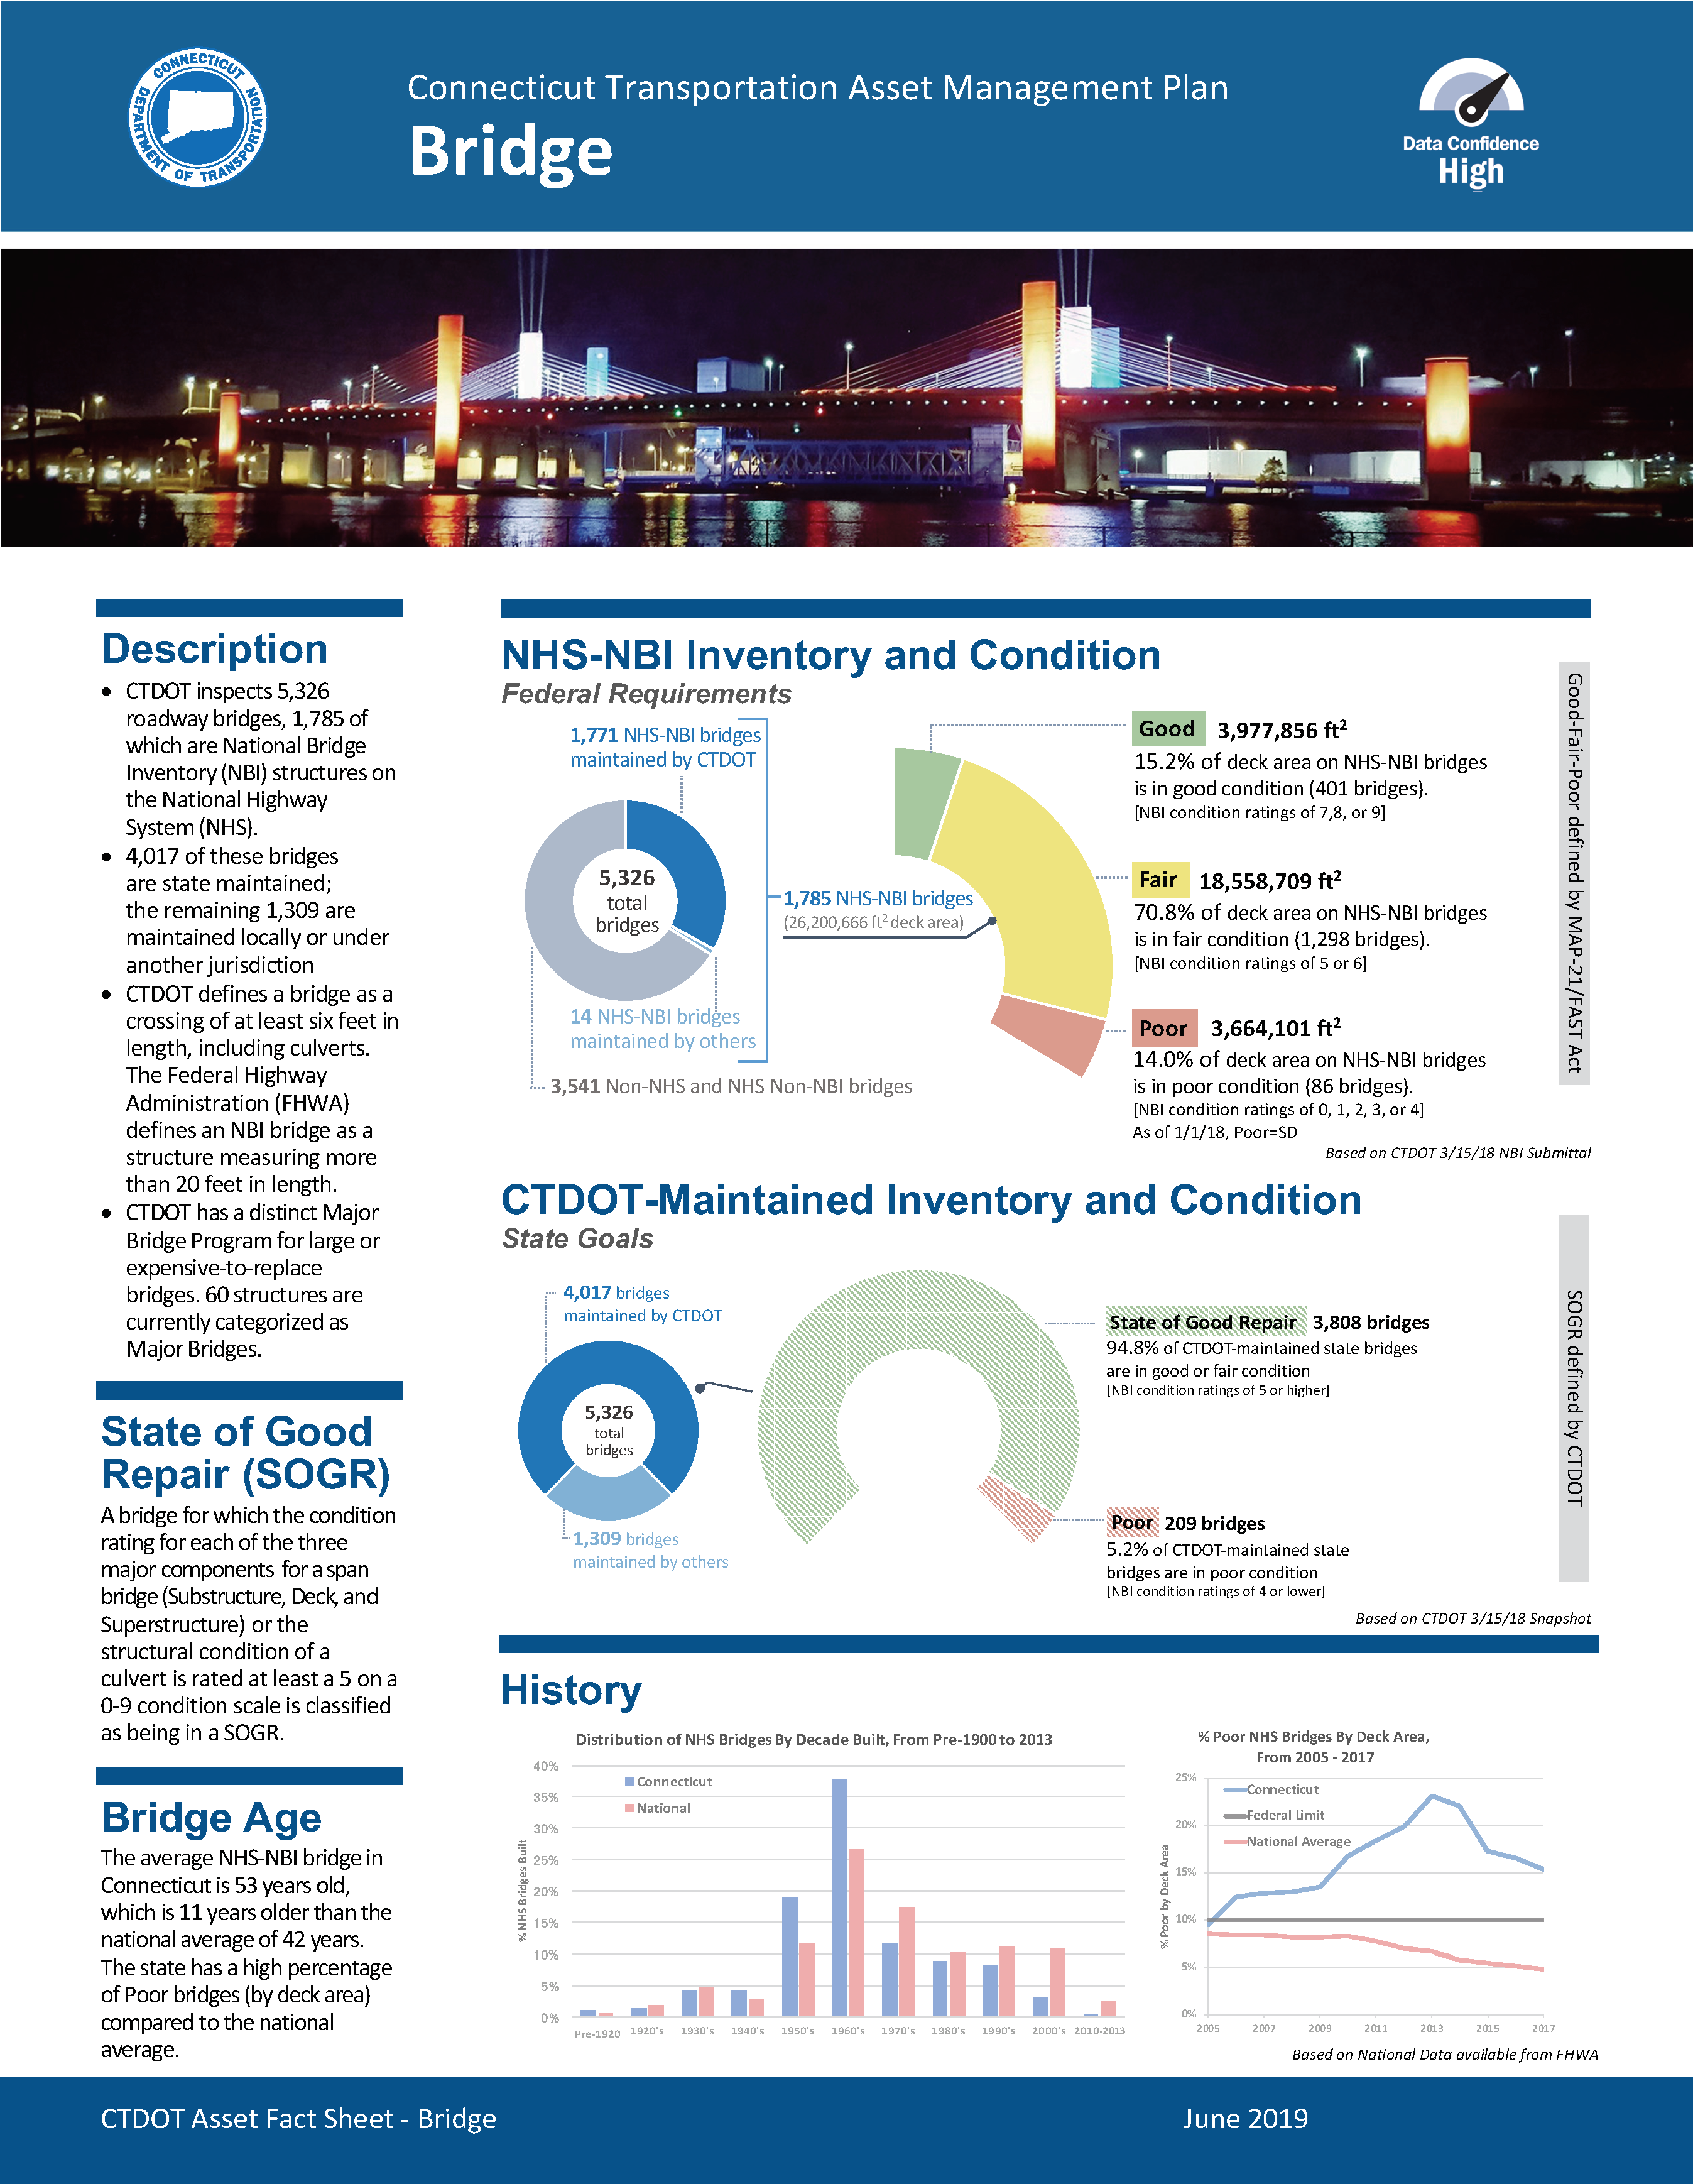
Source: Connecticut DOT. 2018. Asset Fact Sheet.
7.3.2
Data Sharing
There are many different ways to share information about assets, condition, performance, needs, and work. Agencies can select multiple distribution channels to serve both internal and external users.
As with the design of reports and visualizations, designing a data sharing strategy should begin with an understanding of the different audiences for data and their needs. A variety of options for data sharing are available that can be employed. Table 7.5 outlines some of these options and suggests some questions to consider in selecting an appropriate option.
It is helpful to establish guiding principles for data sharing in order to achieve a consistent agency approach that provides maximum benefits in a cost-effective manner. Possible principles include:
- By default, data should be shared unless it is sensitive, protected by law or if sharing it would pose unacceptable risks or cost burdens
- Self-service methods of data sharing should be used when there is a relatively large pool of data users and data limitations can be readily communicated via standard metadata
- Avoid proliferation of single purpose data sharing applications by adopting standard platforms where multiple data sets can be shared
- When it is necessary to share the same data set through multiple channels, the source data should be stored in a single location or a single data refresh process should be used to reflect updates
- The process of preparing data for sharing, reporting and visualization should be governed to ensure quality, ensure adequate documentation, and avoid inconsistency
Table 7.5 Data Sharing Options
| Data Sharing Option | Most appropriate for... | Considerations |
|---|---|---|
| On request | Internal or external data users | Use for uncommon, specialized requests requiring moderate to extensive effort to fulfill or where there is high potential for information misinterpretation or mis-use For common information needs, use other methods to reduce staff time spent on fulfilling information requests. |
| Direct access to specialized asset management system (e.g. for pavement, bridges, culverts, etc.) | Asset and maintenance specialists in the central office and field offices | Helpful features include: ability to provide view-only privileges and ability to provide filtered views of information (e.g. restrict to a single district) |
| Direct access to enterprise asset management system (with information about multiple assets) | Agency staff Partner agency staff (e.g. MPOs, localities) | For partner agency access, ability to provide access outside of the agency firewall is needed. |
| Enterprise GIS with spatial open data portal | Internal or external data users | It is best to design separate maps geared to specific user types May want to separate internal and external portals or restrict some specialized maps for internal use. |
| General open data portal | Internal or external data users | Consider using available federal and state-level open data portals May want to separate internal and external portals or restrict some specialized maps for internal use. |
| Data feeds/data services/Automated Programming Interfaces (APIs) | Internal or external data users | Most suitable for real time data sets, data sets that are frequently updated, and complex data sets where flexible querying options are needed. |
| Data warehouse/data mart | Agency staff | Use to create a cleansed and standardized data source for reporting/business intelligence. Particularly helpful when historical/time series data is required, and direct access to data from source systems is problematic due to data quality, consistency or performance concerns. Tabular data within the Data Warehouse can be joined with spatial data, as needed, within the Enterprise GIS. |
| Data lake | Agency data analysts/data scientists | Use to provide access to a heterogeneous collection of data including “big data” and unstructured data for research, modeling and analysis. |
| Content management system | Agency staff and partners (e.g. contractors) | Use to provide access to a curated collection of content including engineering design drawings, asset maintenance manuals, contracts, etc. |
| Common data environment (CDE) | Agency staff and partners (e.g. contractors) | Use to provide a shared information repository for a construction project. CDEs typically include document management, collaboration and workflow features. CDE is one of the key elements of BIM practice defined by the UK’s Construction Industry Council. |
DC DOT
Washington, DC has established four levels of data. By default, data is considered to be open and shareable.
- Level 0. Open (the default classification)
- Level 1. Public, Not Proactively Released (due to potential litigation risk or administrative
burden) - Level 2. For District Government Use (exempt from the Freedom of Information Act but not
confidential and of value within the agency) - Level 3. Confidential (sensitive or restricted from disclosure)
- Level 4. Restricted Confidential (unauthorized disclosure can result in major damage or injury)
VTrans
VTrans shares their data with the public through the VTransparency Public Information Portal. The goal of the portal is to “turn data into useful information for our customers” and to “create tools for getting answers to some of the questions we get most often”. The VTransparency Portal features different tools for viewing specific data. These tools include:
- Projects Map
- Road Conditions
- Plow Finder
- Weather Cams
- Maintenance Districts
- Crash Fatality Report
- Crash Query Tool
- Find a Project
- Daily Traffic
- Highway Closures
- Bridge Inspections
- Pavement Conditions
- Pavement Performance
- Maintenance Work
- Rail Asset Inventory
- Rail Bridge Inspections
- Rail Clearance
- Rail X-ing Inspections
The VTransparency Portal also links to the Vermont Open GeoData Portal. This provides GIS map layers related to the various tools for people interested in doing their own analysis of VTrans data. VTrans holds to the principle of making data available by default unless it is sensitive. The agency values transparency with the public and welcomes feedback on the tools they’ve developed. The VTransparency Portal can be accessed at https://vtrans.vermont.gov/vtransparency
7.3.3
Preparing Data for Sharing, Reporting and Visualization
Establishing a standard process to prepare data for sharing, reporting and visualization can make sure that data is publication-ready: quality checked, tested and documented.
A standard data preparation process should be used before moving data to any official reporting source – whether it is a data warehouse, a geodatabase, or a file uploaded to an open data portal.
A data preparation process might use the following checklist:
- Is the data derived from a designated authoritative source system?
- Have data quality checks been applied?
- Has metadata for the data set been prepared, including explanation of the data source, date of last update?
- Is an individual or business unit identified for data users to contact for further information?
- Is an individual or business unit identified for reporting database or system managers to contact regarding any issues that arise?
- Has metadata for the data elements included been prepared (data dictionary)?
- Has the metadata been reviewed for completeness and quality?
- Has a data owner or steward signed off on the data publication?
Ohio DOT
Data-driven decision making can be defined as:
“An approach to business governance or operations which values decisions supported with verifiable data. The success of the data-driven approach is reliant upon the quality of the data gathered and the effectiveness of its analysis and interpretation”
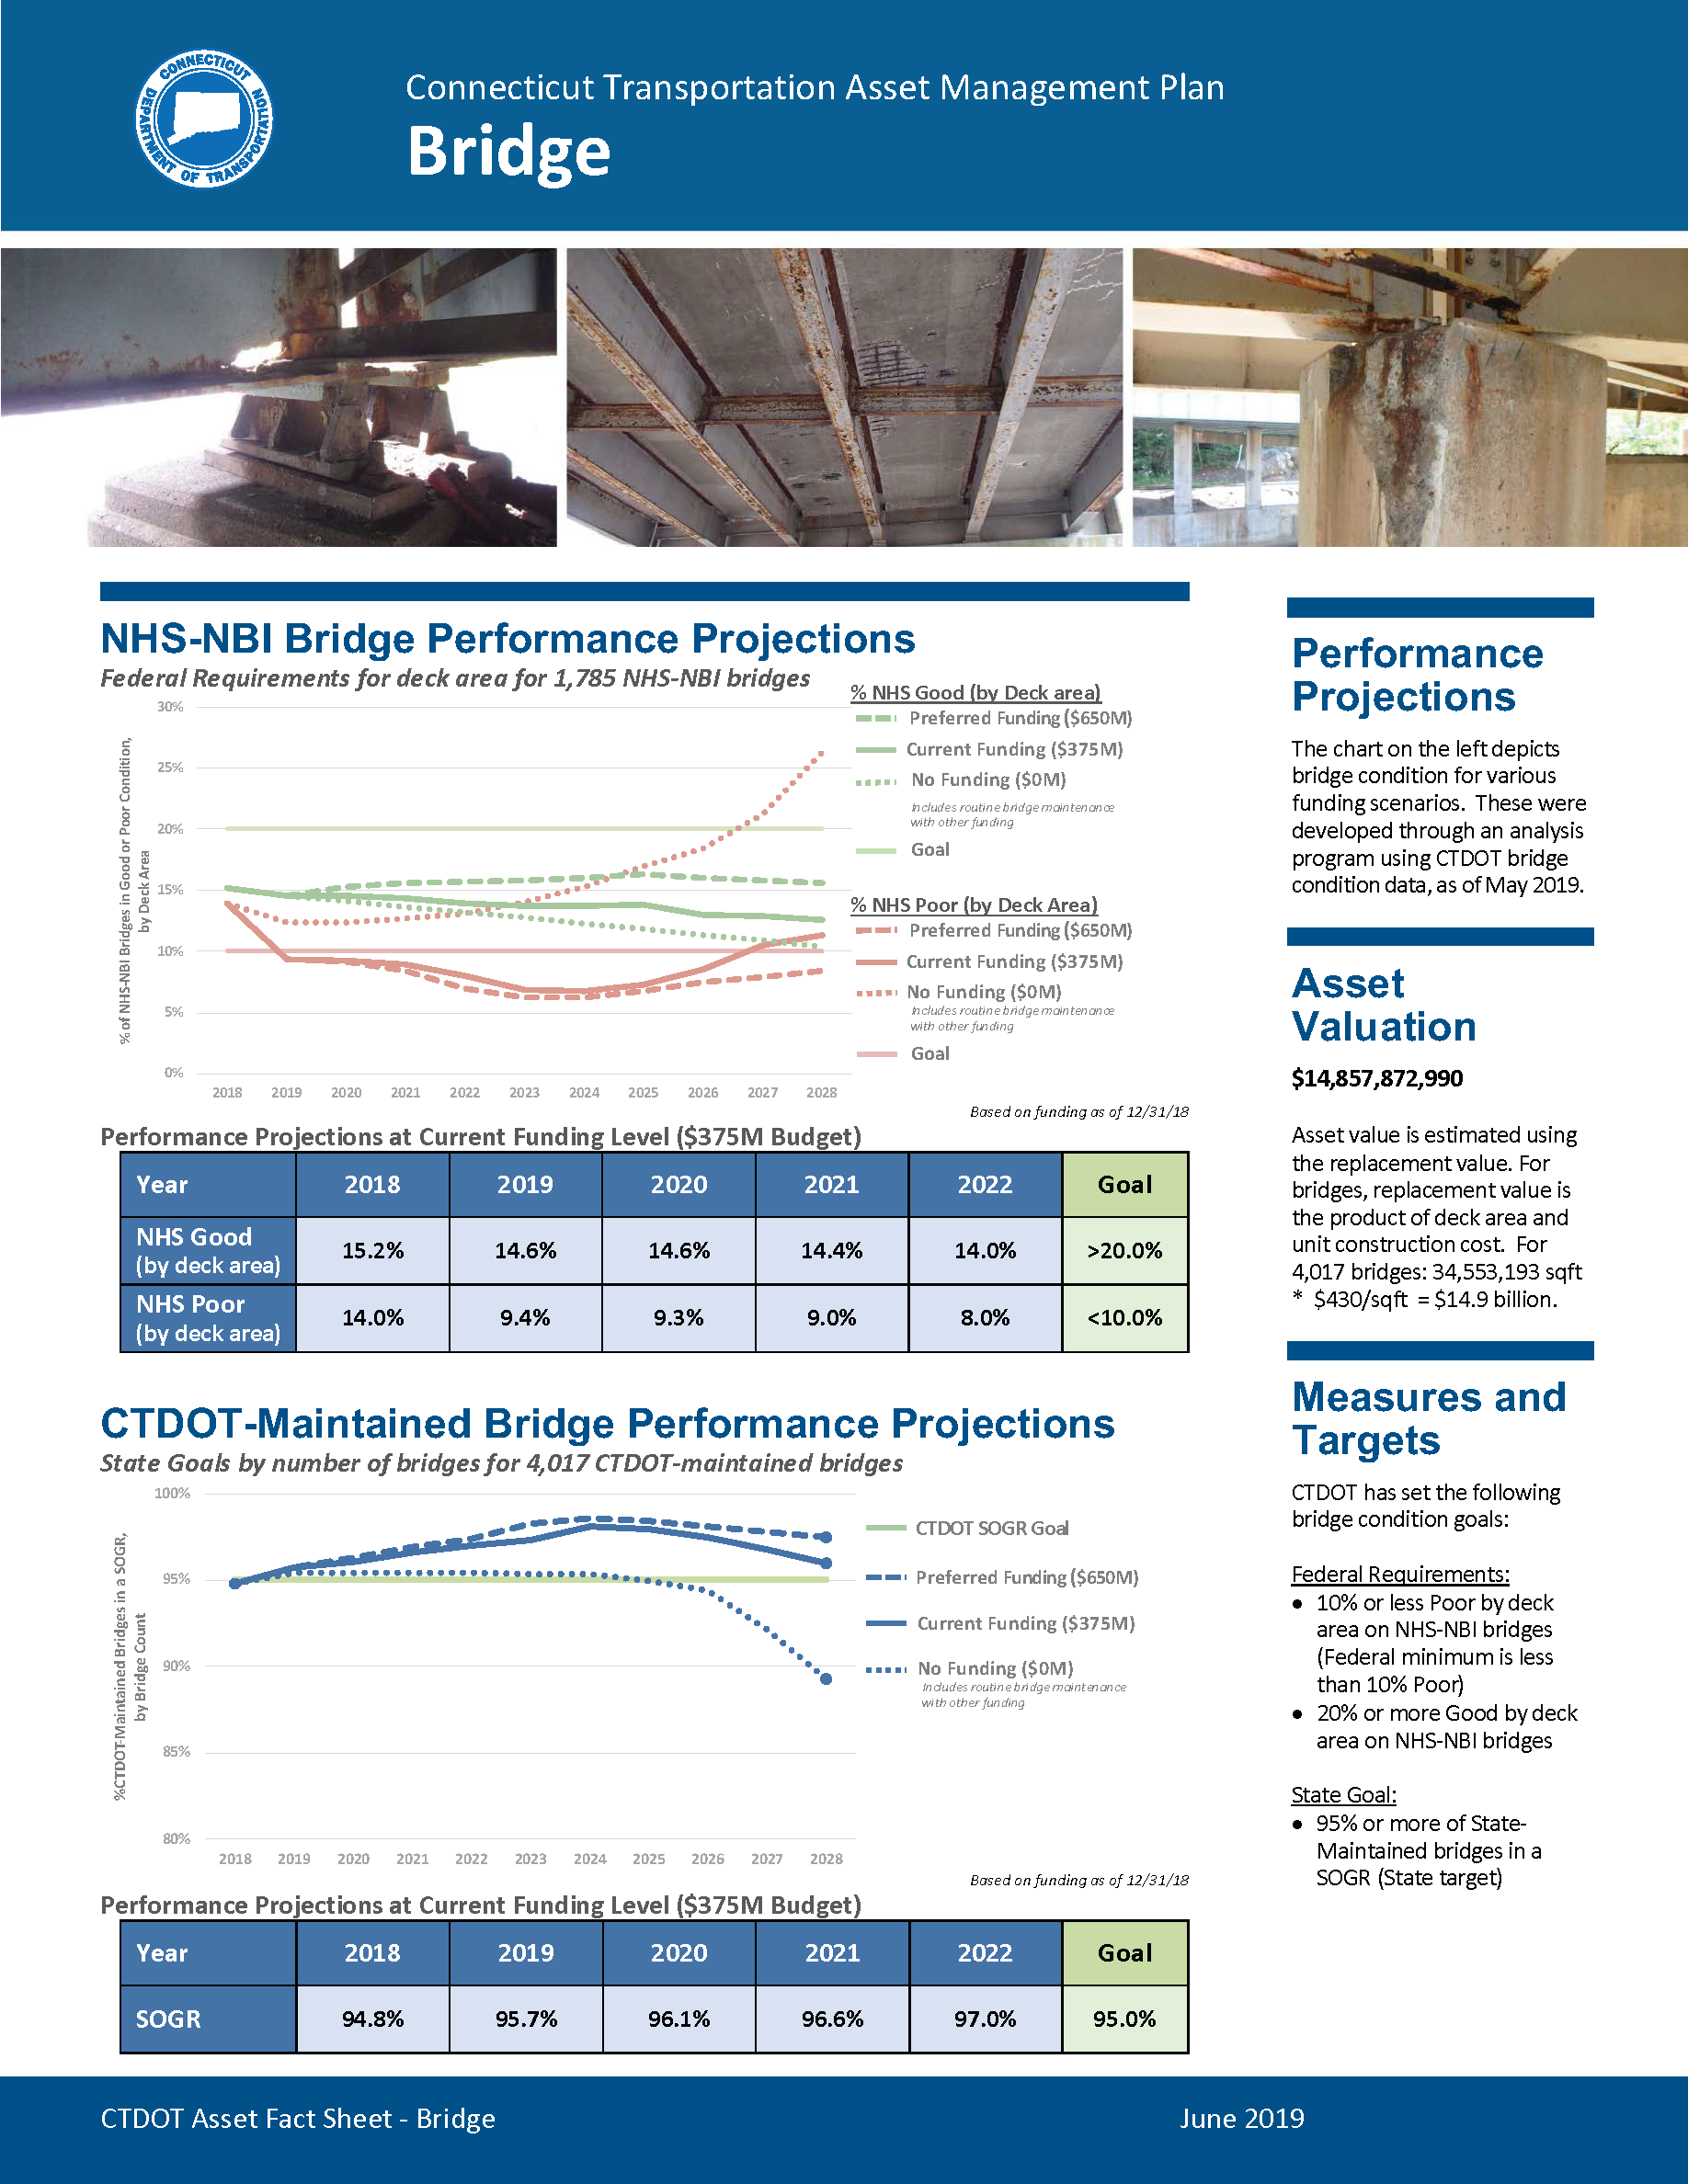
Connecticut DOT
To complement the Connecticut TAMP, Connecticut DOT (CTDOT) developed a series of asset Fact Sheets providing at-a-glance summaries of asset inventory and condition, State of Good Repair definitions, performance projections, targets and asset valuation for bridges, pavements, and five additional assets included in the TAMP. The asset Fact Sheets pair simplified graphs and other information displays with supporting contextual detail; a format that helps communicate CTDOT’s TAM approach to policy makers, executives, and other non-technical stakeholders.
Source: Connecticut DOT. 2018. Asset Fact Sheet.
DC DOT
Washington, DC has established four levels of data. By default, data is considered to be open and shareable.
- Level 0. Open (the default classification)
- Level 1. Public, Not Proactively Released (due to potential litigation risk or administrative
burden) - Level 2. For District Government Use (exempt from the Freedom of Information Act but not
confidential and of value within the agency) - Level 3. Confidential (sensitive or restricted from disclosure)
- Level 4. Restricted Confidential (unauthorized disclosure can result in major damage or injury)
VTrans
VTrans shares their data with the public through the VTransparency Public Information Portal. The goal of the portal is to “turn data into useful information for our customers” and to “create tools for getting answers to some of the questions we get most often”. The VTransparency Portal features different tools for viewing specific data. These tools include:
- Projects Map
- Road Conditions
- Plow Finder
- Weather Cams
- Maintenance Districts
- Crash Fatality Report
- Crash Query Tool
- Find a Project
- Daily Traffic
- Highway Closures
- Bridge Inspections
- Pavement Conditions
- Pavement Performance
- Maintenance Work
- Rail Asset Inventory
- Rail Bridge Inspections
- Rail Clearance
- Rail X-ing Inspections
The VTransparency Portal also links to the Vermont Open GeoData Portal. This provides GIS map layers related to the various tools for people interested in doing their own analysis of VTrans data. VTrans holds to the principle of making data available by default unless it is sensitive. The agency values transparency with the public and welcomes feedback on the tools they’ve developed. The VTransparency Portal can be accessed at https://vtrans.vermont.gov/vtransparency
Ohio DOT
Data-driven decision making can be defined as:
“An approach to business governance or operations which values decisions supported with verifiable data. The success of the data-driven approach is reliant upon the quality of the data gathered and the effectiveness of its analysis and interpretation”