Section 2.2
TAM Integration
An integrated view of TAM is critical to its advancement within an agency. Integration ensures TAM is linked to other existing business processes within the agency. Integrated planning considers the life cycle of an asset comprising the “cradle-to-grave” approach. Understanding each phase of the life cycle requires coordination between planning, design and operations teams. Understanding each phase of the life cycle requires coordination between planning, design and operations teams.
2.2.1
Planning and Programming
Linking and aligning asset management with planning and programming activities helps strengthen an agency's delivery of projects. Planning and programming processes set strategic direction and resource allocation practices; TAM helps set priorities and encourages data-driven, performance-based decision-making.
Using the TAMP Approach to Look at Demand Scenarios
Planning is the process of setting strategic direction through goals and objectives, then performing analysis to identify trends, strategies, and long-term investment priorities. Planning answers the questions of where to go and how to get there. Programming involves allocating resources in order to determine a program of projects the agency will pursue. Planning and programming are central to the work of any transportation agency. Integrating TAM into the planning and programming process will only strengthen and sustain the practices involved in both areas.
Developing the Long-Range Transportation Plan (LRTP) and the Statewide Transportation Improvement Plan (STIP) are two planning activities where the integration of TAM is especially relevant.
TAM principles, data and tools can help shape the LRTP and STIP by:
- Linking agency resource allocation to policy objectives.
- Defining the performance targets to be achieved.
- Identifying strategic investment choices and evaluating and analyzing tradeoffs among them at the appropriate stages.
- Providing the information and analyses to facilitate the appropriate resource allocation decisions that follow good TAM practice.
Integrating TAM approaches with planning and programming goes beyond informing and shaping the activities. Communication and coordination between activities and the people involved in them is important as well. Both planning and TAM require an understanding of the life cycle of an asset. This requires coordination with operations teams to communicate how decisions impact the expected useful life of the asset. Operations teams also need to be aware of the asset management planning horizon, performance measures and targets. These teams need to ensure the capital plan has been accounted for in the maintenance and operational plans. In addition, since planning is a network-level endeavor, teams managing each of the different asset types need to communicate with one another and coordinate with planning.
The following are some key questions to ask when considering the integration of TAM with planning and programming.
- Is the cost of maintenance and operations taken into account in the decision-making process to select capital projects?
- Are there mechanisms to directly evaluate tradeoffs between capital investment and operations and maintenance implications within the planning process?
- Are the needs and implications associated with connected and autonomous vehicles considered in the asset management plan?
- Are future risks such as climate change fully integrated into the capital planning process (rehabilitations, renewal, service level upgrades, etc.)? Is scenario planning used to assess the risk effects of system wide external changes?
TIP
TAM practice is most effective when linked to planning and programming activities; this is one way to ensure that TAM principles are implemented into agency decision making.
The FHWA Asset Management Financial Report Series, Report 4 Integrating Financial Plans into the Planning, Programming, and Budgeting Processes describes the importance of integrating planning, programming, and budgeting with asset management.
The relative timeframes of various planning and programming activities is shown in Figure 2.2.
Figure 2.2 The Relative Timeframes Between Plans
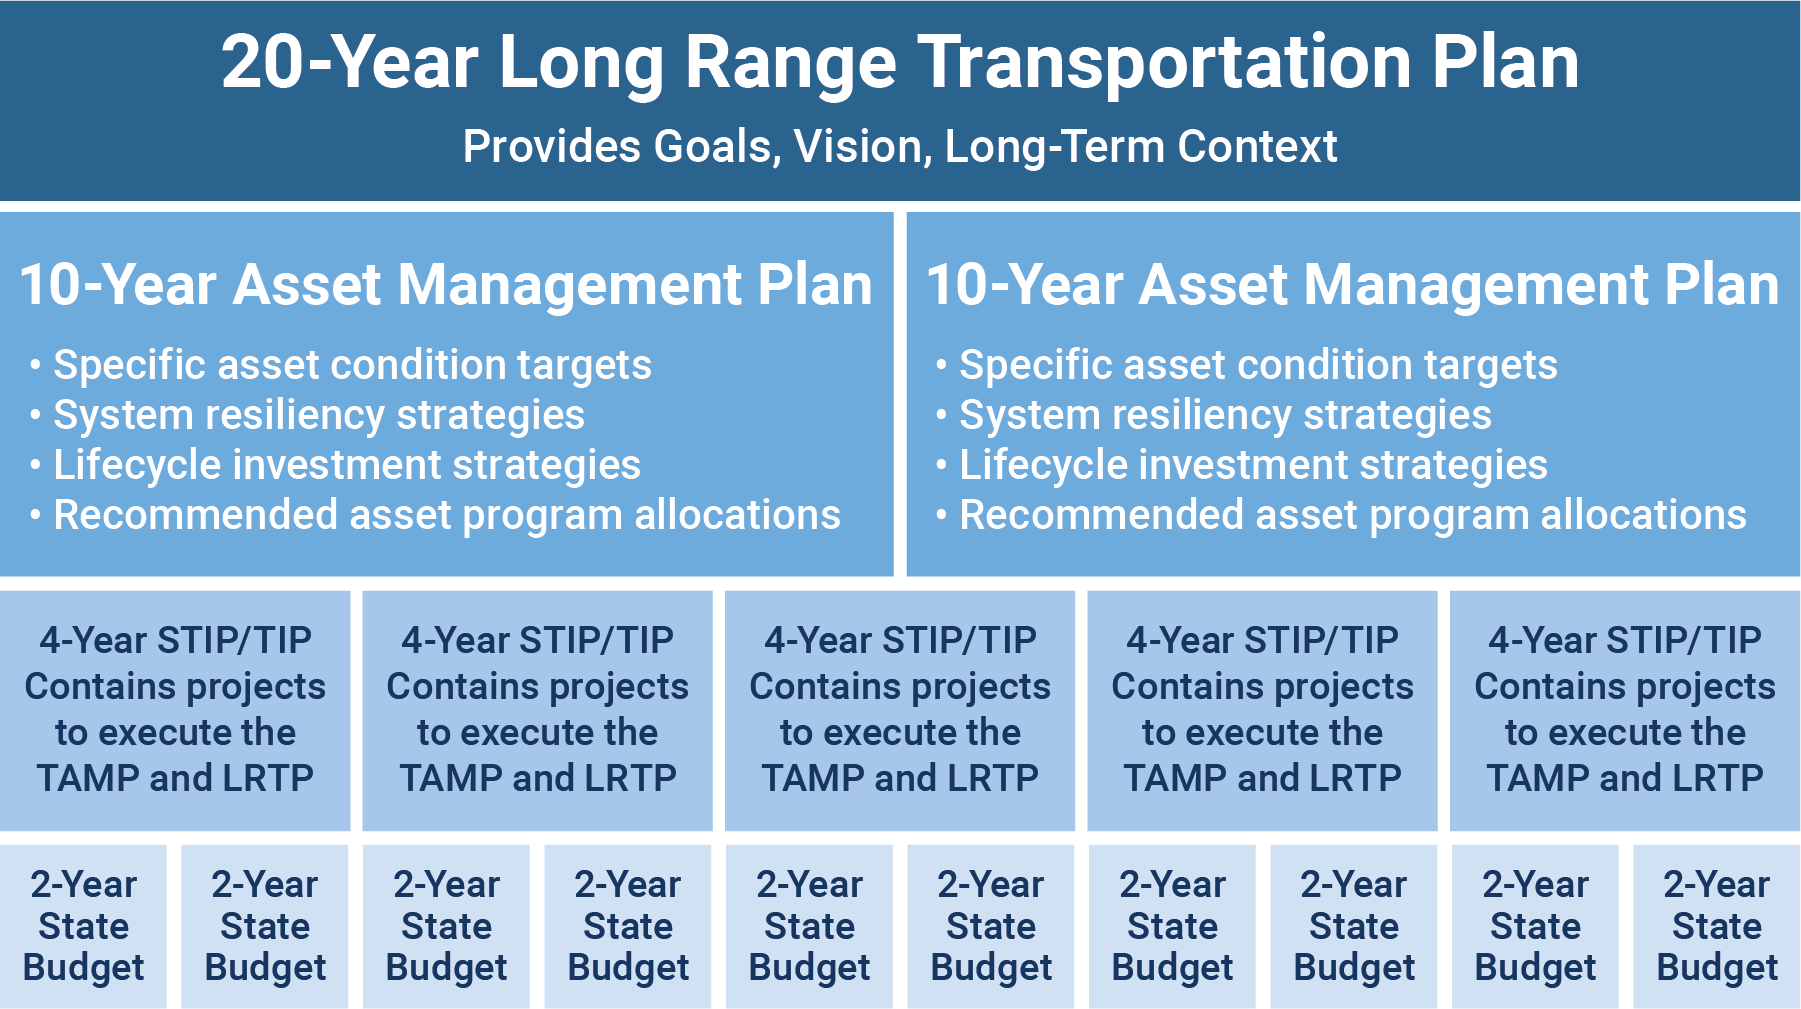
Long-range plans, asset management plans, TIPs, and state budgets should be aligned.
Source: FHWA, 2017. https://www.fhwa.dot.gov/asset/plans/financial/hif16001.pdf
TIP
Involving internal and external stakeholders in the TAM process early can encourage or enhance their buy-in when the time comes to make important decisions.
Montana DOT
When developing their 2018 TAMP MDT aligned their pavement performance targets and goals to those within their planning document TranPlan 21 (now TranPlanMT). TranPlanMT defines MDT's policy direction for operating, preserving, and improving Montana’s transportation system over a 20-year period. It serves as the guiding document for MDT decisions, especially those related to investing Montana’s limited transportation funds. This type of alignment can help illustrate a link from policy objectives to investment strategies and resource allocation.
Sources:
Video Overview of Planning TAM
Integrating TAM Into the Planning Process
The FHWA TAM Expert Task Group produced the following video to explain how to integrate TAM into the transportation planning process.
2.2.2
Performance Management
Asset management utilizes performance management to set objectives, define measures, establish targets, and monitor results. Transportation Performance Management (TPM) relies on the TAM principles and process to help achieve the agency's broader goals and objectives.
Relationship to Federal TPM Activities
The MAP-21 Act (2012) established a performance-based program intended to focus Federal Aid highway program and public transportation system (e.g., bus, light rail, and ferry) investments on national transportation goals. It was also intended to increase accountability and transparency in the use of federal transportation funds, as well as improve project decision-making through the strategic use of system performance information. The performance-based provisions of MAP-21 were retained in the FAST Act in 2015.
TPM is defined by FHWA as a strategic approach to making investment and policy decisions to achieve national performance goals using system information in accordance with rules established by the Department of Transportation (see Figure 2.3). The FHWA recognizes asset management as the application of TPM to manage the condition of infrastructure assets needed to provide for mobility and safety in the nation’s transportation system. In short, the FHWA refers to asset management as the engine driving infrastructure performance.
Figure 2.3 FHWA's Strategic Approach to TPM
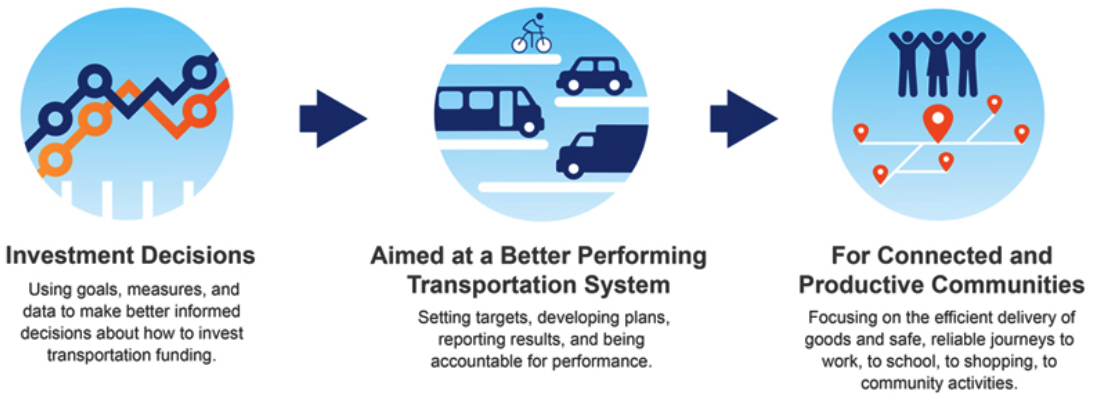
Source: FHWA TPM Homepage. 2019 https://www.fhwa.dot.gov/tpm/
Asset management plans document the processes and investment strategies developed by an agency to manage its infrastructure assets. These asset management plans support an agency’s performance-based planning and programming processes for making long-term investment decisions and feed shorter-term project and treatment selection activities. Together, these activities ensure the investment decisions of an agency are aligned with performance objectives and goals.
TPM Regulations
The TPM provisions for highways included in federal law are implemented in accordance with rulemakings organized around the following six elements:
- National goals – focusing the Federal Aid highway program on the seven areas listed below:
- Congestion reduction
- System reliability
- Environmental sustainability
- Freight and economic vitality
- Infrastructure condition
- Reduced project delivery delays
- Safety
- Measures – assessing performance or condition in carrying out the TPM-based Federal Aid highway program
- Targets – funding recipients are required to document future performance expectations under a fiscally-constrained environment
- Plans – identifying strategies and investments for addressing performance needs
- Reports – documenting progress toward target achievement and investment effectiveness
- Accountability and transparency – requiring federal funding recipients to achieve or make significant progress toward targets
TPM Relationship with TAM
There is a close relationship between TPM and TAM, since both consider asset and system performance, risks and available resources to achieve desired objectives over time. Both rely on a strategic approach, using data to make investment and policy decisions in order to achieve performance objectives. Internationally, there is less distinction between asset management and performance management, with the IAM defining asset management as encompassing the “balancing of cost, opportunities and risks against the desired performance of assets to achieve the organizational objectives.” In the United States, TAM applies to the technical and financial decisions, plans and actions related to physical infrastructure, while TPM considers a broad range of system performance categories.
A graphic illustrating the integration of asset management and performance management is provided in Figure 2-4. In the figure, the circle on the left represents the interconnection of the various performance areas that transportation agencies are concerned with throughout their planning processes. Flowing into the performance circle is the asset management circle, representing an agency’s infrastructure needs to support system performance.
The FHWA’s Expert Task Group (ETG) published a white paper explaining the relationship between asset management and performance management. It acknowledges the performance of a transportation system is dependent on many factors, including operational characteristics, and system usage and demand, in addition to the physical condition of the infrastructure assets. The paper explains that “performance management focuses on how policies, resource allocation, and other decisions affect all aspects of system performance including safety, operations, environmental stewardship, and infrastructure condition.” (FHWA 2019) Asset management is described as an application of performance management principles with a long-term focus to manage the performance of infrastructure assets, the resources allocated to operate a transportation system, and the investments made to achieve the agency’s long-term goals and objectives.
Figure 2.4 Integration of Performance Management and TAM
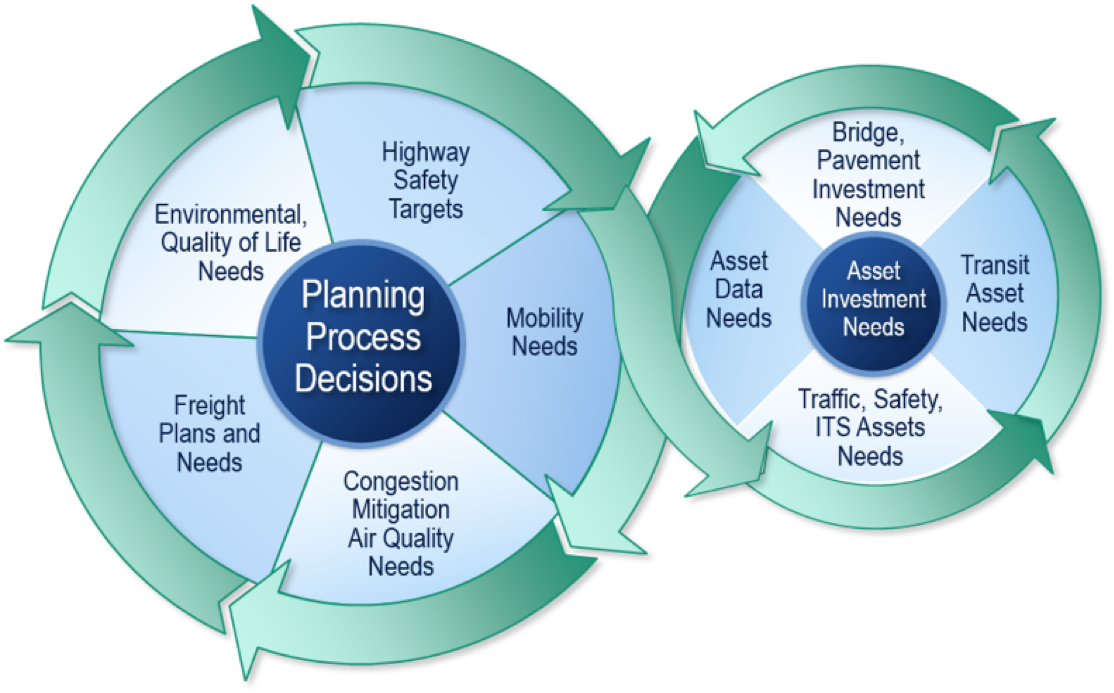
Source: NHI 136106A, Introduction to Transportation Asset Management. 2019
British Columbia
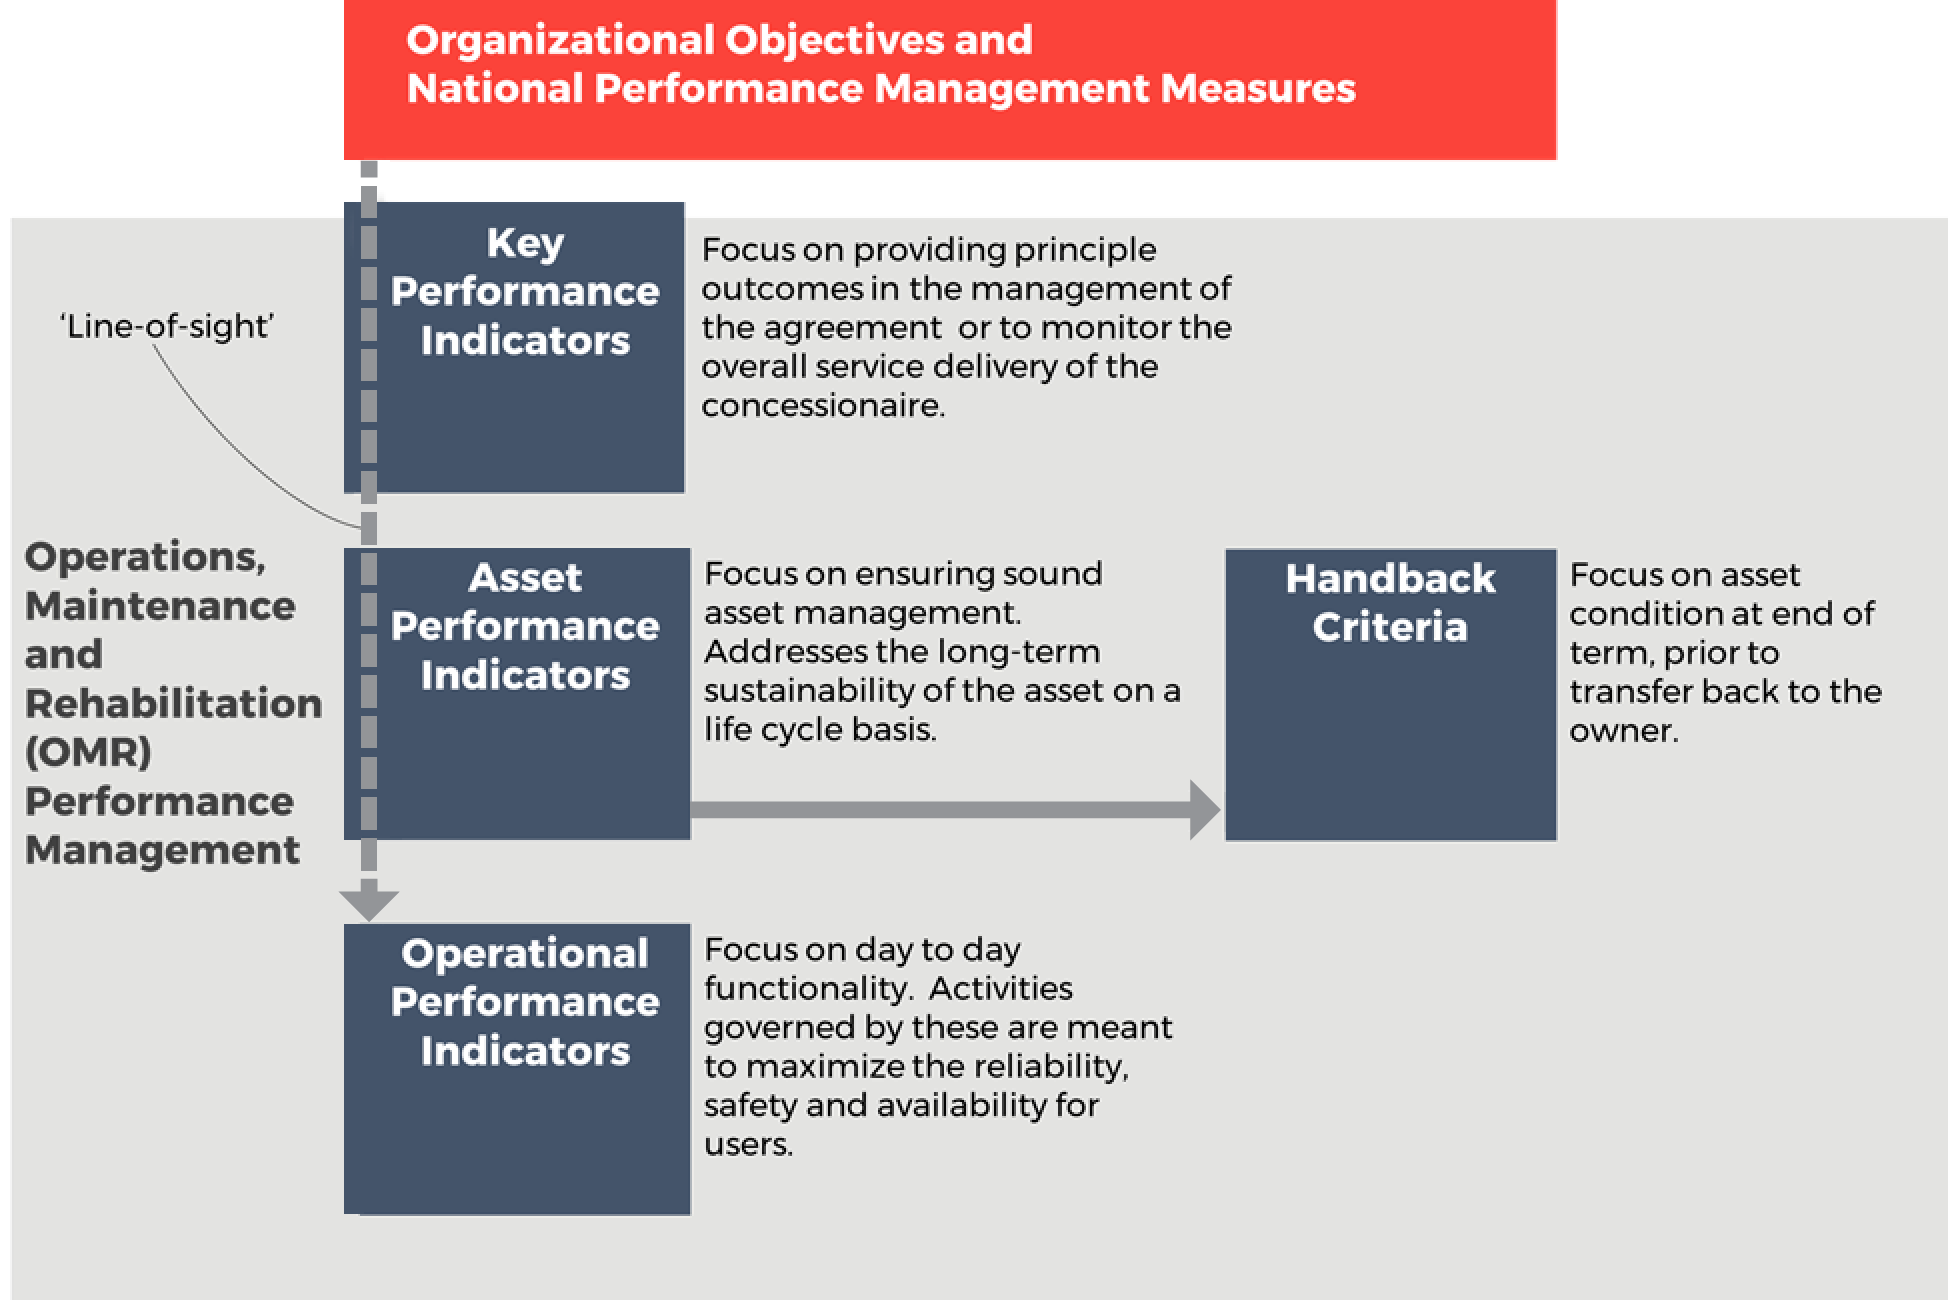
To support the alignment of agency policies, objectives and day-to-day practices, the Province of British Columbia established the tiered structure shown in Figure 2.5 for a design-build-finance-operate project. The highest of the three levels, Key Performance Measures, defines the high-level outcomes for service delivery in terms of a few key strategic areas. The second level, Asset Preservation Performance Measures, defines the minimum acceptable condition levels for each of the individual assets to preserve their value. The third level, Operational Performance Measures, corresponds to the many specific requirements for operating and maintaining the highway in a safe manner on a day-to-day basis. The tiered approach helped align stakeholders at all levels and clarified priorities for all parties.
Performance Management Framework
To support the alignment of agency policies, objectives and day-to-day practices, agencies may establish a tiered performance management framework, such as the example illustrated below for a model Design-Build-Finance-Maintain-Operate (DBFMO) project (Figure 2.5). The highest of the three levels, Key Performance Measures, defines the high-level outcomes for service delivery in terms of a few key strategic areas. The second level, Asset Preservation Performance Measures, defines the minimum acceptable condition levels for each of the individual assets to preserve their value. The third level, Operational Performance Measures, corresponds to the many specific requirements for operating and maintaining the highway in a safe manner on a day-to-day basis.
Further discussion on Performance Management Frameworks, defining Performance Measures and Performance Targets is included in Chapter 6.
Figure 2.5 Typical Performance Management Framework used in a DBFMO Project
For the transit community, TCRP Research Report 198 presents a framework for developing relationships between service quality and asset conditions, using a variety of transit system performance and customer satisfaction attributes. The research conducted in developing the report found many correlations between asset condition and performance, as noted below (Spy Pond Partners, et.al, 2018).
- Asset condition is related to the quality attributes of Frequency, Reliability, and Travel Speeds. As assets decline in condition, failures become more likely, reducing frequency, reliability, and average speeds.
- Asset condition is related to Appearance/Aesthetics in that customer perceptions of this factor are likely to be worse when assets are in poor condition and/or are technically obsolescent.
- Asset condition is related to other service quality attributes, including Comfort, Ease of Access, Environmental Impact, Information, Safety, and Security. For these attributes, increasing asset failures may affect quality, although the effects may be difficult to model. For instance, reduced service frequency resulting from increased failures can lead to greater crowding and less comfort. A particularly challenging area is safety. Given that operating severely deteriorated assets could compromise safety, in theory and in general practice, transit agencies establish thresholds for safe operations and remove an asset from service, rather than operating unsafely. Thus, potential safety issues tend to become operational issues, rather than actual safety issues. Regardless, customer perceptions are likely to be worse when assets are in poor condition for these factors, as in the case of Appearance/Aesthetics.
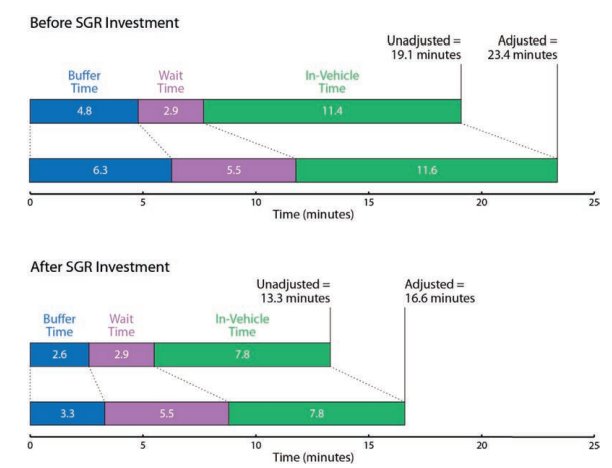
In one example, the impact of State of Good Repair (SGR) investment on the calculation of Effective Journey Time (EJT) is demonstrated. The example illustrates the differences in the calculated unadjusted and adjusted journey time, both before and after SGR investment, for a hypothetical rail line. Although the calculation is not based on actual data, it is intended to show that, after a SGR investment, both the adjusted and unadjusted journey times decrease. Before investment, the actual journey time for all components is 19.1 minutes, increasing to 23.4 minutes when adjustment factors are included. Following an investment in improved vehicles and track, these journey times decrease to 13.3 and 16.6 minutes. Looking closer at the components of time that change in this example, the decrease in buffer time after SGR investment indicates that travel times are more reliable and passengers do not have to build in as much buffer when planning their trips. Overall, in this example, SGR investments reduce EJT an average of 6.8 minutes per trip. This savings can be multiplied by an average value of time and number of trips per year to yield a prediction of the annual user benefit resulting from the investment. The results can be used in a variety of ways to analyze asset conditions and service quality.
Figure 2.5-B Comparing Adjusted and Unadjusted SGR Investment
Minnesota DOT
The Minnesota DOT’s performance management system consists of clear policies, performance trend data and performance forecasts to guide investments and operational decisions. The system is designed to (http://www.dot.state.mn.us/measures/):
- Address stakeholders’ desire for accountability and transparency
- Provide more informed decision-making and solutions to increasing challenges
- Enhance customer-responsiveness
- Ensure compliance with legislators' mandates
- Improve internal management
- Facilitate refinement of programs and services
- Set benchmarks for comparison of results
MnDOT uses performance criteria to guide capital investments and annual operational budgets. Transportation system and agency performance reports are regularly reviewed by MnDOT management. The ongoing measurement and review process assists MnDOT in evaluating the efficiency of service delivery and assessing the effectiveness of program activities. This objective-based approach increases transparency, and encourages innovation by keeping the focus on outcomes.
The accountability and transparency provided by MnDOT’s performance management system has contributed to MnDOT’s reputation among elected officials as a trusted partner in addressing challenging issues.
Accountability and transparency are a foundation of success for public agencies. The benefit is increased trust. This can help elected officials view MnDOT as a trusted partner and work together on challenging issues. Confidence in agency decision-processes and results is important to legislators considering new investments.
2.2.3
Risk Management
Managing transportation assets entails managing risk. This includes day-to-day concerns, such as addressing the risk that assets will deteriorate faster than expected or projects will cost more than budgeted. However, managing risk also involves enterprise-level risks with widespread impacts.
TAM Guide Book Club #5: Improving Risk Management and Resiliency
FHWA defines risk and risk management, in the context of transportation asset management, as follows:
- Risk: The positive or negative effects of uncertainty or variability upon agency objectives. (23 CFR 515.5)
- Risk Management: The processes and framework for managing potential risks, including identifying, analyzing, evaluating, and addressing the risks to assets and system performance. (23 CFR 515.5)
Considering risk is important in developing TAM strategies, because transportation agencies often must spend significant resources responding to and/or mitigating risks. Reacting to the uncertainty presented by risks can be more expensive than proactive management. Risk management strengthens asset management by explicitly recognizing that any objective faces uncertainty, and by identifying strategies to reduce uncertainty and its effects. Being proactive, rather than reactive, in managing risk and avoiding “management by crisis,” helps agencies best use available resources to minimize and respond to risk as well as further build public trust.
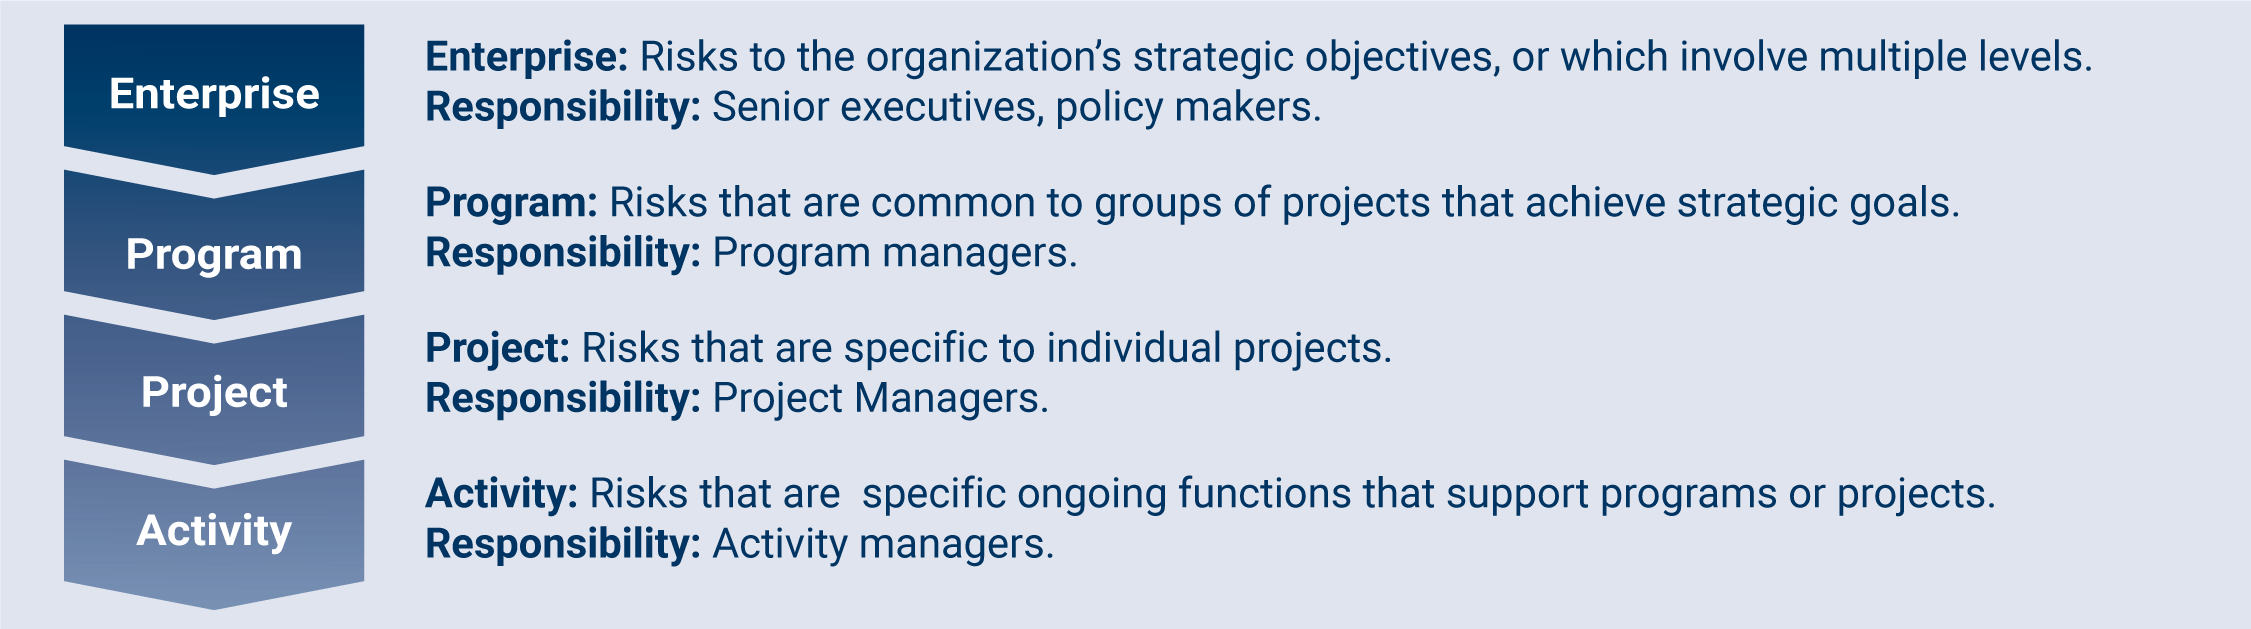
Given the importance of risk management for supporting asset management, agencies should formally identify and manage risks at all organizational levels. Figure 2.6 shows four levels at which risks can be identified within an agency, and the individuals who may be responsible for the risks at each level.
Typically agencies manage risk every day. They are well-equipped to hand risks at the project and activity levels, and regularly consider risks on a larger scale. Formally considering and documenting potential risks at all levels can help bring greater attention to them and improve risk management.
TIP
Risk management workshops or discussions should involve as many people in as many different parts of the agency as possible. This ensures that a broader range of risks and categories of risks are included.
Figure 2.6 Levels of Risk within an Organization
TRB. 2016. NCHRP Project 08-93 Final Report. http://onlinepubs.trb.org/onlinepubs/nchrp/docs/NCHRP08-93_FullGuide.pdf
Risk Management Process
TAM Webinar #27 - Risk Management
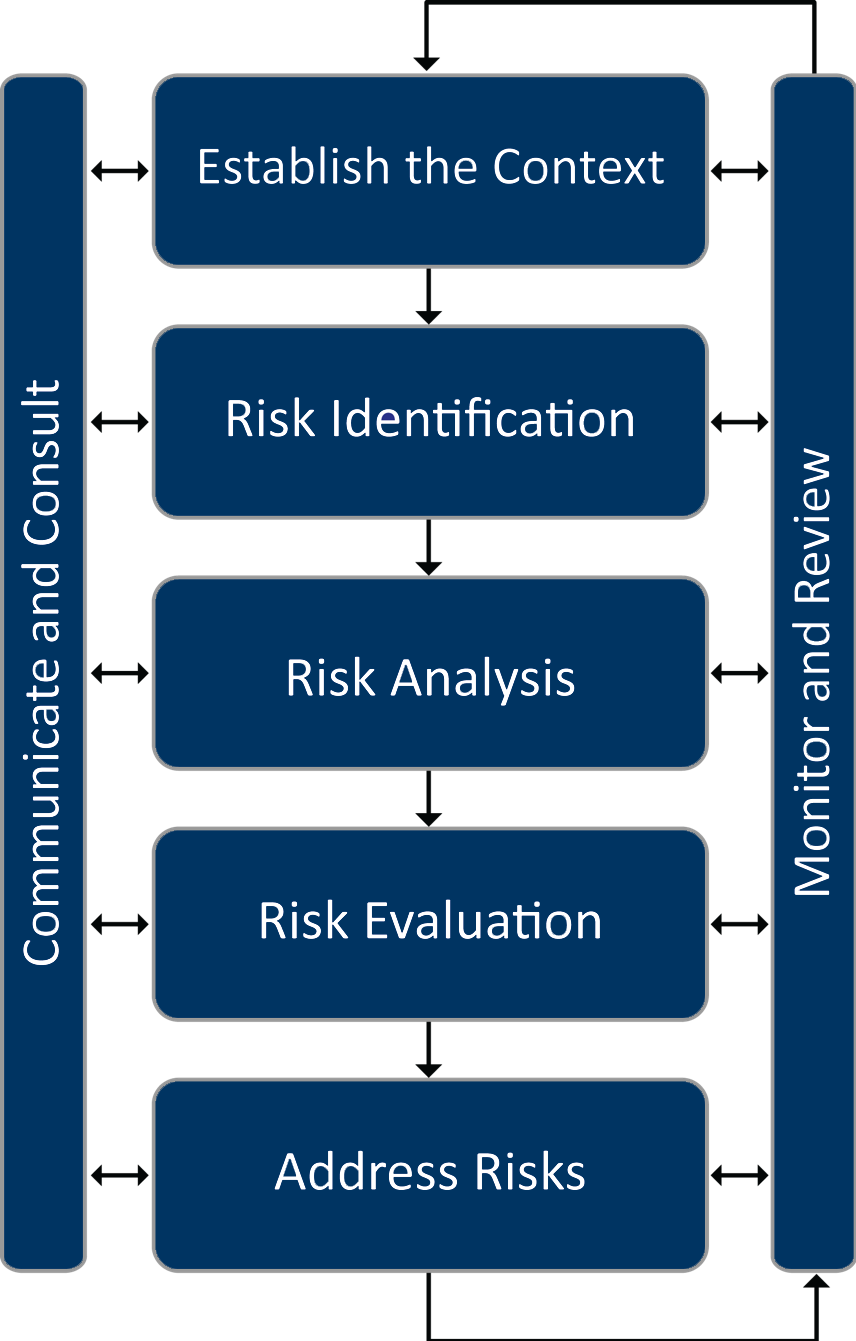
Figure 2.7 depicts a risk management process. While it may not be necessary to walk through each discrete step in this process for every risk an agency faces, this process is helpful for understanding how to incorporate risk into TAM.
- The process starts with establishing the context for risk management. In the case of risk management for a TAMP, the context is largely defined through other TAMP development steps.
- The second step involves identifying the risks that affect the assets in the TAMP. Ideally, in this step the agency considers the full set of asset-related risks, even those that may appear insignificant.
- The third step, risk analysis, involves identifying the cause of the risk, the outcomes or consequences (impact), and the likelihood of the risk occurring.
- The fourth step, risk evaluation, entails prioritizing and ranking risks.
- Fifth, the address risks step is the response the agency takes to the risk. DOTs can choose to tolerate the risk or treat the risk in some manner.
- The left side of the figure shows a continuous communication and consultation activity. Agencies need to communicate the risks to both internal and external stakeholders, as well as monitor and review the risks.
- The right side of the figure shows an iterative monitoring and review process. Once the risks are identified, analyzed, and a mitigation plan is in place agencies need to monitor the risks and update the risk management documentation accordingly.
- More on risk monitoring and management is discussed in Chapter 6 Monitoring and Adjustment.
- This process is generally consistent with ISO Standard 31000, as well as FHWA’s requirements for state DOTs to assess risks to NHS assets in developing a TAMP.
Figure 2.7 The Relative Timeframes Between Plans
Source: Adapted from FHWA. 2017. Incorporating Risk Management into Transportation Asset Management
Plans: Final Document. https://www.fhwa.dot.gov/asset/pubs/incorporating_rm.pdf
Risk Register
It is common practice to develop a register identifying major risks and assess each based on expert judgment. In this fashion, the process is valuable for identifying “non-programmatic” risks, or risks not previously addressed in any one program. The How-To Guide in this section describes the steps in developing a risk register to identify such risks. Once a risk has been identified and assessed, formal processes may be required to perform a more detailed assessment and manage the risk programmatically, as illustrated in the Arkansas practice example.
Arkansas DOT
As part of the process of developing its 2018 TAMP, ARDOT developed a risk register and mitigation plan compliant with FHWA TAMP requirements. As part of this effort, ARDOT first reviewed and documented its existing controls for asset-related risks incorporated in its design specifications, and approaches for addressing specific risks to bridges (e.g., scour). The agency then developed an initial register through a risk workshop. In the workshop, ARDOT staff identified specific risks not otherwise addressed programmatically, classifying risks by type:
- Asset Performance
- External Threats
- Business Operations
- Highway Safety
- Finances
- Project and Program Management
- Information and Decision Making
For each risk ARDOT used expert judgment to classify the risk in terms of its likelihood and impact. An initial priority was determined based on this classification. Next, ARDOT defined potential mitigation strategies for each of the 14 high-priority asset management risks in the register. A total of 12 strategies were identified, with each helping to mitigate one or more different risks. ARDOT next prioritized the mitigation strategies, and developed mitigation and monitoring plans detailing actions to be undertaken, and the approach for monitoring the risks and updating the register moving forward.
Arkansas DOT. 2018. ArDOT Risk-Based Transportation Asset Management Plan. http://www.tamptemplate.org/wp-content/uploads/tamps/037_arkansasdot.pdf
2.2.4
Information Management
Planning and Programming, Performance Management and Risk management are activities that form components of the asset management framework within an agency. They are necessary to manage the infrastructure portfolio, and the services it supports.
Asset management relies on good data and tools to guide investment decision-making. Indeed many agencies have a wealth of data about their infrastructure, but are challenged to leverage information to make better decisions. Information management is the discipline that delivers foundational capabilities for asset management results. Asset management systems connect inventory and condition with analytical capabilities to predict asset condition under various funding and action scenarios. Other information and tools allow for the ability to relate asset actions across assets and with other transportation areas, such as safety and mobility. This section provides a brief overview of information management and how it supports the implementation of the concepts discussed in this guide. More detail can be found in subsequent Chapters. Each section has been crafted to illustrate how data, information and analysis can be leveraged to create better outcomes, and enable agencies to improve how they deliver services.
Data Collection Standards and Processes
Standards and processes for data collection are two important aspects of integrating asset management practices across the agency. Collecting a standard set of data elements for each asset ensures consistency, and better enables analysis and reporting across assets. Standard data elements can include a unique asset identifier, designated asset category and asset type. Geospatial referencing standards are also important. In order to see assets on a map and integrate them spatially, agencies need a standard way to locate them. It is also important to consider the data collection intake process. Before data is collected, agencies should determine if specific data already exists in order to prevent duplication. If the data does not exist and needs to be collected, agencies should consider how new data will integrate with what is available currently. This ensures the data is used in the most effective way possible. Finally, responsibility needs to be assigned to an Asset Data Steward who is responsible for ensuring data standards and processes are followed.
TIP
Data for asset management purposes can often be pulled from existing datasets that are used for other purposes. Alternatively, data collected for TAM purposes can often be used to fulfill other agency responsibilities.
Asset Information Across the Life Cycle
TAM integration also relies on collecting and updating asset information across the life cycle of the asset. It is important to think holistically about the asset life cycle, from the initial design phase and through future maintenance and rehabilitation activities. Technologies and processes are becoming available to extract asset information from design and as-built plans to populate inventories. Many agencies have processes in place to think holistically about assets during the project scoping and design phase.
Agencies face challenges in integrating asset information across the life cycle of the asset, because there is often a disconnect between maintenance activities, planning/ programming and the assets. For example, maintenance divisions may not know about planned projects on particular assets that have been scheduled for repairs. Better linkage between the work an agency is planning for the future, the work they are doing currently and the general condition of the assets is important to cultivate. Maturing agencies are working hard to bridge this gap. Chapter 6 provides more information on updating asset information and connecting with maintenance activities.
Common Set of Asset Management Reporting Processes
Another aspect of information management strategy that can help integrate TAM across an agency is to develop a common set of asset management reporting processes. Many agencies are successfully mapping different types of assets and making this information available on a GIS portal. Typically, these portals have different layers for each asset. This is one example of a consistent process for sharing information about assets.
As agencies seek to make cross-asset tradeoffs and scope projects considering multiple types of needs, having a common set of reporting processes and consistency across different tools becomes even more important. An example of the challenge agencies face in doing this is seen in the TAMP development process. Developing a TAMP requires information about the needs of different assets. This information must then be communicated with a common set of definitions and combined with funding information. Practitioners have to be aware of the funding and cost assumptions used in every tool before they can report numbers in the TAMP. For instance, the pavement management system might only include costs for the pavement work, whereas other planning tools might incorporate guardrail costs and other costs related to the work. Different tools might also use different assumptions for inflation. In order to bring all this information together in a TAMP, agencies need to make sure their reporting and assumptions are consistent.
Ohio DOT
Ohio DOT (ODOT) has focused on data and information management improvements as a foundational element of their asset management program. As part of this they have strengthened their geographic information system (GIS) and linked it to over 80 data sets. The agency’s TIMS allows users to make collaborative decisions based on shared access to the same data sets.
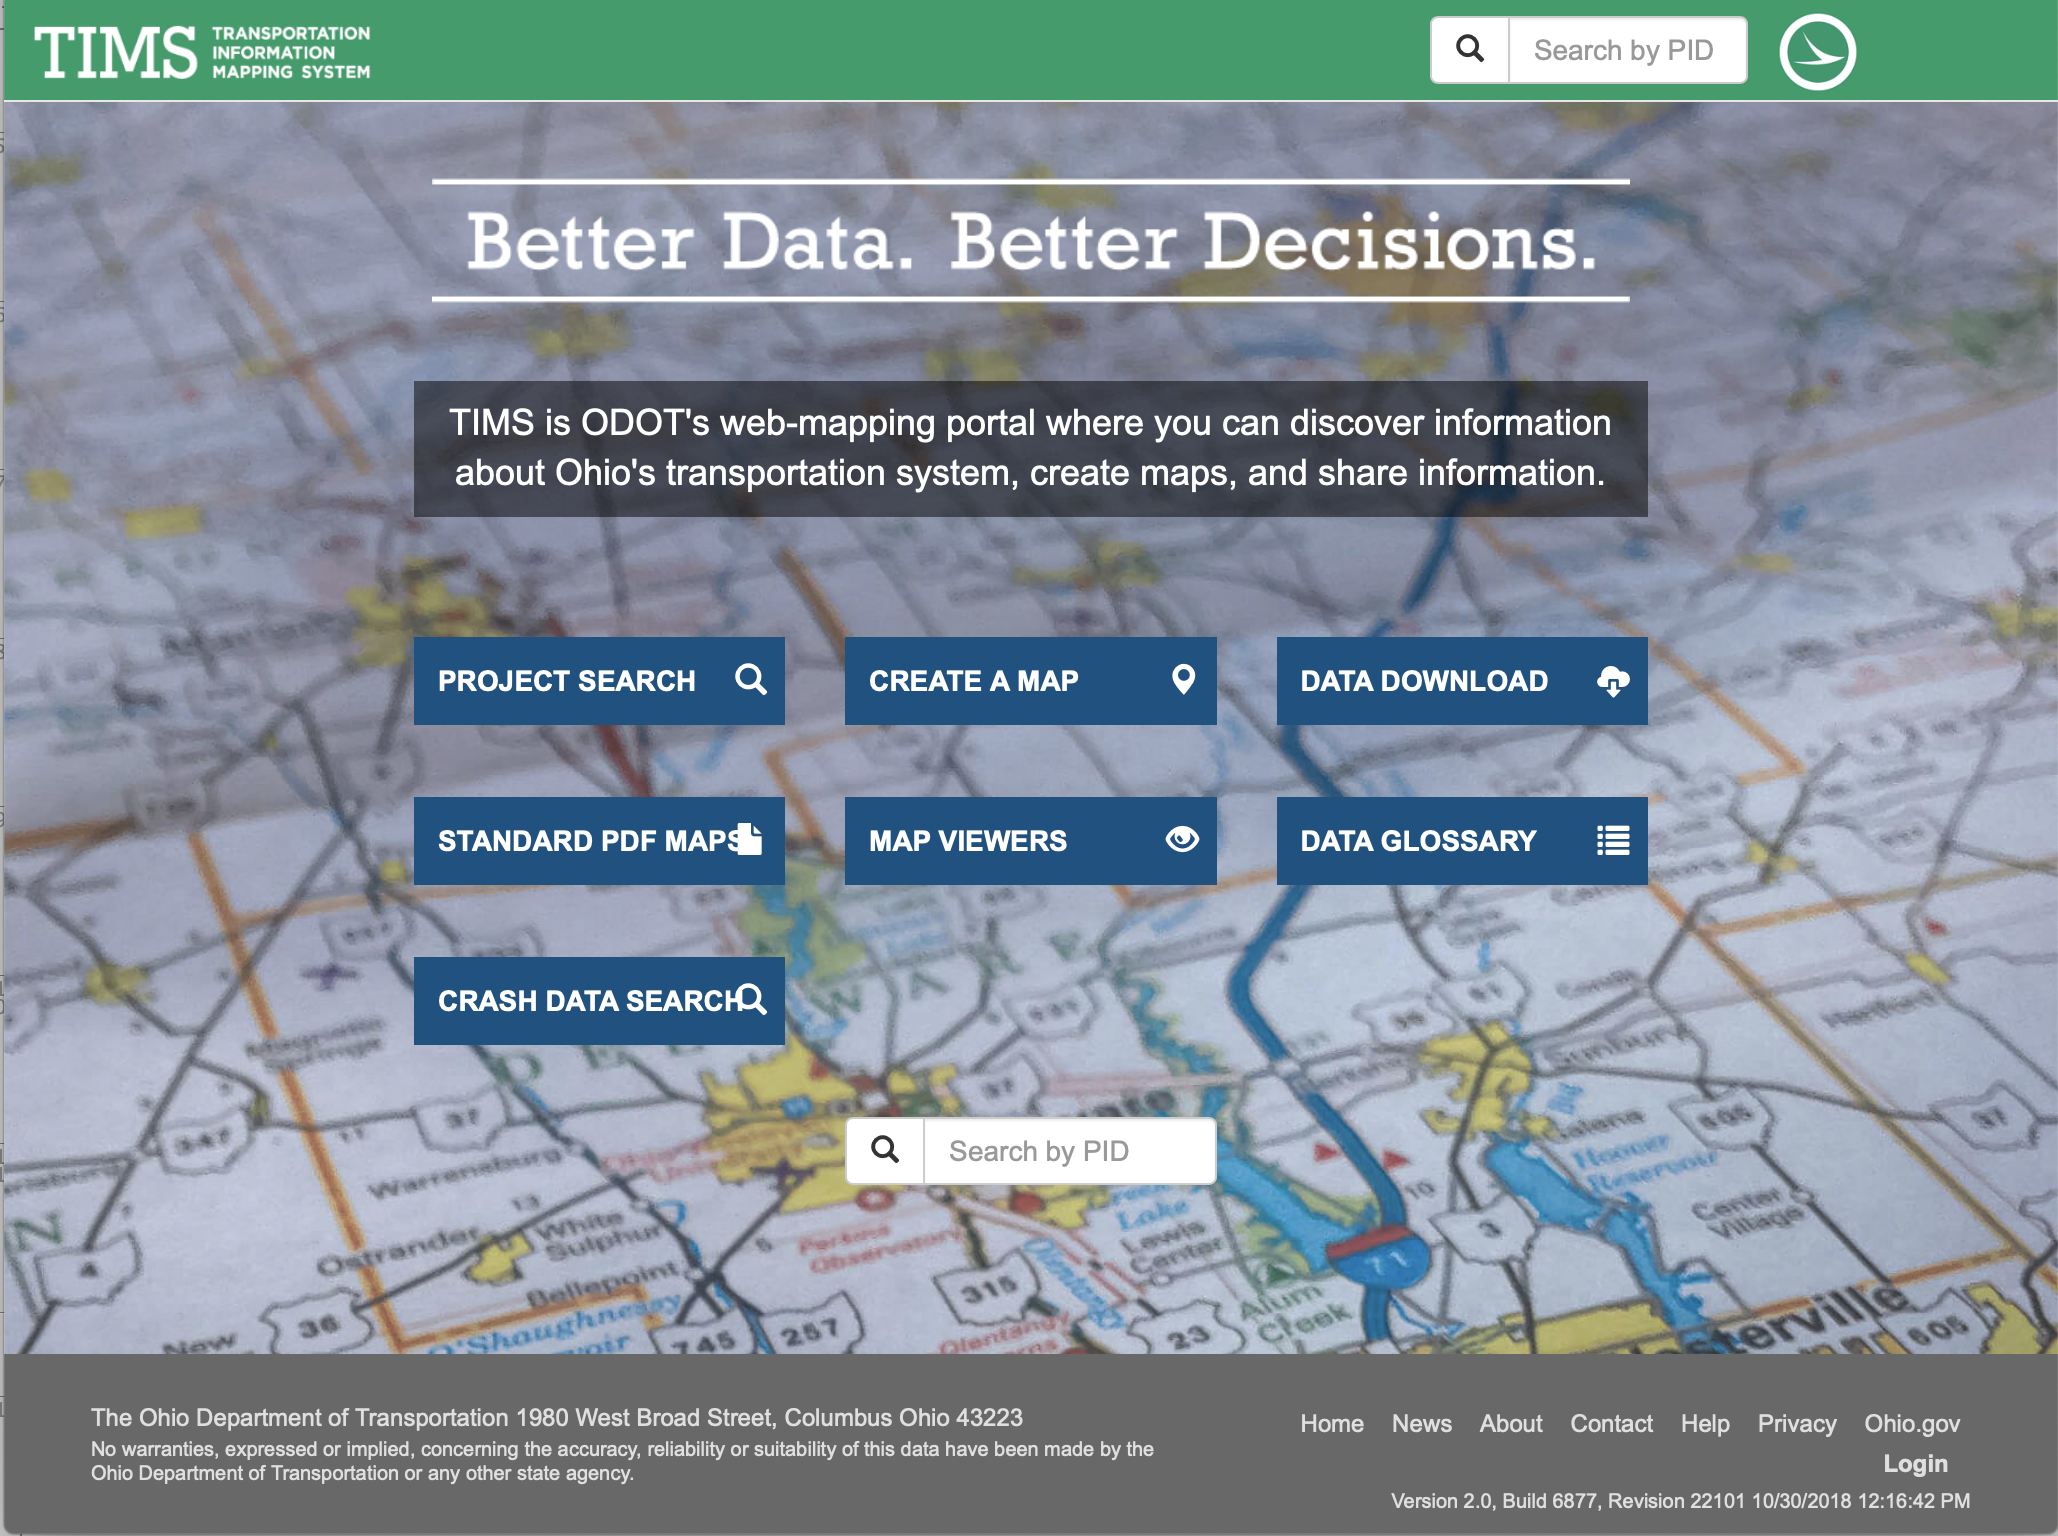
Source: Ohio DOT. TIMS.https://gis.dot.state.oh.us/tims/
2.2.5
Connecting Resilience with Asset Management
This subsection emphasizes the critical connection between resilience and transportation asset management (TAM) in the face of increasing threats from extreme weather events and disruptions. It outlines six major components for integrating resilience into TAM, including developing objectives and targets, identifying and assessing risks, implementing resilience strategies, incorporating resilience into planning, and monitoring and evaluating resilience efforts to ensure effective mitigation of disruption impacts.
Overview
TAM Webinar #60 - TAM and Resilience Building: Takeaways from the TAM Peer Exchange
As transportation systems face increasing threats from extreme weather events, climate change, and other disruptions, integrating resilience into transportation asset management plans (TAMPs) is crucial for ensuring the continued performance and reliability of these vital networks. Transportation assets are vulnerable to disruptions that have become increasingly more common or more severe, such as those caused by extreme weather events, climate change, as well as disruptions from man-made hazards such as fires, industrial accidents or security- or cyber-threats-. To sustain the performance and reliability of transportation systems, it is essential to include resilience as a factor in transportation asset management practices.
In the context of transportation asset management, resilience refers to the ability of transportation assets to maintain their functionality and performance in the face of disruptions, as well as the ability of transportation systems to quickly recover from disruptions and restore service. Integrating resilience into a transportation asset management plan (TAMP) involves incorporating strategies to prepare for, withstand, and recover from disruptions caused by extreme weather events, climate change, and other hazards. This approach ensures that transportation assets remain functional and support community needs during and after disruptions.
Addressing resilience within a TAMP has the following six major components:
- Develop Resilience Objectives and Targets: Transportation agencies should develop resilience goals and objectives. These objectives and targets should be aligned with the overall goals of the transportation system and should be measurable and achievable. These objectives should focus on minimizing disruptions, reducing recovery time, and enhancing the overall resilience of assets. By setting specific targets, an agency can effectively track progress and make informed decisions about resilience investments.
- Identify Risk: A transportation agency needs to identify and assess the risks that its transportation assets face. This includes understanding the likelihood and severity of potential disruptions, as well as the potential consequences of those disruptions. Identifying potential hazards, such as floods, hurricanes, or earthquakes, and evaluating their likelihood, severity, and potential consequences for transportation assets are important.
- Assess Risk: Calculating and assessing risk involves considering the probability of occurrence, the potential damage, and the associated costs. The formula for calculating risk can be generally described as:
Risk = Probability of Occurrence × Damage × Cost
- Probability of Occurrence—The probability of occurrence is a measure of how likely it is that a particular event will happen. It is usually expressed as a percentage or a decimal between 0 and 1. For example, if there is a 20% chance of a flood occurring in a given year, the probability of occurrence would be 0.2.
- Damage—The damage is the extent of the negative impact that an event would have if it were to occur. This could include physical damage to assets, financial losses, or harm to people or the environment. Damage is often expressed in monetary terms, but it can also be qualitative.
- Cost—The cost is the amount of money that would be required to mitigate or recover from the damage caused by an event. This could include the cost of repairs, insurance premiums, or emergency response measures.
Once you have determined the probability of occurrence, damage, and cost, you can multiply these three values together to calculate the overall risk. The resulting value represents the expected financial impact of the risk.
- Identify and Implement Resilience Strategies: Transportation agencies should identify and implement a variety of resilience strategies to mitigate the impacts of disruptions. These strategies may include hardening assets, improving redundancy, and developing emergency response plans. Understanding the specific risks faced by your transportation network will guide the development of tailored resilience strategies.
- Incorporate Resilience into a TAMP: The resilience strategies and considerations should be incorporated into all aspects of transportation asset management planning, including asset inventory, condition assessment, and prioritization of investments.
- Monitor and Evaluate Resilience: Transportation agencies should monitor and evaluate their resilience efforts to ensure that they are effective in reducing the impacts of disruptions. This includes collecting data on asset performance, disruptions, and recovery efforts.
Resilience considerations should be integrated into all aspects of your TAMP, including asset inventory, condition assessment, and prioritization of investments. Consider the resilience implications of each decision and how it affects the overall resilience of your transportation system. For example, when prioritizing maintenance or replacement projects, consider the vulnerability of assets to disruptions and prioritize those that are critical for maintaining network connectivity or supporting emergency response efforts.
TPM Webinar #10 - Resiliency and the IIJA
Montana DOT
When developing their 2018 TAMP MDT aligned their pavement performance targets and goals to those within their planning document TranPlan 21 (now TranPlanMT). TranPlanMT defines MDT's policy direction for operating, preserving, and improving Montana’s transportation system over a 20-year period. It serves as the guiding document for MDT decisions, especially those related to investing Montana’s limited transportation funds. This type of alignment can help illustrate a link from policy objectives to investment strategies and resource allocation.
Sources:
British Columbia
To support the alignment of agency policies, objectives and day-to-day practices, the Province of British Columbia established the tiered structure shown in Figure 2.5 for a design-build-finance-operate project. The highest of the three levels, Key Performance Measures, defines the high-level outcomes for service delivery in terms of a few key strategic areas. The second level, Asset Preservation Performance Measures, defines the minimum acceptable condition levels for each of the individual assets to preserve their value. The third level, Operational Performance Measures, corresponds to the many specific requirements for operating and maintaining the highway in a safe manner on a day-to-day basis. The tiered approach helped align stakeholders at all levels and clarified priorities for all parties.
Minnesota DOT
The Minnesota DOT’s performance management system consists of clear policies, performance trend data and performance forecasts to guide investments and operational decisions. The system is designed to (http://www.dot.state.mn.us/measures/):
- Address stakeholders’ desire for accountability and transparency
- Provide more informed decision-making and solutions to increasing challenges
- Enhance customer-responsiveness
- Ensure compliance with legislators' mandates
- Improve internal management
- Facilitate refinement of programs and services
- Set benchmarks for comparison of results
MnDOT uses performance criteria to guide capital investments and annual operational budgets. Transportation system and agency performance reports are regularly reviewed by MnDOT management. The ongoing measurement and review process assists MnDOT in evaluating the efficiency of service delivery and assessing the effectiveness of program activities. This objective-based approach increases transparency, and encourages innovation by keeping the focus on outcomes.
The accountability and transparency provided by MnDOT’s performance management system has contributed to MnDOT’s reputation among elected officials as a trusted partner in addressing challenging issues.
Accountability and transparency are a foundation of success for public agencies. The benefit is increased trust. This can help elected officials view MnDOT as a trusted partner and work together on challenging issues. Confidence in agency decision-processes and results is important to legislators considering new investments.
Arkansas DOT
As part of the process of developing its 2018 TAMP, ARDOT developed a risk register and mitigation plan compliant with FHWA TAMP requirements. As part of this effort, ARDOT first reviewed and documented its existing controls for asset-related risks incorporated in its design specifications, and approaches for addressing specific risks to bridges (e.g., scour). The agency then developed an initial register through a risk workshop. In the workshop, ARDOT staff identified specific risks not otherwise addressed programmatically, classifying risks by type:
- Asset Performance
- External Threats
- Business Operations
- Highway Safety
- Finances
- Project and Program Management
- Information and Decision Making
For each risk ARDOT used expert judgment to classify the risk in terms of its likelihood and impact. An initial priority was determined based on this classification. Next, ARDOT defined potential mitigation strategies for each of the 14 high-priority asset management risks in the register. A total of 12 strategies were identified, with each helping to mitigate one or more different risks. ARDOT next prioritized the mitigation strategies, and developed mitigation and monitoring plans detailing actions to be undertaken, and the approach for monitoring the risks and updating the register moving forward.
Arkansas DOT. 2018. ArDOT Risk-Based Transportation Asset Management Plan. http://www.tamptemplate.org/wp-content/uploads/tamps/037_arkansasdot.pdf
Ohio DOT
Ohio DOT (ODOT) has focused on data and information management improvements as a foundational element of their asset management program. As part of this they have strengthened their geographic information system (GIS) and linked it to over 80 data sets. The agency’s TIMS allows users to make collaborative decisions based on shared access to the same data sets.
Source: Ohio DOT. TIMS.https://gis.dot.state.oh.us/tims/