Topic: Data Management, Analytics & Visualization
Data Management, Analytics & Visualization
This page features information on managing and maintaining your data. Whether you want to monitor data
more effectively, bolster your data collection systems, or improve your data modeling, you can find what you need here.
Overview:
Transportation asset management is by its nature a data intensive activity. State DOT’s and other transportation
agencies are facing increasing pressures to do more with their limited TAM resources. Whether you want to monitor
data more effectively, bolster your data collection system, advance your data modeling, or improve your data-driven
communication, you can find what you need here.
Defining Data Management
Data management is the set of activities carried out to manage data across its lifecycle. Data management activities
include data governance, planning and specification, data collection and documentation, data organization and
storage, data sharing and use, as well as data disposition.
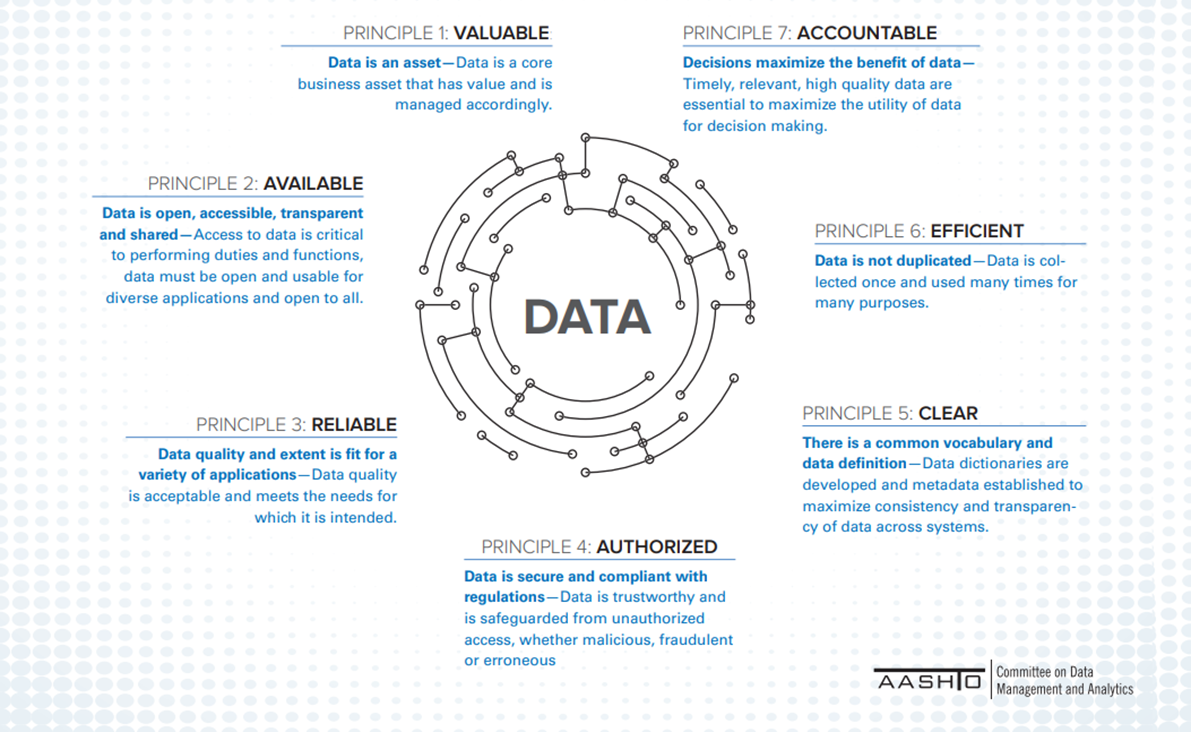
To support robust data management, AASHTO has established a set of seven Core Data Principles. You are encouraged to
consider and adopt these principles as you work to advance your agency’s data management and use.
As DOT TAM programs have grown increasingly complex and data rich, the need for effective data analysis and
visualizations has never been greater. Data analysis and visualizations are integral to how a modern TAM program
drives results and decisions and shares insights with stakeholders. These practices have also never been more
accessible; many DOT’s are integrating powerful, configurable business intelligence and analytics tools into regular
use across their agencies. However, crafting succinct, engaging, powerful analytics and illustrations is a
challenge that is not solved by data and technology alone, effective practices are required to recognize your
audience and purpose, to select an appropriate visualization type, and deliver an effective, easily interpreted
topic.
Implementation Considerations:
TAM practitioners have a vital role to play in their agency’s data management programs and processes. As leaders and
subject matter experts in critical agency business areas, you should partner with data program leadership and
technical staff to support data value and use throughout its lifecycle. Key areas for business attention include:
- Data Specification. Prepare for new or adjusted databases with consideration of how data will be used, paying
attention to ensure you can provide precise, unambiguous data specifications, aligned with agency data
standards. Also, avoid duplication of data that is already collected elsewhere. - Metadata Management. Coordinate with technical staff to document the business and technical context of your
data, necessary to support data understanding. - Data Security Management. Help prevent unauthorized access to or use of data by documenting intended uses of
your data and identifying private, confidential or otherwise sensitive data partnering with technical staff to
ensure appropriate access controls. - Data Quality Management. Work to ensure data is fit for purpose, defining business rules for collection, quality
processing, and use, measuring quality, and planning for improvement. - Reference and Master Data Management. Establish and use authoritative sources for shared data.
- Data Integration. Combine data from authoritative sources, in alignment with acceptable uses, to support
analysis, reporting and decision-making. Provide clear requirements for technical staff who support extract,
transform, and load scripts, and double check that outcomes are meaningful. - Data Retention Planning. Keep data for its useful life and as required, but eliminate unnecessary data when it
is no longer useful. - Data Use. Be cognizant of good data analysis and visualizations, ensuring data is used appropriately and the
intent and meaning of analytics and illustrations are clear to targeted audiences.
Related Subsections:
Information Management 2.2.4
Planning and Programming, Performance Management and Risk management are activities that form components of the asset management framework within an agency. They are necessary to manage the infrastructure portfolio, and the services it supports.
Asset management relies on good data and tools to guide investment decision-making. Indeed many agencies have a wealth of data about their infrastructure, but are challenged to leverage information to make better decisions. Information management is the discipline that delivers foundational capabilities for asset management results. Asset management systems connect inventory and condition with analytical capabilities to predict asset condition under various funding and action scenarios. Other information and tools allow for the ability to relate asset actions across assets and with other transportation areas, such as safety and mobility. This section provides a brief overview of information management and how it supports the implementation of the concepts discussed in this guide. More detail can be found in subsequent Chapters. Each section has been crafted to illustrate how data, information and analysis can be leveraged to create better outcomes, and enable agencies to improve how they deliver services.
Data Collection Standards and Processes
Standards and processes for data collection are two important aspects of integrating asset management practices across the agency. Collecting a standard set of data elements for each asset ensures consistency, and better enables analysis and reporting across assets. Standard data elements can include a unique asset identifier, designated asset category and asset type. Geospatial referencing standards are also important. In order to see assets on a map and integrate them spatially, agencies need a standard way to locate them. It is also important to consider the data collection intake process. Before data is collected, agencies should determine if specific data already exists in order to prevent duplication. If the data does not exist and needs to be collected, agencies should consider how new data will integrate with what is available currently. This ensures the data is used in the most effective way possible. Finally, responsibility needs to be assigned to an Asset Data Steward who is responsible for ensuring data standards and processes are followed.
TIP
Data for asset management purposes can often be pulled from existing datasets that are used for other purposes. Alternatively, data collected for TAM purposes can often be used to fulfill other agency responsibilities.
Asset Information Across the Life Cycle
TAM integration also relies on collecting and updating asset information across the life cycle of the asset. It is important to think holistically about the asset life cycle, from the initial design phase and through future maintenance and rehabilitation activities. Technologies and processes are becoming available to extract asset information from design and as-built plans to populate inventories. Many agencies have processes in place to think holistically about assets during the project scoping and design phase.
Agencies face challenges in integrating asset information across the life cycle of the asset, because there is often a disconnect between maintenance activities, planning/ programming and the assets. For example, maintenance divisions may not know about planned projects on particular assets that have been scheduled for repairs. Better linkage between the work an agency is planning for the future, the work they are doing currently and the general condition of the assets is important to cultivate. Maturing agencies are working hard to bridge this gap. Chapter 6 provides more information on updating asset information and connecting with maintenance activities.
Common Set of Asset Management Reporting Processes
Another aspect of information management strategy that can help integrate TAM across an agency is to develop a common set of asset management reporting processes. Many agencies are successfully mapping different types of assets and making this information available on a GIS portal. Typically, these portals have different layers for each asset. This is one example of a consistent process for sharing information about assets.
As agencies seek to make cross-asset tradeoffs and scope projects considering multiple types of needs, having a common set of reporting processes and consistency across different tools becomes even more important. An example of the challenge agencies face in doing this is seen in the TAMP development process. Developing a TAMP requires information about the needs of different assets. This information must then be communicated with a common set of definitions and combined with funding information. Practitioners have to be aware of the funding and cost assumptions used in every tool before they can report numbers in the TAMP. For instance, the pavement management system might only include costs for the pavement work, whereas other planning tools might incorporate guardrail costs and other costs related to the work. Different tools might also use different assumptions for inflation. In order to bring all this information together in a TAMP, agencies need to make sure their reporting and assumptions are consistent.
Ohio DOT
Ohio DOT (ODOT) has focused on data and information management improvements as a foundational element of their asset management program. As part of this they have strengthened their geographic information system (GIS) and linked it to over 80 data sets. The agency’s TIMS allows users to make collaborative decisions based on shared access to the same data sets.
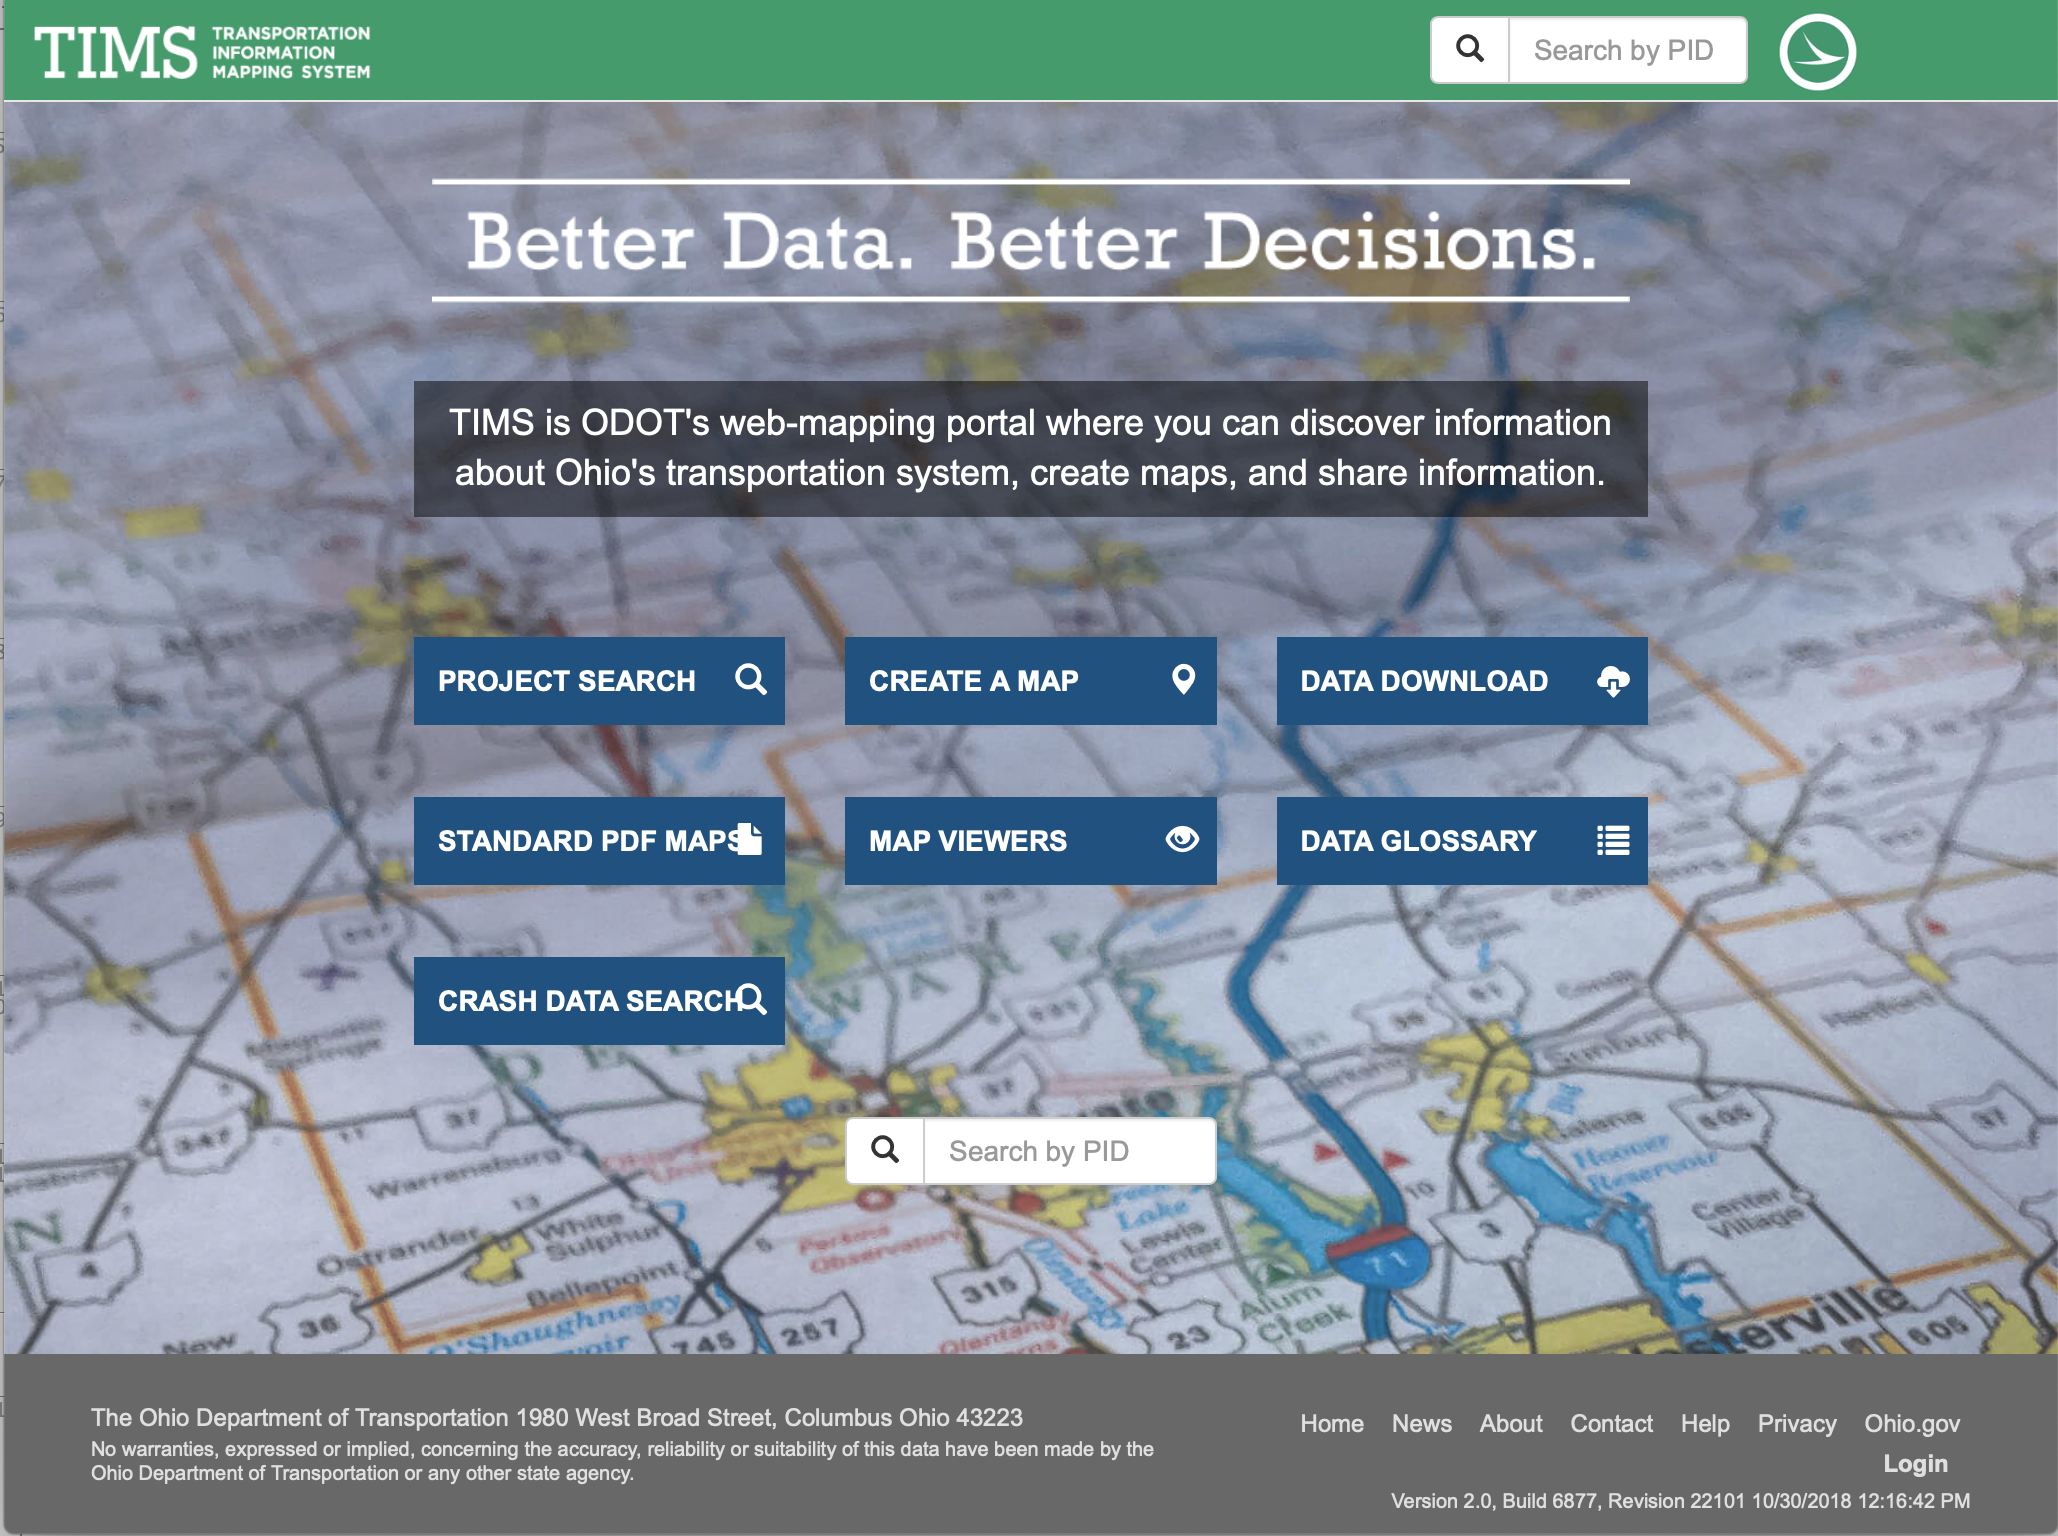
Source: Ohio DOT. TIMS.https://gis.dot.state.oh.us/tims/
Beyond the Basic TAMP 2.4.2
This section contains suggestions for developing a TAMP that goes beyond the basic elements of a TAMP described in the previous section. An agency can expand the scope of the TAMP to include additional asset types and systems. An agency may further tailor their TAMP to address specific needs.
TAMP Scope
A highway agency focused on complying with Federal requirements will typically focus on including its NHS pavements and bridges in its TAMP. While these assets make up the greatest portion of a typical state highway agency, an agency may wish to include additional assets in its TAMP. Also, the agency may wish to extend the network scope of the TAMP. In updating a TAMP with NHS pavement and bridges, an agency may include other assets, such as drainage assets, traffic and safety features, or the agency may wish to include all of the assets it owns.
For transit TAMPs, the initial focus is on revenue vehicles, facilities and infrastructure, as these are the assets that require the greatest investment. An agency may wish to expand its TAMP to include additional assets that are important to the systems, albeit less costly, such as bus shelters and signage.
TAM Webinar #55 - TAM Tools Miniseries 02: Management Systems
TAM Implementation Plan
As described in Section 2.3, it is often helpful to prepare an implementation plan describing a set of planned business process improvements that an agency intends to undertake to strengthen its approach to TAM. There are many examples of TAMPs that focus specifically on an agency’s TAM approach and how it plans to improve its approach. Ideally a TAMP should both describe an agency’s assets and planned investments, and detail how it intends to improve its TAM approach. Where an agency has developed both a TAMP and TAM implementation plan, the implementation plan can be incorporated as a section of the TAMP.
TAM Guide Book Club #2: TAMP Implementation and Integration
TAM-Related Business Processes
An agency may wish to include a discussion of one or more of the business processes related to TAM in its TAMP. Alternatively, there may be other agency documents that provide more detail on these issues that can be referenced in the TAMP. These areas include:
- Performance Targets. As described in Chapter 5, setting performance targets can help guide the resource allocation process. However, agencies often have broader efforts to establish and track performance beyond the scope of TAM.
- Financial Planning. While developing a TAM investment plan is central to developing a TAMP, often the revenue forecast used to support developing the investment plan is developed separately and used for other purposes beyond the scope of TAM. It may be valuable to document the agency’s approach to forecasting future revenues for TAM and other applications. Chapter 5 describes provides additional detail on this topic.
- Work Planning and Delivery. As described in Chapters 4 and 5, work delivery approaches can impact how assets are maintained over their life cycle, and how resource allocation decisions are made. Some agencies have adopted formalized approaches for evaluating and selecting different work delivery approaches.
- Data Management. Chapter 7 discusses the importance of implementing an approach to data management and governance. Some TAMPs include additional information on this topic given its relationship to TAM.
AASHTO
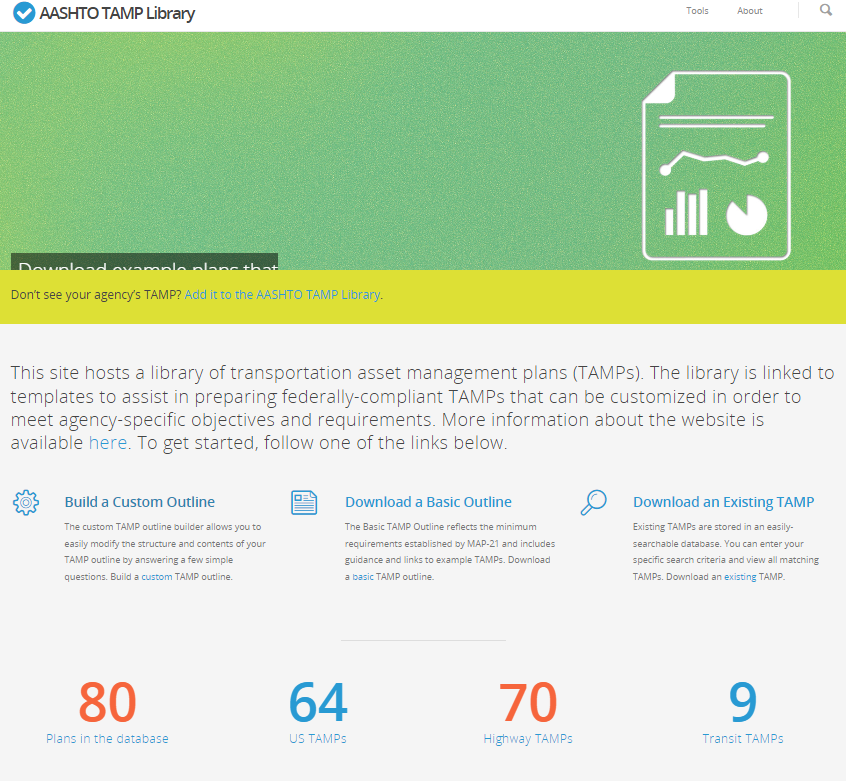
The AASHTO TAMP Builder website (available at https://www.tamptemplate.org/) hosts annotated plan outlines to assist agencies in preparing TAMPs. The site also provides resources to customize an outline in order to meet agency-specific objectives and requirements. The website integrates a database of TAMPs, dating from 2005, that support the functionality of the outlines created using the site.
Use this Site to Build a MAP-21-Comlpiant TAMP
Data Collection 2.5.3
This subsection discusses the importance of data collection in asset management programs, emphasizing the need for coordination between different agency groups. It introduces a performance-based management strategy using the RCM approach, detailing condition-based, interval-based, and reactive maintenance components relevant to life cycle planning of ancillary highway assets. The document also provides a table summarizing maintenance approaches for various asset classes, supporting agencies in efficiently collecting high-quality data for informed decision-making.
After evaluating the priority of asset classes, asset stewards need to understand the intended functions, potential failure possibilities, available maintenance options, and the consequences of failure for each asset class. This information is typically dispersed across various areas or business units within an agency. Gathering this information necessitates coordination among different groups within the agency. The ideal approach involves following a framework to establish a performance-based management strategy for ancillary assets, identifying the optimal data elements for collection, and selecting the most suitable data collection techniques for each asset class.
Figure 2.12 Reliability Centered Maintenance
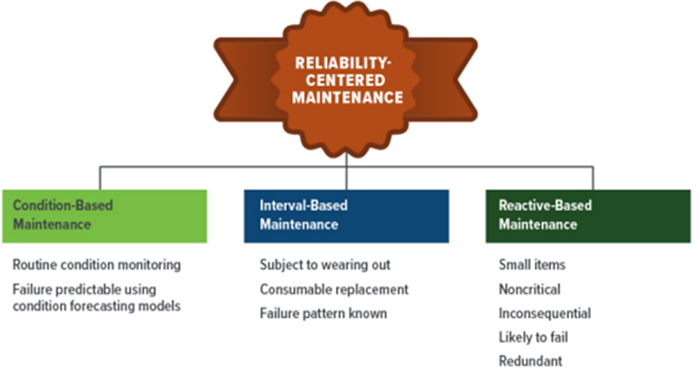
The Handbook (FHWA-HIF-19-006) offers a potential framework of interconnected processes that can be tailored to an agency's specific requirements. The process for developing a performance-based management strategy employs the Reliability-Centered Maintenance (RCM) approach, which is elaborated upon in Chapter 4. RCM utilizes a series of risk-based questions to assist agencies in identifying the most effective and efficient management strategies. The three primary components of an RCM program pertinent to the life-cycle planning of ancillary highway assets are condition-based maintenance, interval-based maintenance, and reactive maintenance. This is illustrated in Figure 2.12, as adapted in the Handbook from NASA (2008. Reliability-Centered Maintenance Guide for Facilities and Collateral Equipment. National Aeronautics and Space Administration, Washington, DC). A decision tree can be used to establish an appropriate management and maintenance approach for each ancillary asset class to inform data requirements. This is also illustrated in Figure 4.5 of Chapter 4.
Figure 2.13 RCM Decision Tree
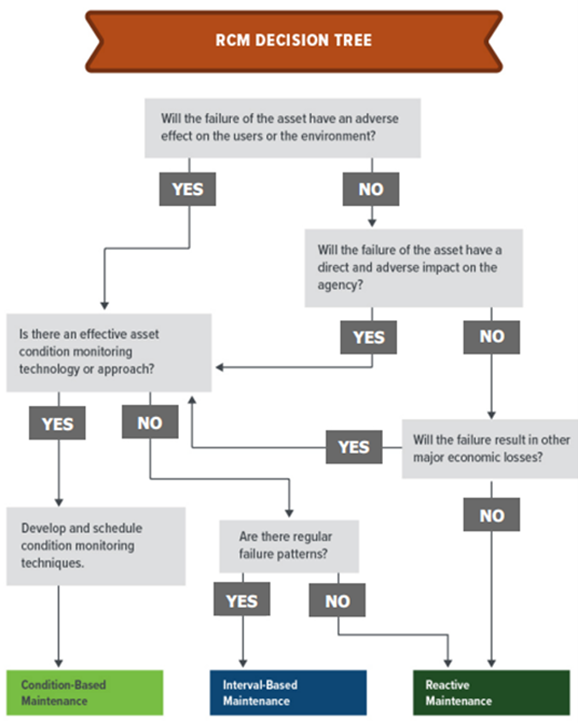
- Condition-based maintenance includes predictive maintenance and real-time monitoring. Inspections note current capital and maintenance interventions as well as current state to be considered by maintenance teams and inputted into predictive models.
- Interval-based maintenance is conducted independently of the asset's condition and involves performing inspections or replacements at predetermined intervals.
- Reactive maintenance assumes that failure is low risk to operations and where there are no practical monitoring approaches and/or regular deterioration or failure patterns. Repairs are made after the failure. Table 2.4 presents a summary of the applicability of condition, interval, or reactive maintenance for each of the asset classes.
Table 2.4 Typical Maintenance Approaches by Asset Class
| Asset Class Elements | Condition Based | Interval Based | Reactive Based |
|---|---|---|---|
| All Structures (excluding bridges) | Preferred | Not Recommended | Feasible |
| Traffic Control and Management - Active Devices | Feasible | Preferred | Feasible |
| Traffic Control and Management - Passive Devices | Feasible | Feasible | Preferred |
| Drainage systems and environmental mitigation features | Feasible (except preferred for small culverts) | Preferred (except feasible for small culverts) | Feasible |
| Other Safety Features | Feasible | Feasible | Preferred |
| Roadside features | Feasible | Feasible* (not recommended for roadside hazards) | Preferred** |
| Other facilities items | |||
| Rest areas, weigh stations and buildings | Preferred | Feasible | Feasible |
| Parking Lots, Roadside litter and fleet | Feasible | Preferred | Feasible |
| Graffiti | Feasible | Feasible | Preferred |
* - Preferred for landscaping, access ramps, and bike paths
** - Feasible for landscaping, access ramps, and bike baths
Data Required for Decision-Making 2.5.4
This subsection emphasizes the significance of data collection for effective decision-making in asset management programs, particularly using a Reliability Centered Maintenance (RCM) approach. It outlines essential data requirements for different maintenance types, such as condition-based, interval-based, and reactive-based maintenance, and highlights the importance of complete and reliable data. Additionally, the document discusses desirable data that can enhance decision-making by providing clarity, supporting different agency departments, generating accurate work orders, managing asset risks, and tracking the asset's full life cycle.
Data-driven decisions depend on asset data to guide effective investment choices. Effective data collection practices allow an agency to execute strategic RCM maintenance and streamline work order distribution. With accurate data, metrics can be derived, and performance measures compared to assess the effectiveness of a maintenance strategy and identify areas for improvement. Ancillary asset data can be categorized as either essential or desirable, depending on the management approach. Regardless of the data type, it is crucial that the data be complete and reliable. Generally, the RCM process required the following essential data for effective management.
Table 2.5 – Essential Data by Maintenance Approaches for Ancillary Assets
| Maintenance Type | Asset Type | Asset Location | Asset Unique ID | Condition Data |
|---|---|---|---|---|
| Interval-based maintenance | X | X | X | - |
| Condition-based maintenance | X | X | X | X |
| Reactive-based maintenance | X | X | X | - |
There are various strategies and technologies that support data acquisition that can be found in Chapter 7 and in the Handbook for Ancillary assets (FHWA-HIF-19-006). Other desirable data can augment decision-making by:
- Providing additional clarity and accuracy to the essential data collected.
- Supporting different departments within an agency.
- Assisting in generating accurate work orders.
- Helping manage asset risks.
- Tracking the asset’s full life cycle to make informed decisions.
The above list is not all-inclusive but provides clear examples of reasons why additional data collected in the field could be beneficial to an agency. Each of these items is described in more detail in the handbook. Other desirable data attributes have been referenced elsewhere (HMEP 2013), and may also be considered, including:
- Maintenance intervals.
- Frequency of failure.
- Allocated risk factors.
- Maintenance requirements.
- Engineering specific data
Managing Ancillary Asset Data 2.5.5
This subsection underscores the importance of integrating ancillary asset data into an agency's overall data management system for informed decision-making on management, maintenance, and capital investment. It outlines guiding principles for effective data management practices, including interdepartmental coordination, an authoritative hub with integrated databases and web services, a common data dictionary, and business improvements in querying, analyzing, displaying, and reporting data.
Integrating ancillary asset data into an agency’s overall data management system ensures that decision-making associated with management, maintenance and capital investment is based on the best available information across the organization. An agency will, at the same time, improve transparency and public trust. The following guiding principles distinguish good data management practices from less comprehensive approaches to data management:
- Strategic Plan—Interdepartmental coordination.
- Authoritative Hub—Integrated database and web services.
- Common Data Dictionary—Agency agreement on assets and attributes.
- Business Improvements—Query, analyze, display, and report data.
Data management concepts are discussed in more detail in Chapter 7.
Yukon Department of Highways and Public Works
The Yukon Department of Transportation and Public Works (TPW) is committed to taking a consistent, strategic approach to asset planning and management; to deliver services matching their customers’ expectations, while maximizing value for money. Vegetation management is a key part of TPW’s roadside safety program. It improves highway safety and helps preserve their infrastructure by:
- Improving visibility and vehicle sight lines.
- Reducing wildlife collisions.
- Establishing a clear zone.
- Facilitating roadside drainage.
- Preserving roadside surfaces.
- Controlling invasive weeds.
- Enhancing the overall driving experience.
The TPW roadside vegetation management program was established in the early 2000’s to address the challenges of maintaining right-of-way growth throughout Yukon. Over the past few years, the program was reassessed, leading to several improvements in the inspections and decision-making processes. This included establishing a life cycle model in the agency's dTIMS management system, to project the future condition of roadside vegetation, generate possible treatment strategies (e.g., mowing, brushing) for each section of road, and identify an optimal solution by assessing the life cycle costs and benefits from each treatment strategy for each road section. This included steps to define and compile the model inputs, including roadway inventory, vegetation condition ratings, deterioration curves, treatment options, treatment decision logic and financial parameters. The dTIMS roadside vegetation life cycle model was used to develop an optimized long-term investment plan that assessed the impacts of alternative budget scenarios and/or constraints. It also provided an example of how the software could be used by TPW staff to later model decision making for other asset types.
TAM Work Planning and Delivery 5.4.1
The approach used to deliver work can have a major impact on what investments an organization makes, the resources required to perform work, and work timing. Transportation agencies have many options for performing work, including using internal forces to perform work, and/or using a variety of different contracting approaches.
Typically, U.S. transportation agencies perform some or most of their maintenance work internally, and contract out a large portion – if not all – of their capital projects. The line between the types work performed as maintenance and capital projects varies by organization and is often blurred. Agencies can often use maintenance forces in a flexible manner to perform a wide variety of activities, including preservation activities on pavements, bridges and other assets. However, in the near term, an organization’s maintenance resources – staff and equipment, in particular – are fixed. Consequently, the asset owner is challenged to optimize use of these resources to meet immediate needs, such as winter maintenance and incident response, while performing additional work to improve asset conditions wherever possible.
The ability to contract out maintenance work, such as through Indefinite Delivery/Indefinite Quantity (IDIQ) contracts, provides an agency with flexibility in meeting near-term needs. Other approaches for contracting out maintenance work include use of portfolio or program management contracts in which certain operations and maintenance responsibilities for some group of assets is delegated to a contractor over a specified period of time. Section 4.3.3 provides additional details on considerations involved in outsourcing asset maintenance.
Regarding contracting approaches for capital projects, in the U.S., most transportation agencies rely on Design-Bid-Build (DBB) model for delivering their capital programs. With this approach, the project owner designs a project (or contracts for a private sector firm to prepare a design) and solicits bids for project construction following completion of the design. This provides the project owner with control over the process, but can be time consuming and can result in cases where bids for project construction exceed the expected cost developed during design. In recent years, many transportation agencies in the U.S. and abroad have explored improved approaches to work planning and delivery to accelerate completion of needed work, leverage alternative financing approaches and transfer program and project risk.
All of these approaches are intended to reduce the time from initial conception of a project to its completion, and in many cases transfer risks associated with project completion from the public sector to the private sector. As these examples help illustrate, major trends in this area include:
- Group work together by geographic location or type of work to develop fewer, larger, and more easily contracted projects
- Use Design-Build (DB), Design-Build-Finance-Operate-Maintain (DBFOM) and other contracting strategies, wherein a single contract is awarded to design and complete a project, as opposed to separate contracts for design and construction
- Encourage development of Alternative Technical Concepts (ATCs), wherein a contractor proposes an alternative approach to meeting a contract requirement in the bidding phase
- Select contractors earlier in program/project development through use of Construction Manager-General Contractor (CM-GC) arrangements, where a contractor is selected as Construction Manager while design is still underway
- Use IDIQ contracts and other flexible contracts to provide a more efficient mechanism for performing smaller projects
- Incorporate performance-based specifications, time-based incentives and other specifications in contracts to improve project outcomes
- Outsource operations and maintenance of an asset using program or portfolio management contracts.
Both in the U.S. and abroad there are many examples of public agencies making extensive use of alternative contracting strategies, such as Public-Private Partnerships (P3s) and performance-based contracts to speed project delivery and transfer risk.
While alternate strategies for work planning and delivery hold great promise, all of the approaches described here have advantages and disadvantages and carry their own risks. Use of alternative approaches can save taxpayers money and provide improvements more quickly than a traditional model. Success stories typically result from improving the efficiency of the process and incentivizing the use of better technology and methods, but there are also many cautionary examples in which these strategies have failed to achieve cost savings, time savings or risk transfers as desired. Asset owners should consult the separate body of research in this area (referenced at the end of this section) when exploring the use of alternative approaches and carefully weigh the expected return, advantages and disadvantages of whatever delivery approaches they consider.
Types of Performance-Based Data to Monitor 6.2.1
This section describes the types of information that should be collected and maintained to support performance-based decisions for physical assets. This section focuses on asset inventory and condition information for life cycle management, but recognizes that other operational performance characteristics may be important to determine whether an asset is fulfilling its intended function.
Differences in Performance and Condition
The terms ‘performance’ and ‘condition’ are often used interchangeably, although they have different meanings in a performance-based environment. The performance of an asset relates to its ‘ability to provide the required level of service to customers3’ while condition is generally considered to mean the observed physical state of an asset, whether or not it impacts its performance. For example, a bridge with scour may continue to perform adequately in the short-term even though it may receive a low National Bridge Inventory (NBI) rating because of the deterioration.
Inventory Information
An asset inventory provides information other than performance data important for estimating the amount of work needed, identifying the location of work in the field and determining characteristics capable of influencing the type of work to be performed. The RCM approach introduced in Chapter 4 can be used to help an agency determine what information is needed to support the management of each type of asset. The asset inventory requirements for those assets managed based on a specified interval for repair, such as pavement markings, is very different than those required for an asset managed using a condition-based approach, such as pavements or bridges. Regardless of how detailed the asset inventory is, it is important an agency establish processes to ensure data quality and keep the inventory current over time.
There are several basic data attributes essential to effectively managing transportation assets, including asset type, quantity and location. Additional information that is important is to differentiate between the types of work to be performed, which may also be added to the inventory, the type of material used to construct the asset, the last time work was performed and factors influencing the use of the asset (e.g. traffic levels, highway functional classification or climatic conditions).
As discussed in Chapter 7, managing asset inventory information using an integrated approach to data management helps promote consistency in asset data across an agency and provides access to help ensure the data is used by decision makers at all levels of the organization. An out-of-date inventory makes it difficult for an agency to estimate work quantities accurately for budgeting purposes.
Condition Information
Asset condition information is used to determine how assets are performing and how performance changes over time. The lack of condition information may lead to premature or unexpected failures with the potential to be very costly, negatively impacting system performance and increasing agency risks. Methods of collecting asset condition information are discussed further in Chapter 7. To ensure that condition information remains current, it is important that the information is updated on a regular basis.
Asset Condition
There are several approaches for assessing asset conditions, each of which is influenced by the type of asset and the resources available to support the process. Typically, an assessment of asset condition involves a method of evaluating the presence of deficiencies and/or deterioration at the time of inspection. The results are used to assign a rating or LOS used to determine the need for maintenance, rehabilitation or replacement now or in the future. Asset condition ratings may also be used to establish rates of deterioration, allowing an agency to forecast future conditions for planning purposes.
Examples of commonly used types of asset condition ratings are listed below.
- A pavement condition index based on the type, amount and severity of distress present, which could be on a 0 to 100 scale, with 100 representing an excellent pavement.
- The National Bridge Inventory (NBI), which assigns a rating between 1 and 9 based on the deterioration present in each element (deck, superstructure, substructure and culvert).
- A LOS rating of A to F for maintenance assets, such as the percent blockage in a culvert or the percent of guardrail not functioning as intended.
Maintaining asset condition information is important for evaluating performance to determine whether improvements are needed to achieve the agency’s strategic objectives. The lack of current condition information, or a lack of confidence in the condition information, makes it difficult to present investment needs to stakeholders with any degree of confidence.
Asset Performance
The results of condition surveys or inspections are used to evaluate the performance of each asset in terms generally understood by stakeholders, such as Good, Fair or Poor.
It is common for transportation agencies to report the percent of the network in Good or Fair condition or the percent of drivers traveling on roads in Good and Fair condition. Asset performance can also be reported in terms of a health index, such as the Remaining Service Life (RSL) used by some state DOTs to indicate the amount of serviceable life left in the asset. In the maintenance community, some state DOTs have developed a Maintenance Health Index or overall LOS grade to represent the performance of the entire Maintenance Division rather than report the grades of each category of assets separately.
Asset performance also influences overall system performance, as demonstrated by the impact on system reliability associated with unplanned road or bridge closures due to flooding or an on-going lack of maintenance. Performance data related to delay, unplanned closure frequency, GHG emissions, and crash locations may all be impacted by asset conditions and affect an agency’s ability to achieve its broader, strategic performance objectives such as system reliability, congestion reduction, environmental sustainability, and freight and economic vitality. For example, it is important to monitor performance characteristics such as travel time reliability to determine whether capital improvements are needed to add additional lanes or whether ITS assets could improve traffic flow during peak periods.
Ohio DOT
The Ohio DOT recognizes the importance of integrated management systems to support both life cycle and comprehensive work planning activities. One of the tools developed by the Ohio DOT is its Transportation Information Mapping System (TIMS), which enables planners, engineers and executives to access and manage key asset, safety and operational data in an integrated web-mapping portal (https://gis.dot.state.oh.us/tims). The portal is available to both internal and external stakeholders and allows users to access information about the transportation system, create maps or share information. The data integration efforts enabling TIMS are now underpinning all management system implementations.
Maintaining Asset Data 6.2.2
This section describes several approaches to keeping asset inventory and condition information current, so it can be used reliably to track accomplishments and evaluate current and future needs. The methodologies used to collect the asset information is discussed in Chapter 7.
Maintaining Inventory Information
One of the challenges transportation agencies face is keeping their asset inventory current, because it can require business processes dependent on individuals or agency work areas that differ from the primary asset owners. For example, construction may be responsible for installing new guardrails as part of a pavement-resurfacing project, but the information is not always made available to the maintenance division responsible for budgeting and scheduling guardrail repairs.
Establishing Processes to Update Inventory Information
Some types of inventory information change regularly while other information changes infrequently. As a result, it is important to classify each type of data and establish procedures in order to ensure the inventory is updated as information changes. An agency should establish business processes to ensure any changes to the inventory are reflected in relevant databases. For example, each time a pavement improvement project is completed, the database should be updated with information about the new surface type, the project completion data and the other assets replaced as part of the project. Establishing these processes and holding individuals responsible for updating this information are important for the ongoing success of a performance-based management approach.
Maintaining Condition Information
Asset condition and performance information must also be updated on a regular cycle. In some cases, data collection cycles are mandated by regulations, such as federal requirements for reporting pavement and bridge condition information on the National Highway System. Where there are no requirements in place for condition reporting, the update frequency should be determined based on the resources available, how the asset is managed and the data analysis cycle. Different update frequencies may be established for different types of assets.
Asset condition information may be collected based on a regular interval schedule or an inspection may be triggered based on the asset’s condition. For example, an asset in poor condition may require inspection more frequently than an asset in good condition. In general, asset information is updated on a 2- to 4-year cycle, but in some cases asset data is collected more frequently. For instance, some agencies collect performance data on maintenance assets several times a year to ensure they are in good working order and performing as expected. The condition of other assets with a slower rate of deterioration may be conducted less frequently.
Virginia DOT
The Virginia DOT maintains most of the assets on state roads and regularly assesses the condition of those assets for determining investment needs. For pavements and bridges, there are asset leads at both the central office and in the districts to monitor conditions and update the database based on work completed. Asset leads at the central office manage statewide data monitoring and analysis and provide guidance on the work that is needed. The asset leads in the districts are responsible for implementing the work and recording completed work in the bridge and pavement management systems so the information is always current.
TAM Data and Systems 7.1.1
Often organizations maintain data on inventory, condition and needs for individual asset classes in separate, self-contained systems. However, increasingly it is necessary to integrate asset and related data distributed across multiple systems to support decision-making.
As discussed in Chapter 6, there are several different types of information needed for TAM decision making. These include:
- Asset inventory and design information including location, type, quantity, material, and design details. This also includes summary level information about the asset as a whole as well as information about individual asset components (e.g. different pavement layers or bridge elements). It may also include asset valuation information (calculated based on deteriorated replacement cost, historic cost, or fair market value).
- Asset condition and performance information including results of visual inspections, measured condition (such as roughness or cracking for pavements), and computed measures of performance (such as remaining service life or “deficient” status designation). This also includes aggregated network level measures (such as the percentage of pavement in good condition).
- Contextual information such as system or network characteristics, functional classification, highway geometric characteristics, traffic volumes, congestion and reliability, crash history, adjacent land uses, weather and features of the natural environment. This information is helpful for understanding factors that may impact the asset service requirements or goals, physical deterioration, funding eligibility, and/or project needs and constraints.
- Work information including date, cost and scopes of work proposed, scheduled and completed on assets – including installation, replacement/reconstruction, rehabilitation, preservation and maintenance. When projects include multiple assets, it is valuable to itemize the work performed by asset.
- Revenue and funding allocation information including historical and forecasted funds available for asset installation, replacement/reconstruction, rehabilitation, preservation and maintenance – by source; and historical allocations by asset category and work type.
- Analysis information including forecasted condition and needs under varying funding or program scenarios, treatment life or life extension results, or project prioritization ratings or rankings.
Agencies store and manage TAM-related data within several different information systems:
- Asset Management Systems (AMS) – this includes pavement management systems (PMS), bridge management systems (BMS), management systems for other specific asset classes (sign or signal management systems), and systems used to manage information for multiple asset classes. All of these systems are used to store inventory and inspection data, and track work performed on an inventory of assets. They also typically include contextual information needed for modeling and analysis, such as traffic, functional classification, number of lanes, and presence of a median. More advanced management systems may identify and forecast preservation and rehabilitation or replacement needs, and analyze funding scenarios. However, often agencies use multiple systems for this purpose, with separate systems for maintaining the asset inventory and predicting future conditions. Pavement and bridge management systems are typically used as the sources for federal Highway Performance Monitoring System (HPMS) and National Bridge Inventory (NBI) reporting.
- Maintenance Management Systems (MMS) – used to plan and track routine maintenance activities. These systems typically store information about planned and completed maintenance activities and resources (labor, materials, equipment) consumed. MMS may include customer work requests, work orders, and maintenance level of service (LOS) information. Some MMS do not store any asset inventory data. In such cases, work is tracked by maintenance activity category and route section rather than specific asset. Note that there are many commercial Asset Management Systems that provide full functionality for asset inventory, inspection/condition assessment, work planning, and work tracking.
- Program and Project Management Systems (PPMS) – used to manage information about capital and major maintenance projects from initial planning and programming through completion. There may be separate systems for managing programming/funding information, preconstruction/design information and construction phase information. Some agencies integrate data from these various systems to obtain a single source of project information. Project information typically includes a mix of tabular data as well as unstructured data (for example, documents and images). Unstructured data may be managed within an engineering content management system separately from other data.
- Financial Management Systems (FMS) – used to manage and track revenues, expenditures, budgets, grants, payments, receipts, and other financial information. These systems are often supplemented with special purpose tools supporting budgeting, revenue forecasting and analysis.
- Enterprise Resource Planning Systems (ERP) – incorporate features of financial systems as well as a wide variety of other modules for functions including human resources, payroll, purchasing, maintenance management, inventory management, equipment management, project programming, project financial management, and revenue forecasting.
- Highway Inventory Systems (HIS) – used to store and report administrative and physical characteristics of the roads and highways. Federal Highway Performance Monitoring System (HPMS) requirements and the Model Minimum Inventory of Roadway Elements (MIRE) define standard road inventory elements; some DOTs maintain additional elements. HPMS elements include pavement type, pavement condition (roughness, cracking, rutting and faulting), and structure type. These systems may include Linear Referencing System (LRS) management capabilities or, may be integrated with a separate LRS management system. Per FHWA’s All Roads Network of Linear Referenced Data (ARNOLD) requirements, state DOTs must submit an LRS for all public roads to FHWA, linked to their HPMS data.
- Crash Data Systems (CDS) – used to store and report data about collisions and resulting injuries and fatalities; which when combined with traffic data and road inventory data provides information for identifying traffic and safety asset needs.
- Traffic Monitoring Systems (TMS) – used to store and report traffic data, required for federal reporting and used for a wide variety of purposes, including TAM processes for asset deterioration modeling, treatment selection and prioritization.
- Engineering Design Systems (EDS) – used to create design drawings or models including design details for different assets. As agencies adopt 3D object-based design modeling practices, there are opportunities to share information about assets between design models and other asset data systems used across the life cycle.
- Enterprise Geographic Information Systems (GIS) – used to manage spatial information, including asset location. Assets may be represented as point, linear or polygon features; location may be specified based on coordinates and/or based on a linear referencing system (LRS). Asset features maintained within GIS may be linked to asset information within other systems.
- Imagery Databases (ID) – used to store highway video imagery and mobile LiDAR data that can be used for manual or semi-automated extraction of asset inventory.
- Data Warehouses/Business Intelligence Systems (DW/BI) – used to integrate data from source systems for reporting and analysis. These may be tailored for TAM decision support.
- Other – there may be other specialized decision support tools that produce analysis results – for example, tools for life cycle cost analysis, cross-asset optimization, or project prioritization.
TIP
Taking stock of what data and information systems supporting TAM is a critical first step to take before pursuing data integration and system development initiatives.
Table 7.1 provides an overview of different systems with the types of information they typically contain. Note that this may vary within each agency.
Table 7.1 - TAM Data and Systems Overview
| Asset Inventory, Condition, and Performance | Contextual | Asset Work Information | Revenue and Funding Allocations | Analysis Results | |
|---|---|---|---|---|---|
| Asset Management Systems | • | • | • | • | • |
| Maintenance Management Systems | • | • | • | • |
|
| Program and Project Management Systems | • | • | • |
||
| Financial Management/ERP | • | • | • | ||
| Road Inventory Systems/HPMS | • | • | • | • | |
| Crash Databases | • | ||||
| Traffic Monitoring Systems | • | ||||
| Engineering Design Systems | • | ||||
| Enterprise GIS Databases | • | • | • | • | |
| Imagery Databases | • | ||||
| Data Warehouses/BI | • | • | • | • | • |
| Other | • |
Common components included in computer-based asset management information systems are shown in Figure 7.1. Network inventory, network definition (e.g., location), and asset condition information serve as the primary components in a database, which may or may not be external to the management system. Agency-configured models are used to predict changes in asset condition over time and to determine what treatments are appropriate as the assets age and deteriorate. These models may be developed and updated based on historical condition and cost data.
When developing a computer-based model, an objective (performance, condition, financial, risk) must be defined within the model for it to evaluate these criteria to develop and select optimal strategies. Metrics such as benefit-cost, risk, condition and treatment costs are often used.
A typical pavement management system performs some type of benefit/cost analysis that determines the performance benefits (typically in terms of improved condition) and the costs associated with each possible treatment timing application. By selecting the projects and treatments with the highest benefit/cost ratio, an agency can demonstrate that it is maximizing the return on its investment.
Bridge management systems more typically rely on optimization to perform a single-objective analysis, such as minimizing life cycle costs or maximizing condition, or a multi-objective optimization analysis that considers factors such as condition, life cycle cost, risk of failure, and mobility. Project- and/or network-level benefit/cost analyses are used in a bridge management system to explore all feasible treatment options over an analysis to determine the most cost-effective set of treatments with the highest benefits to the network.
TIP
Start by defining what questions the agency wants to answer and then make a plan for how data across systems could be integrated to answer these questions.
Figure 7.1 Typical Management System Components
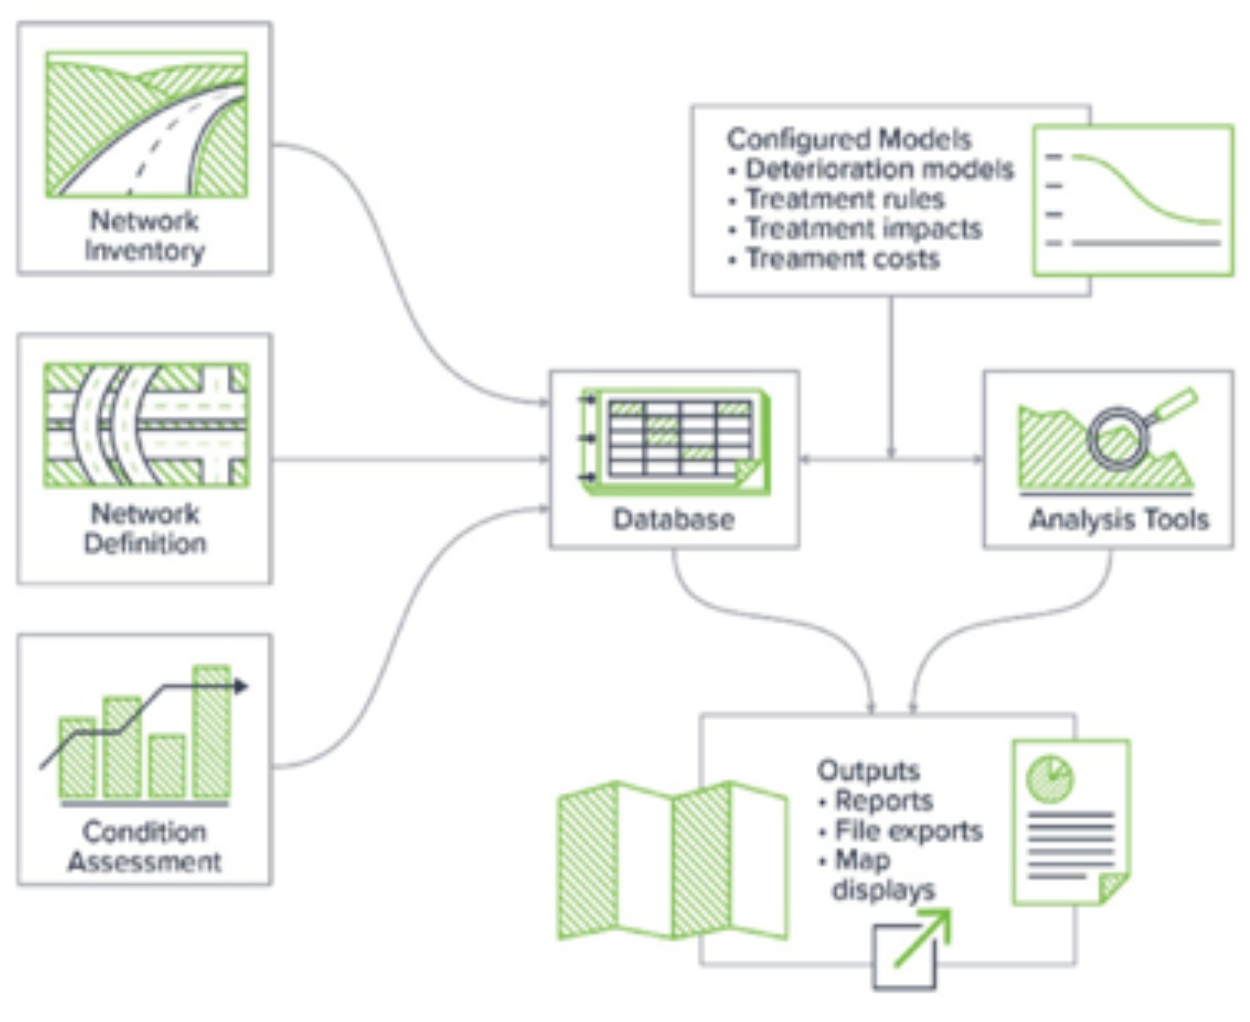
Source: Applied Pavement Technology, Inc. 2018.
Figure 7.2 shows an example of how the different systems listed in Table 7.1 might be integrated, adapted from the approach used by a U.S. state DOT.
Figure 7.2 Data Integration Example
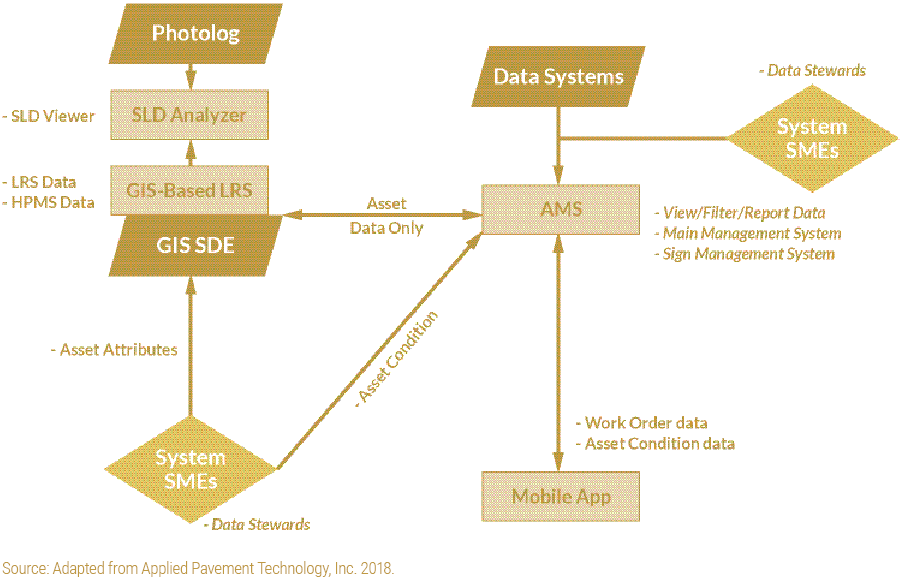
Source: Adapted from Applied Pavement Technology, Inc. 2018.
Why Integrate? 7.1.2
Integrated views of asset information enable insights that lead to better decisions. Information produced by one part of the agency can support decision making across the agency.
Linking information across different systems enables agencies to quickly answer important questions that might have taken hours of staff time without integrated data. Integrating data opens up access to previously siloed data sets across the organization. It allows an agency to reduce duplicative effort, achieve efficiencies and derive greater value from its data. Some questions that rely on integrated data are:
Investments and Accomplishments
- What have we spent over the past ten years on route X in county Y (across all assets and including both maintenance and rehabilitation)?
- What percentage of deficient pavements will be addressed by our current capital and major maintenance programs?
Work Costing and Scoping
- What does it cost us to restripe a mile of pavement markings in each district?
- What locations identified along the linear referencing system (LRS) are planned for next year?
- Do the costs estimated by our pavement management system match what we are actually seeing in our projects?
- If we upgrade our guardrails whenever we do a paving project, how long will it take, and what will it cost to eliminate the current backlog?
- How can we best plan our projects to address multiple needs that may exist along a corridor?
Performance
- How many years does our standard mill and fill pavement treatment last for roads in different traffic volume categories?
Tradeoffs and Prioritization
- How should we prioritize our asset replacement/rehabilitation projects, considering not only life cycle management strategies but also stormwater management, safety, congestion, non-motorized, transit and ADA needs?
- How should we allocate our available funds across multiple asset types?
Disaster Recovery
- What assets were on route X in county Y prior to the storm? What will it cost to replace them?
An integrated approach to asset data collection, management and reporting not only makes it easier to answer these questions; it also can reduce costs. Opportunities for achieving efficiencies include:
- Using a single application to manage information about multiple assets.
- Using Data Warehouse/BI and GIS tools to provide reporting and mapping functions rather than investing effort to develop these capabilities within individual asset management systems.
- Gathering data on multiple assets through the same approach – using mobile technology, video imagery and/or LiDAR (see section 7.2)
- Sharing asset data across the life cycle – for example, automating methods for extracting asset data from design plans to update asset inventories (described further below).
Emerging technologies and new data sources are making an integrated approach to asset data management even more important. For instance, there are increasingly opportunities to use data collected from cell phones and connected vehicles that may cut across many asset categories. Also, there has been and will likely continue to be rapid advancement in machine learning techniques, such as for extracting asset data from video imagery or predicting optimal maintenance interventions given a wide array of data. Using these techniques typically requires establishing large, integrated data sets.
In addition, advances in computer-aided design and engineering software are making it possible to integrate asset data across the life cycle and achieve efficiencies and cost savings in maintaining asset inventories. See the discussion in section 7.1.4 further on.
TIP
Integrating information systems can be approached incrementally. Have a long term goal in mind and find opportunities to move towards this goal as systems are upgraded or replaced.
Ohio DOT
Ohio DOT has separate pavement and structures management systems, but integrates both asset and project information within its Transportation Information Management System (TIMS). A separate Transportation Asset Management Decision Support Tool (TAM-DST) allows for a user to combine data from TIMS with other state-maintained data sets to perform analysis and reporting. The application allows for one to consume large quantities of data in a timely manner to help make better choices in planning. See practice examples in Section 2.2.4 and Section 6.2.1 for more information on TIMS.
Planning for TAM Information Integration 7.1.3
There are different levels of integration. In the short term, agencies can integrate the information they already have. In the longer term, agencies can modify and consolidate their information systems. Integrating data for TAM should be approached systematically to ensure agencies achieve a solution that meets their needs and is ultimately sustainable.
Step 1: Establish Requirements
What is the purpose of the integration? To create a publicly available map showing asset conditions and projects for both internal and public use? To create a BI environment for answering a range of questions about asset performance and cost? To integrate asset data across different systems used for planning, design, construction, and maintenance?
Based on the identified needs, determine what data will be integrated and at what frequency. Consider whether this will require historical data, current data, future projections, or a combination.
Early collaboration between business units and information technology units is important to establish a shared understanding of both business needs as well as technical requirements and constraints. A strong business-IT partnership is essential for successful information integration initiatives.
Step 2: Identify and Evaluate Data Sources
Identify the available data sources to meet requirements. Determine where the data reside, and in what form – such as engineering design systems, relational databases, spreadsheets, document repositories, etc. Assess the current level of data quality to make sure that the source is ready for integration, based on discussions with the data steward or through examining the data. For design files/models a key quality consideration is whether established standards have been consistently applied. It is also important to determine the level of spatial and temporal granularity – or what does each record represent (such as a pavement condition observation for a 0.1 mile section for April 2019; a paving project on a 1.5 mile section due to open for traffic sometime in 2020).
Step 3: Analyze Linkages
Identify how different data sources will be linked. Spatial linkages are a good place to begin. If GPS coordinates are used, make sure that the Coordinate Reference System (CRS) used is documented, along with positional accuracy. If a Linear Reference was used, determine what method was used to establish the measure along the route, and what version of the agency’s LRS was used to establish route identifiers and reference points. Find out if the linear reference has been updated to reflect changes in the LRS since the data were last collected (if applicable).
TIP
Set standards for how assets and work activities will be linked to GIS/LRS locations. Then create processes and tools to make sure these standards are followed.
Identify other types of (non-spatial) linkages that may be needed to join different data sources – for example, project numbers, account codes, work order numbers, etc. Agencies may want to profile the data for these elements to understand variations in coding and formats.
Step 4: Design Data Flows and Select Technology Solutions
Based on the requirements, available data, the linkage analysis and the tools and resources available within the agency, design how the data will flow from sources to target systems, and select the technology solutions to be used for performing the integration itself. The target system might be a general purpose enterprise geodatabase, an enterprise asset management database, a BI tool reporting data source, data warehouse, or a data lake. Data Extract-Transform-Load tools are available from data warehouse vendors; simple integration tasks may be accomplished through scripting. There are also a variety of specialized tools available for transforming and combining spatial data, and for extracting data from CAD/3D models.
Step 5: Design and Implement Integration Methods
Develop the technical approach for transforming link fields so that they are consistent across databases and if applicable, joining the different data sets and combining common data elements from the different sources. This may involve spatial processing (such as dynamic segmentation), aggregation, coding conversions, and other transformations.
Short term integration strategies include:
- Creating GIS data layers and making them accessible in available web and desktop-based GIS software. This strategy requires that each data source uses compatible spatial referencing, or can be converted to a common referencing system.
- Creating a database or view combining data from various source systems, and using available BI/Reporting tools to create reports and data visualizations. This strategy requires identifying common “dimensions” across source systems and/or normalizing data so that it can be summarized. For example, if the agency wants to report asset quantities by district or county by year, it will be necessary to make sure that each source has these data elements and that the data can be converted to a consistent set of values.
- Exposing data from authoritative sources as services via Application Programming Interfaces (APIs).
In the longer term, agencies can consider re-architecting or consolidating their systems so that they work better together. A logical way to approach this is to document the “as is” situation and then map out a “to be” architecture. This will allow the agency to chart a path from the current state to the desired future state. It will also provide a framework for capturing requirements for any new systems that are brought into the agency.
Integrated asset management systems are not a new concept and there are several commercial systems that support information management and work planning for multiple asset types. However, some agencies are challenged to integrate information about major assets (pavements and bridges) with information about various other ancillary assets – given that approaches to planning and budgeting for major assets are more sophisticated and require a greater level of detailed information and analysis. Also, it can be a challenge to integrate information about operations and maintenance with capital projects given differences in how work is categorized, performed, and tracked.
TIP
Find opportunities to save on data collection costs by capturing asset information during project design and construction.
Kansas DOT
KDOT’s architecture was based on a value chain model that represents the agency’s business components and relationships. It included a set of “context diagrams” showing information flow across systems and actors for major subject areas including highway asset systems, long range planning, pre-construction, construction and maintenance. While an architecture does require significant effort to create and maintain, it provides a more global and stable view of business processes and information needs than what would be produced through a piecemeal, incremental approach to system upgrades and replacements. This view can be used to plan the path from the existing set of systems to a more efficient and integrated set.
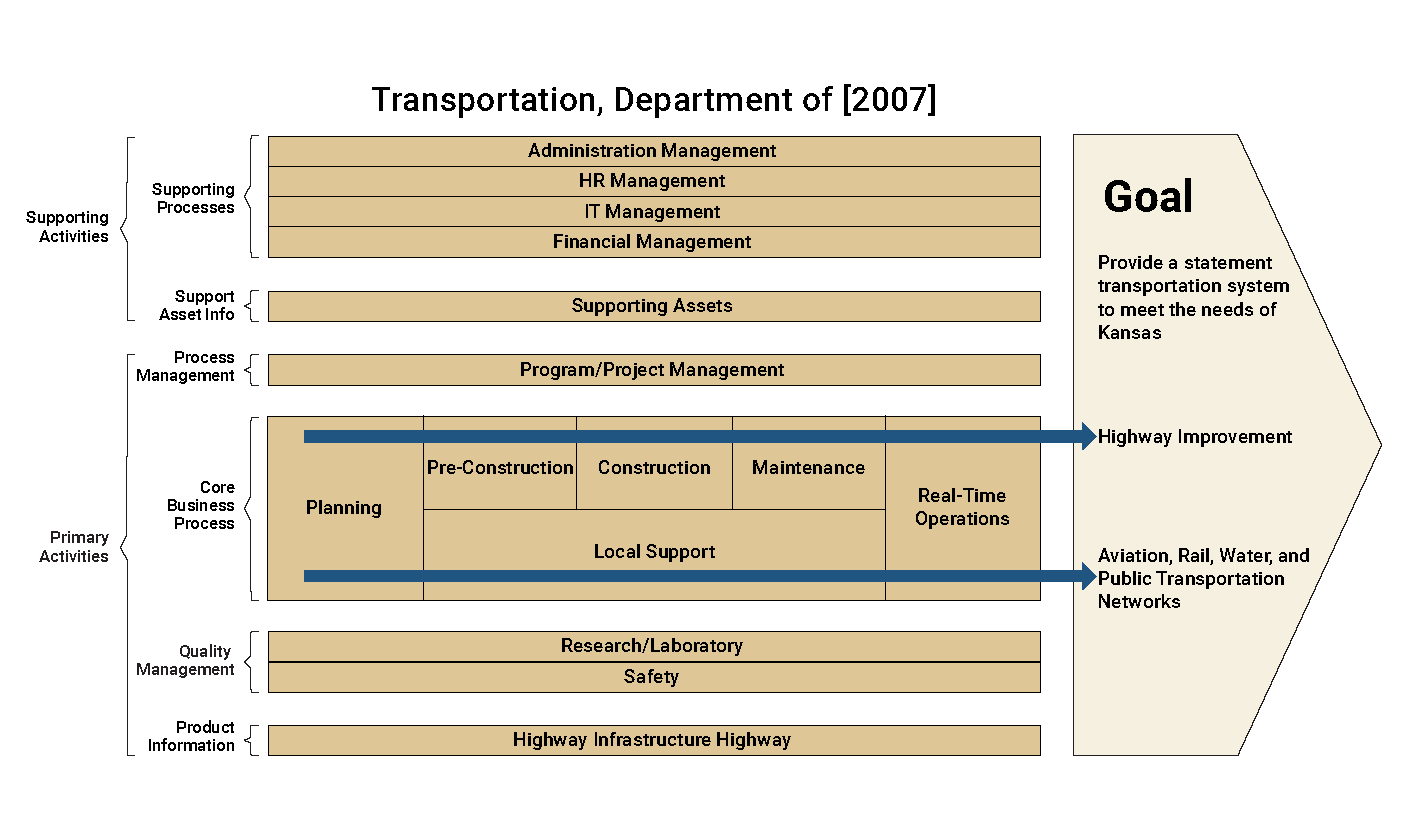
Source: Adapted from Kansas Department of Transportation. 2003. Enterprise IT Architecture
Integrating Asset Information Across the Life Cycle 7.1.4
As assets are designed, created, maintained, restored, and replaced, different systems are typically used to keep records of asset characteristics, conditions and work. Ideally, information created at one stage of the asset life cycle is made available for use at the next stage. Techniques, tools and processes are available to manage data for an asset over its entire life cycle from construction or acquisition to disposal.
Integrating information across the transportation infrastructure life cycle is an area of significant interest in the transportation industry. Several terms have been used to describe the collection of processes, standards and technologies for accomplishing such integration – including Civil Integrated Management (CIM) and Building Information Modeling (BIM) for Infrastructure. In 2019 ISO issued its first BIM standard, ISO Standard 19650. This builds on an earlier standard published by the British Standards Institute (BSI).
Traditionally, information created at one phase of the life cycle is archived and not made available to downstream processes. There are substantial opportunities for cost savings by using a shared, electronic model of the infrastructure, defining information needs at each life cycle phase, and establishing procedures for information handoffs across the life cycle. For example, information about assets included in a construction project can be compiled during design and linked to the model representations of the assets. This information can be confirmed and corrected during construction and made available to asset management systems when the project is completed and turned over to maintenance and operation.
Such integration can reduce duplicative data collection efforts, and speed the time required to make decisions and perform work. Implementing these techniques requires much more than adoption of technology supporting 2D and 3D models. A commitment to common standards and processes is needed. Recognizing that this scale of change takes time, maturity models and levels of implementation have been defined to guide agencies in developing roadmaps for enhancing life cycle information integration over time. See the references at the end of this chapter for further information.
Figure 7.3 Integrated Workflow Model for Sharing Information Across the Life Cycle Components
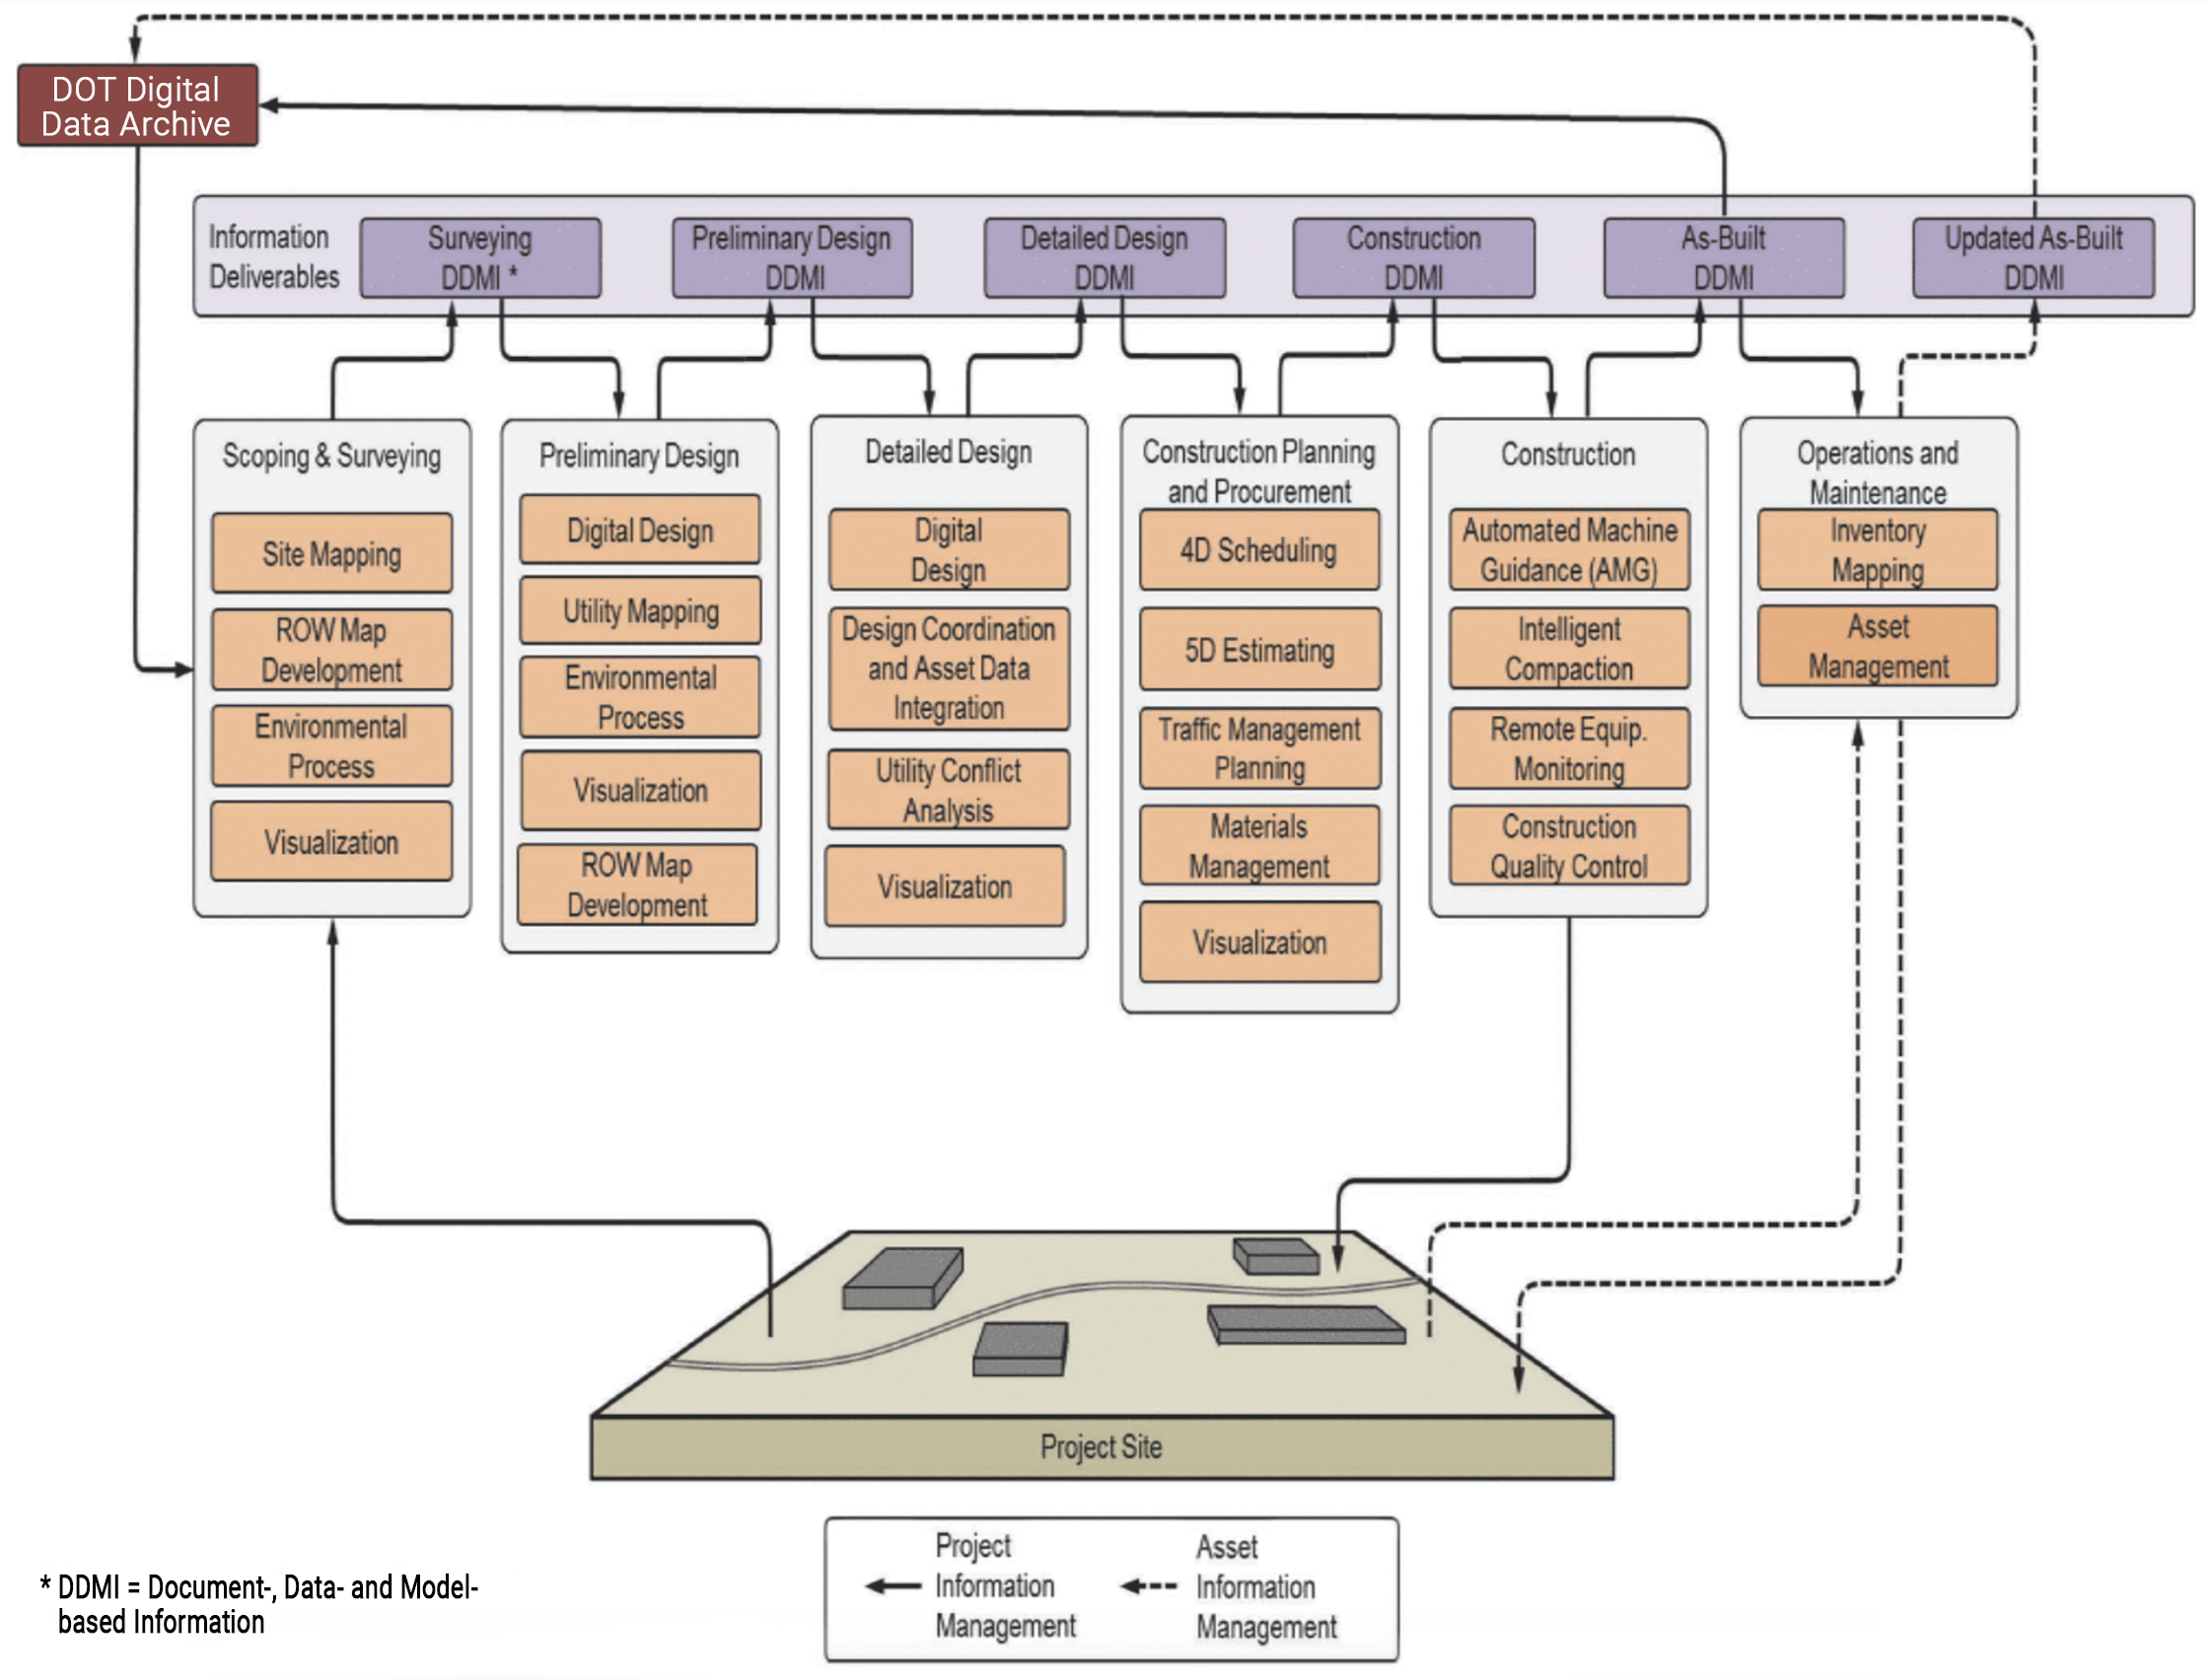
Transportation Research Board. 2016. Civil Integrated Management (CIM) for Departments of Transportation, Volume 1: Guidebook. https://www.nap.edu/read/23697/chapter/5#16
CrossRail & Transportation for London
Crossrail is a major design-build project to construct a new railway line across central London (UK). It includes 42km of track and 10 new underground stations. Project construction began in 2009. The project is being delivered by Crossrail Limited (CRL), currently a wholly owned subsidiary of Transport for London (TfL). Once the project is complete it will be operated by TfL as the Elizabeth Line. The Crossrail project provides a good example of the application of several BIM elements. Early on, CRL established the following objective:
To set a world-class standard in creating and managing data for constructing, operating and maintaining railways by:
- Exploiting the use of BIM by Crossrail, contractors and suppliers
- Adoption of Crossrail information into future infrastructure management (IM) and operator systems
CRL established a Common Data Environment (CDE) with integrated information about the project and the assets it includes. This environment included CAD models, separate linked databases containing asset details, GIS data, and specialized applications for scheduling, risk management and cost management. Data warehousing techniques were used to combine and display integrated information. Considerable work went into defining asset data requirements and setting up standard, well documented data structures and workflows to provide an orderly flow of information from design through construction, and on to maintenance and operation. It was essential to create a common information architecture given that work on each of Crossrail’s nine stations was conducted by different teams, each consisting of multiple contractors. Each station was comprised of over 15,000 individual assets.
Key elements of the approach included:
- A common asset information database with standard templates for deliverables. This database serves as the “master data source from which playlists of information can be created.”
- An asset breakdown structure (ABS) that relates facilities (e.g. stations) to functional units (e.g. retaining walls) to individual assets (e.g. steel piles).
- Asset naming, identification and labeling standards that distinguish functional duty requirements (e.g. a pump is needed here) from specific equipment in place fulfilling these requirements.
- Asset data dictionary definition documents (AD4s) that lay out the specific attributes to be associated with different types of assets, based on the ABS.
- Sourcing of the asset data from design and as-built information.
- A Project Information Handover Procedure specifying the methods of data and information handover for maintenance and operations once the construction has been completed.
- Use of a common projected coordinate system for CAD and GIS data
- Use of a federated data model in which information was maintained within separate special purpose systems, with a common master data model enabling sharing and interpretation of data from the different sources. The master model included elements such as time periods, budget and schedule versions, organizations, data owners, contractors, milestones and key events.
Sources:
https://learninglegacy.crossrail.co.uk/documents/building-a-spatial-infrastructure-for-crossrail/
BIM Lifecycle Information Management
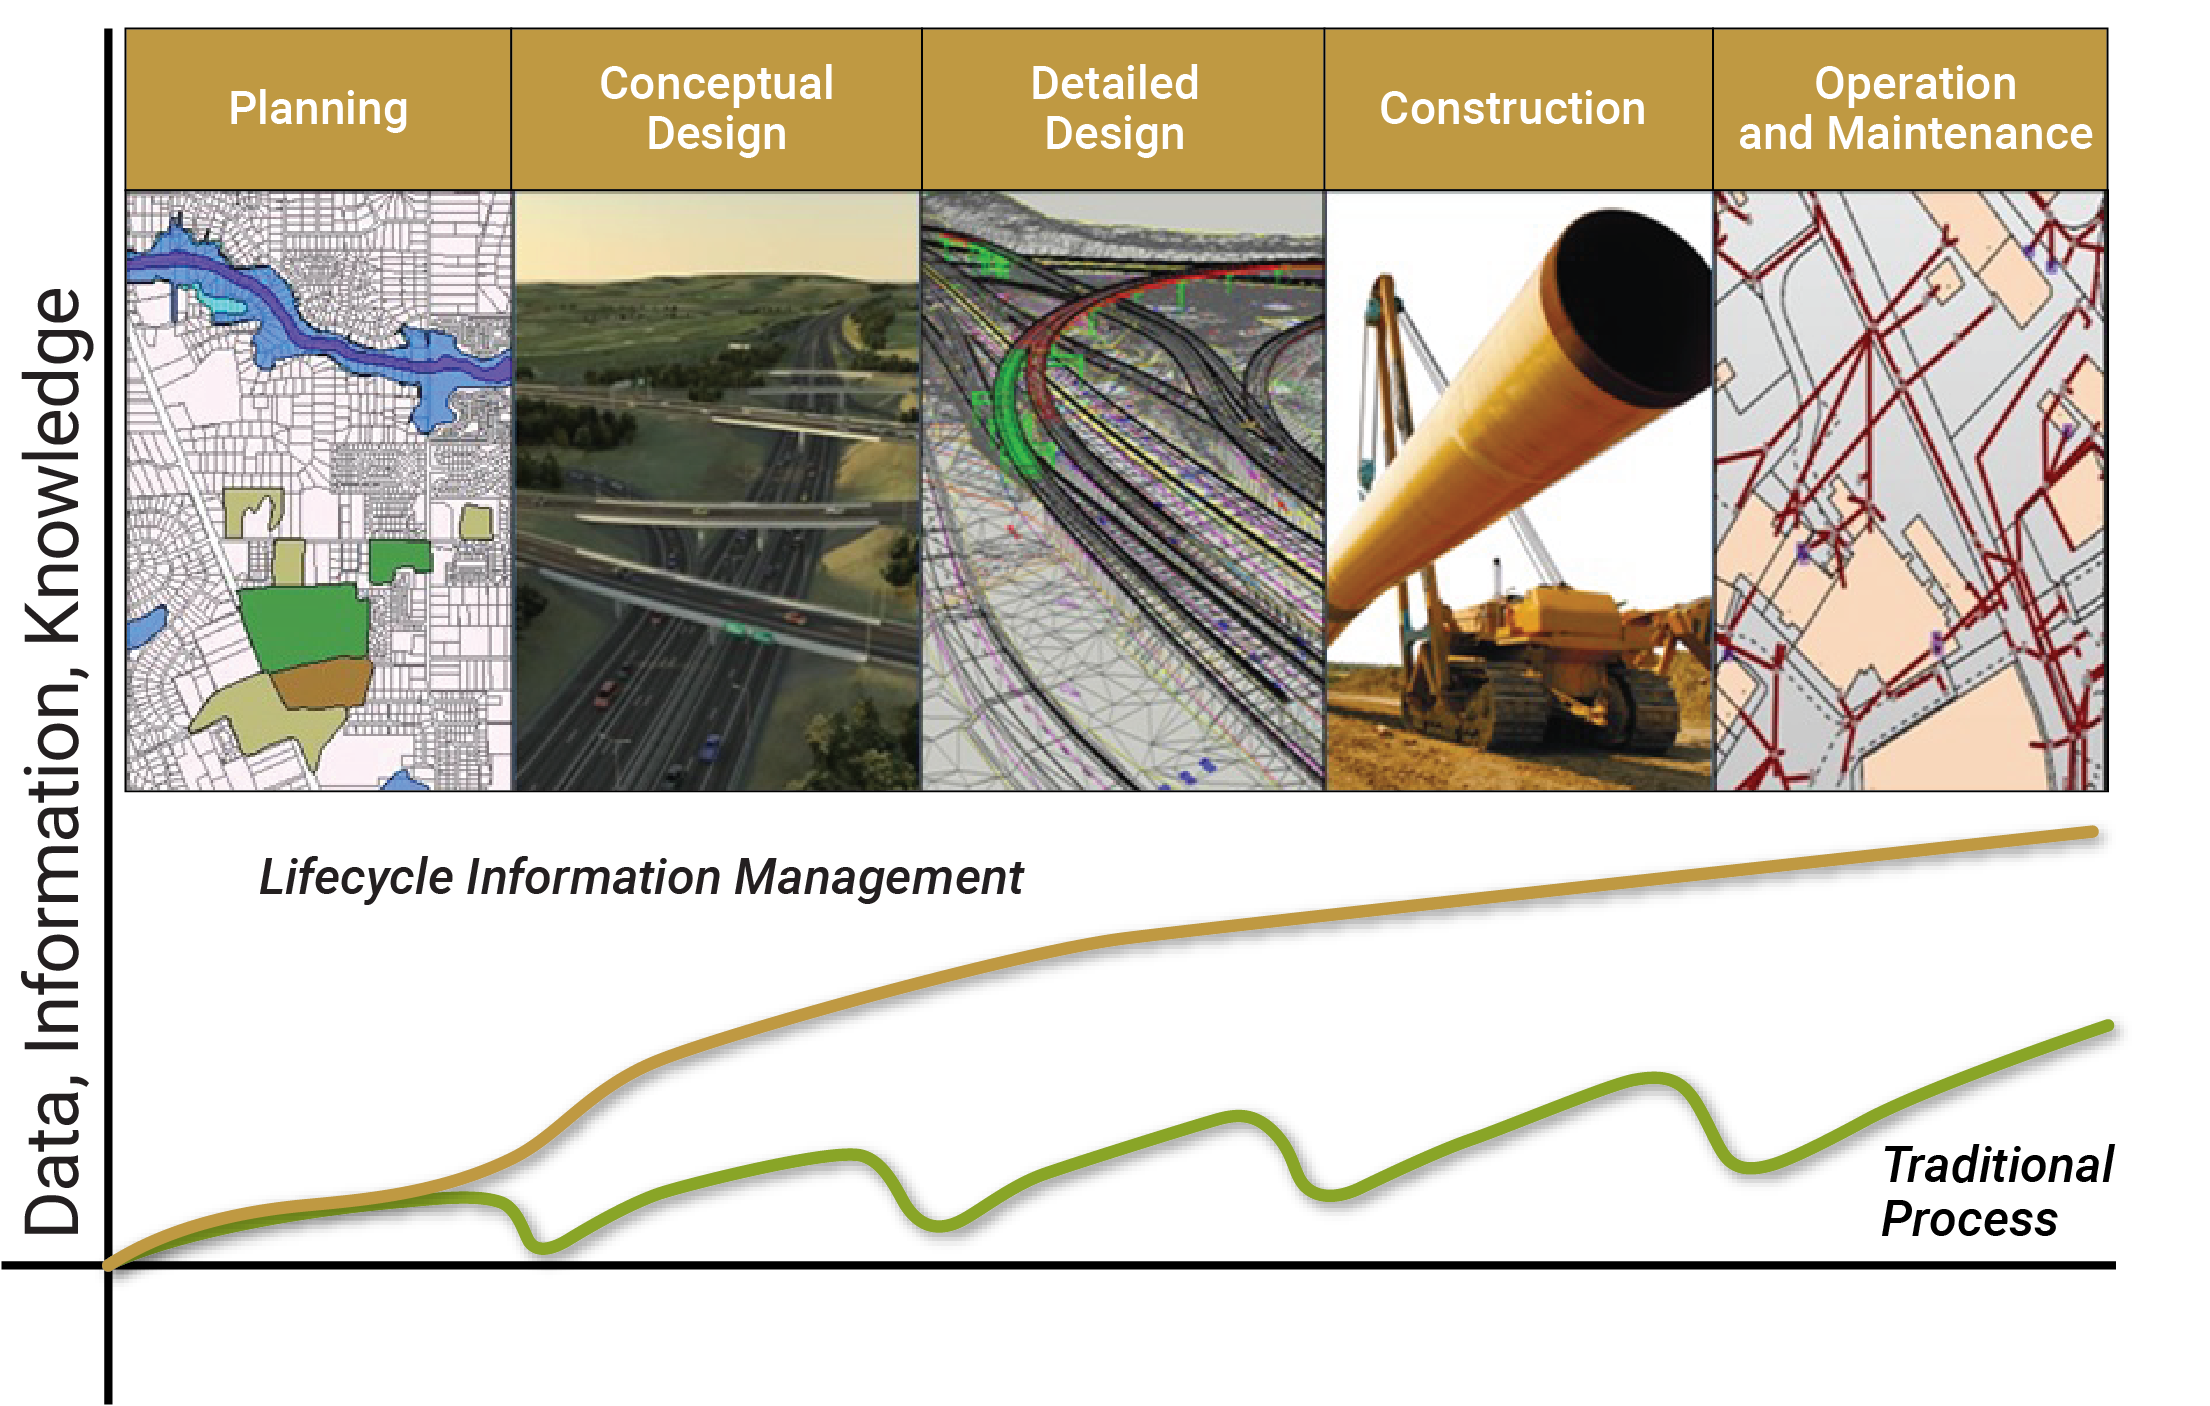
Source: Adapted from Crossrail. 2016. Building A Spatial Data Infrastructure For Crossrail. https://learninglegacy.crossrail.co.uk/documents/building-a-spatial-infrastructure-for-crossrail/
TAM Data Guide 7.1.5
This subsection highlights the importance of effective data and information systems in supporting Transportation Asset Management (TAM) programs. It introduces the NCHRP Report 956 and AASHTO TAM Data Guide, which offer a structured approach for assessing current TAM data practices, identifying improvements, and planning implementation strategies. The guidance includes practical tips, supporting materials, templates, and real-world implementation examples to help transportation agencies enhance their TAM data management.
Overview
Transportation agencies are facing increasing pressure to make more effective use of data and information systems to support their TAM programs. Addressing this need, NCHRP Project 08-115 produced NCHRP Report 956, a Guidebook for Data and Information Systems for Transportation Asset Management. AASHTO hosts web-based versions of the guidebook and tools, where subsequent implementation guidance and DOT implementation experiences have also been shared.
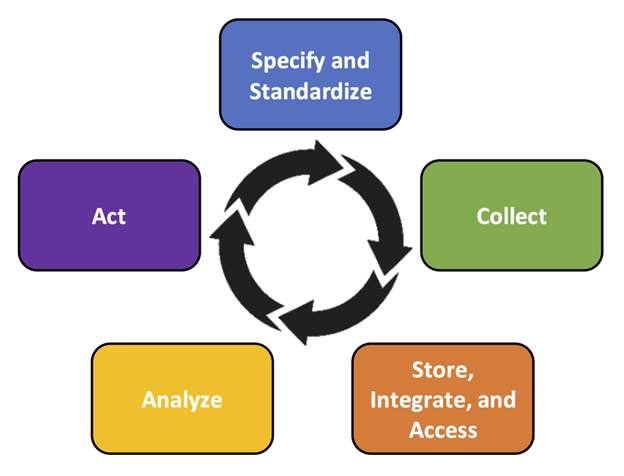
Built upon a data life-cycle framework which addresses five distinct stages in the use of data for TAM, the NCHRP Report 956 and associated AASHTO TAM Data Guide provide a structured approach for transportation agencies to:
- Assess current TAM data and information system practices and establish a desired state.
- Identify and evaluate data and information system-related improvements.
- Secure agency support for improvements and plan an implementation strategy.
Figure 7.4 Stages in the Use of Data for TAM
This guidance is supplemented with valuable support materials, including:
- Practical implementation tips to support the TAM data and information system assessment, improvement selection and evaluation, and action planning processes.
- Supporting materials and templates (such as assessment scoping guidance, stakeholder engagement and facilitation materials, and assessment summary and action planning templates).
- User guidance, quick reference materials, and tutorial videos to guide tool use and application.
- Research implementation examples based on four real-world implementations of the guidance at the New Hampshire, New Mexico, and Virginia DOTs.
Other Related Methodologies
For those exclusively focused on better understanding and improving how they manage their TAM data, NCHRP Project 20-44(12) was completed in 2022, providing improved tools, supplemental guidance, materials, and detailed case studies on implementation of the NCHRP Report 814 Data Self-Assessment Guidance. The outcomes of this project included detailed agency-specific assessment experiences, including several applications of the data management maturity and data value assessment frameworks in TAM-specific contexts.
New Hampshire DOT
The New Hampshire DOT (NHDOT) was interested in improving data and information systems to enable better alignment between bridge preservation decision-making approaches with those used for bridge rehabilitation and replacement. This TAM Data Assessment was conducted in anticipation of advancements in data and modeling detail and better integration of bridge asset management and bridge design systems and models. At the time of the assessment, a new bridge management system was being implemented, presenting a unique opportunity to advance data and information system practices.
*Note: This practice example was derived from NCHRP Final Research Implementation Report 1076: A Guide to Incorporating Maintenance Costs into a Transportation Asset Management Plan. More TAM Data Assessment research implementation examples are available at: https://www.tamdataguide.com/research-implementation-examples/
New Mexico DOT
New Mexico DOT (NMDOT) had recently implemented a new data-driven methodology to prioritize proposed capital projects. The agency wanted to use the TAM Data Assessment to identify data and information system improvements to advance and sustain District implementation of the new approach and prioritization outcomes.
*Note: This practice example was derived from NCHRP Final Research Implementation Report 08-115: Guidebook for Data and Information Systems for Transportation Asset Management. More TAM Data Assessment research implementation examples are available at: https://www.tamdataguide.com/research-implementation-examples/
Virginia DOT
This TAM Data Assessment examined the Virginia DOT maintenance management system to identify how current functionality could be expanded to support broader asset management of roadside assets.
*Note: This practice example was derived from NCHRP Final Research Implementation Report 08-115: Guidebook for Data and Information Systems for Transportation Asset Management. More TAM Data Assessment research implementation examples are available at: https://www.tamdataguide.com/research-implementation-examples/
Virginia DOT
Virginia DOT (VDOT) has a long standing and high functioning Pavement Management program. This program is organized around a well-established pavement management system (PMS) and pavement maintenance scheduling system (PMSS). These systems are used by Central Office and District staff to forecast pavement conditions, allocate resources, and plan targeted preventative, corrective, and restorative maintenance projects. Although VDOT staff were confident in their program, they were motivated to identify if further improvement would be possible through data and/or system improvements.
*Note: This practice example was derived from NCHRP Final Research Implementation Report 08-115: Guidebook for Data and Information Systems for Transportation Asset Management. More TAM Data Assessment research implementation examples are available at: https://www.tamdataguide.com/research-implementation-examples/
Deciding What Data to Collect 7.2.1
Many organizations have recognized that data should be viewed as an asset. Before acquiring new data, it is important to establish a clear statement of how the data will be used and what value it is expected to provide.
Deciding what data to collect involves identifying information needs, estimating the full costs of obtaining and managing new data and keeping it up to date, and then determining whether the cost is justified. Just as agencies don’t have unlimited resources to repair and replace their assets, there are also limitations on resources for data collection and management.
A 2007 World Bank Study summarized three guiding principles for deciding what data to collect:
- Collect only the data you need;
- Collect data to the lowest level of detail sufficient to make appropriate decisions; and
- Collect data only when they are needed.
Chapter 6 can be used to help identify the information needed to track the state of the assets and investments to maintain and improve them. The basic questions one needs to answer to identify needed data are:
- What decisions do we need to make and what questions do we need to answer that require asset data? Typically, an organization needs to be able to answer questions including but not limited to its asset inventory, the conditions and performance of the inventory, and how resources are being spent on its assets. Also, an organization needs to determine what work is needed and how much that work will cost.
- What specific data items are required or desired? Next, one must identify the data required to meet the established information needs. There may be other data items that are not strictly required, but that may be useful if collected in conjunction with the required data. For instance, answering questions and making decisions regarding pavement an organization would typically want to have an inventory of existing pavement, details on paving materials used, and details on current conditions. Additional information on treatment history or substructure conditions might not be strictly required, but if available could enhance the decision-making process.
It is also important to incorporate standard data elements for location and asset identification into requirements, ensuring consistency with other asset data in the agency.
- What value will each data item provide? It is important to distinguish “nice to have” items from those that will clearly add significant value. The cost of collecting and maintaining a data element should be compared with the potential cost savings from improved decisions to be made based on the element. Cost savings may be due to asset life extension, improved safety, reduced travel time, or internal agency efficiencies. In addition, proxy measures for information value can be considered such as the number and type of anticipated users, and the number and type of agency business processes to be impacted.
- What level of detail is required in the data? Level of detail is an issue for all assets, but is particularly an issue for linear assets such as pavement, where one may decide to capture data at any level of detail. For instance, to comply with Federal reporting requirements for pavement condition a state must collect distress data at 1/10 mile intervals for one lane of a road (typically the outside line in the predominant direction). For other applications it may be necessary to collect data for additional lanes, or at some other interval.
- What level of accuracy is needed? The degree of accuracy in the data may have a significant impact on the data collection cost and required update frequency. Ultimately the degree of accuracy required in the data is a function of how the data are used. For instance, for estimating the clearances under the bridge for the purpose of performing a bridge inspection it may be sufficient to estimate the clearance at lowest point to the nearest inch using video imagery. However, more accurate data may be required when routing an oversize vehicle or planning work for a bridge or a roadway underneath it. If a high degree of accuracy is not required it may be feasible to use sampling strategies to estimate overall conditions from data collected on a subset of assets.
- How often should data be updated? Is the data collection a one-time effort, or will the data need to be updated over time? If data will need to be updated should the updates occur annually, over a period of multiple years, or as work is performed on an asset?
TIP
Look for ways to "collect once, use multiple times" by leveraging existing data and planning data collection efforts to capture information about multiple assets.
Table 7.2 below illustrates examples of data collection strategies that might address different information needs.
Table 7.2 Example Data Collection Strategies
| Example Asset(s) | Type of Information | Example Decisions | Example Data Collection Strategies |
|---|---|---|---|
| Pavement Markings | Total asset quantity by type, district, and corridor or subnetwork | Budgeting for assets maintained cyclically | Estimation based on sampling Full inventory every 3-5 years with interim updates based on new asset installation |
| Roadside Signs | Inventory of individual assets – location and type | Work planning and scheduling for assets maintained cyclically Project scoping | Full inventory every 3-5 years with interim updates based on new asset installation |
| Guardrail | Inventory + General Condition (e.g. pass/fail or good-fair-poor) | Work planning and scheduling for assets maintained based on condition | Inventory and condition assessment every 2-3 years Inventory and continuous monitoring (e.g. from maintenance crews or automated detection) |
| Bridges | Inventory + Detailed Condition | Treatment optimization for major, long life cycle assets | Inventory and condition assessment every 1-2 years + continuous monitoring (e.g. strain gages on bridges) |
Once a general approach has been established, more detailed planning for what data elements to collect is needed. Prior to selecting data elements, identify the intended users and uses for the data, keeping in mind that there may be several different uses for a given data set. Identify some specific scenarios describing people who will use the information, and then validate these scenarios by involving internal stakeholders.
One common pitfall in identifying information needs is failing to distinguish requirements for network level and project level data. While advances in data collection technology make it feasible to collect highly detailed and accurate information, it is not generally cost-effective to gather and maintain the level of information required for project design for an entire network of assets.
A second pitfall is failing to consider the ongoing costs of updating data. The data update cycle can have a dramatic impact on data maintenance costs. Update cycles should be based both on business needs for data currency and how frequently information is likely to change. For example, asset inventory data is relatively static, but condition data may change on a year-to-year basis.
A third common pitfall is taking an asset-by-asset approach rather than a systems approach in planning for both asset data collection as well as downstream management of asset information.
Even when there is a strong business case for data collection, it is sometimes necessary to prioritize what data are collected given budget and staffing constraints. Some agencies do this by establishing different “tiers” of assets. For example:
- Tier 1: Assets with high replacement values and substantial potential cost savings from life cycle management (such as pavements and bridges)
- Tier 2: Assets that must be inventoried and assessed to meet legal obligations (such as ADA ramps, stormwater management features)
- Tier 3: Assets with high to moderate likelihood and consequences of failure (such as traffic signals, unstable slopes, high mast lighting and sign structures)
- Tier 4: Other assets that would benefit from a managed approach to budgeting and work planning (such as roadside signs, pipes and drains)
While updating data can be expensive, various strategies are available for combining data collection activities to reduce the incremental cost of collecting additional data. For instance, one approach to collecting data on traffic signal systems is to update the data when personnel perform routine maintenance work. Also, in some cases data can be extracted from a video log captured as part of the pavement data collection process.
Given limited resources for data collection, it may be helpful to formally assess the return on investment from data collection or prioritize competing data collection initiatives. A formal assessment may be of particular value when considering whether the additional benefits from collecting additional data using a new approach justify the data collection cost. NCHRP Report 866 details the steps for calculating the return on investment (ROI) from asset management system and process improvements, including asset data collection initiatives.
Oregon DOT
- Tier 1: Assets with high replacement values and substantial potential cost savings from life cycle management (e.g. pavements and bridges)
- Tier 2: Assets that must be inventoried and assessed to meet legal obligations (e.g. ADA ramps, stormwater management features)
- Tier 3: Assets with high to moderate likelihood and consequences of failure (e.g. traffic signals, unstable slopes, high mast lighting, sign structures)
- Tier 4: Other assets that would benefit from a managed approach to budgeting and work planning (e.g roadside signs, pipes and drains)
How to Collect Data 7.2.2
As technology continues to advance there are more methods available for collecting data related to assets. It is important for agencies to understand the technology and options available for data collection. Depending on the asset-type or data needed, a different data collection approach may be preferable. This section provides information on making that decision.
There are many different approaches to collecting asset and related data. Often a mix of approaches is used, including visual inspection, semi-automated and automated approaches. The technologies for data collection are advancing rapidly, allowing for increased use of semi-automated and automated approaches for collecting more accurate data at a lower cost. Examples of recent innovations include:
- Improvements in machine vision that allow extracting some forms of asset inventory data from video or LiDAR.
- Use of unmanned aerial vehicles (UAV, also called drones) for allowing bridge inspectors to obtain video of hard-to-reach areas of a bridge.
- Improvements in non-destructive evaluation (NDE), allowing for greater use of techniques such as ground penetrating radar (GPR) for pavement and bridge decks and instrumenting bridges to monitor performance over time.
- Improvements in hand-held devices allowing for increased field use, reducing cost and time of manual data collection.
Several of these technologies provide opportunities to save money by collecting data for multiple assets within a single collection effort. Table 7.3 provides a summary of potential data collection approaches for common roadway asset classes.
TIP
Before collecting new data, make sure you are leveraging data that already exists or is already collected, and coordinate with other agency groups that may have a need for the same data.
Table 7.3 - Example Data Collection Approaches
| Asset Class | Data Collection Method | Data Collected | Notes |
|---|---|---|---|
| Pavement | Visual Inspection | Present Serviceability Index (PSI) | Often used in urban environments or for small networks where data collection using automated collection approaches is impractical – can be supplemented by UAVs |
| Pavement | Automated data collection vehicle with laser scanning system | roughness, cracking, nutting | Includes a range of 2D video and 3D laser-based systems. Many systems store video images and can capture additional measures, such as cross slope, gradient and curvature |
| Pavement | Light Detections and Ranging (LiDAR)/ Terrestrial Laser Scanning (TLS) | roughness, cracking, nutting | Provides a high resolution continuous pavement survey. Often inventory data for other assets can be extracted from the data set |
| Pavement | Falling weight deflectometer | strength/deflection | |
| Pavement | Locked wheel tester/spin up tester | skid resistance | |
| Pavement | Ground Penetrating Radar (GPR) | layer thicknesses, detection of voids and crack depth | |
| Pavement | Coring | layer thicknesses, detection of voids and crack depth | |
| Pavement | Smart phones | potholes, roughness | Includes systems for reporting of potholes and measuring roughness through crowdsourcing |
| Structures and Bridge | Sensors | inventory, condition ratings | Strain and displacement gauges; wired or wireless, |
| Structures and Bridge | Unmanned Aerial Vehicles (UAVs) | condition of non-bridge struc- tures (e.g. retaining walls) | |
| Structures and Bridge | LiDAR | Vertical Clearance | |
| Structures and Bridge | Visual | inventory, condition ratings | Can be supplemented using UAV and other technologies |
| Structures and Bridge | Acoustical (e.g., impact echo) | delamination, corrosion | |
| Structures and Bridge | Infrared/ Thermal Imaging | delamination, corrosion | |
| Structures and Bridge | GPR | concrete deck condition | |
| Structures and Bridge | Half Cell Potential Test | concrete deck condition | |
| Traffic Signs | Videolog | inventory, condition ratings | automated or semi-automated techniques available for classification |
| Traffic Signs | Mobile LiDAR | inventory, condition ratings | |
| Traffic Signs | Field Inspection – mobile application | inventory, condition ratings | |
| Traffic Signs | Retroreflectometer | retroreflectivity |
Once data are collected, it is essential to put in place regular processes for updating the data. This can be accomplished through periodic data collection cycles, or through updating as part of asset project development and maintenance management processes.
Michigan DOT
Unmanned Aerial Vehicles (UAVs) offer several advantages for asset data collection. They can fly into confined spaces such as entrances to sewers and culverts to collect data and images. They can collect high resolution images, thermal images and LiDAR. LiDAR can be used to produce three dimensional images that allow for accurate measurements. Thermal images can be used to detect subsurface concrete deterioration.
Michigan DOT analyzed the benefits of using UAVs for bridge inspection, and concluded that using a UAV for a deck inspection of a highway bridge reduces personnel costs from $4600 to $250. A traditional inspection would take a full day and require two inspectors, and two traffic control staff to close two lanes of traffic. The same inspection using a UAV takes 2 hours and would require only a pilot and a spotter. An additional savings of $14,600 in user delay cost was estimated based on delays associated with shutting down one lane of a four lane, two way highway bridge in a metropolitan area for a bridge inspection.
Tennessee DOT
The Tennessee DOT uses an automated data collection van to collect pavement condition surveys each year in support of its pavement management system. In addition to the pavement sensors, the van also has high definition cameras and LIDAR sensors which scan the roadway and create a 3D model of the environment. As the surveys are conducted, inventory information for approximately 20 highway assets is extracted from photolog and LiDAR information. The inventory from the past data collection cycle is compared to the data collected during the current data collection cycle to determine any changes to asset inventory to keep the data up to date. Tennessee DOT summarizes this inventory data at the county level for planning and budgeting; however, they are currently working toward having the ability to report maintenance work at the asset level in the future.
Federal Highway Administration (FHWA). Pending publication 2019. Handbook for Including Ancillary Assets in Transportation Asset Management Programs. FHWA-HIF-19-068. Federal Highway Administration, Washington D.C.
Preparing for Data Collection 7.2.3
In order to get the most out of the data collection process, it is important for agencies to be thoughtful in the steps leading up to the actual collection of data. Three important steps to prepare for data collection include: coordinating with stakeholders, specifying exactly what data will be collected, and training staff to collect the data.
Once an organization has determined what data to collect and how to best to collect it, the next step is to prepare for data collection.
Step 1. Coordinate
An important step prior to collecting data is to coordinate with other stakeholders in the organization concerning the data collection effort. It may be possible, through such coordination, to identify opportunities for coordinating data collection activities to reduce costs. Alternatively, other stakeholders may identify needs for collecting related data to address other needs. Another possibility is that a different business unit in the organization has already collected data that may impact the data collection plan.
Step 2. Specify
In this step one must identify exactly what data will be collected, the means used to collect the data, and who will collect the data. If data collection is being outsourced, at this point it is necessary to establish contract specifications for data collection.
Also as part of this step one should establish the approach for quality assurance (QA)/quality control (QC). A QA/QC plan specifies the desired accuracy of the data to be collected, and describes the measures used to assure data are of the specific level of accuracy, review data quality as data are acquired, and address any data quality issues that arise. If data are collected using automated means, the plan should specify the approach for calibrating any measurement devices used for data collection. If data are collected through visual inspection the plan should detail training requirements.
Note that given data QA/QC is an area of particular concern for pavement condition data collection, given the expense involved in collecting this data and increased reliance on automated data collection techniques. The Federal performance management requirements described previously include a requirement for State DOTs to establish a QA/QC plan for pavement data collection.
Step 3. Contract
This step involves determining whether to outsource data collection and to contract for services if applicable. Decisions to outsource are typically made to tap into a vendor with specialized equipment and experience with a particular data collection technique, and to enable accomplishing a major collection effort within a compressed timeframe, which would not be possible using internal staff resources. Some agencies may implement a hybrid approach, hiring a contractor while using internal staff (or a separate independent contractor) for supervisory or QA functions.
TIP
Understand your audiences and the questions they are trying to answer.
Step 4. Train
The last step prior to collecting data is to train the staff involved in data collection and review in how data collection should be performed, as well as in their specific roles and responsibilities. Training is important for any data collection effort, but is particularly important in cases where the collection effort relies on visual inspection (for inspecting bridges). In these cases, the training requirements for inspectors should be carefully established and implemented. Even where there are no formal requirements for inspectors, it can be highly valuable to assemble inspectors prior to the start of data collection to review the data to be collected, walk through the data collection process, and perform inspections in a test scenario to ensure consistent interpretation of condition assessment language and other areas where differences in human judgement may impact how data are collected.
Once these steps have been performed the next step is to collect data, following the approach established in Step 2 for data collection and QA/QC.
Utah DOT
Utah DOT started capturing LiDAR data for multiple assets in 2011. Several different business units within the agency provided funding for the effort, which has included collection of inventory data for bridges, walls, signs, signals, barriers, power poles, striping, curb cuts, drainage, shoulders and ATMS devices – as well as pavement condition and roadway geometrics. UDOT has leveraged this integrated pool of asset data for several different applications, including one which creates a draft cost estimate for asset installation for project scoping, based on existing inventory.
Data Sharing 7.3.2
There are many different ways to share information about assets, condition, performance, needs, and work. Agencies can select multiple distribution channels to serve both internal and external users.
As with the design of reports and visualizations, designing a data sharing strategy should begin with an understanding of the different audiences for data and their needs. A variety of options for data sharing are available that can be employed. Table 7.5 outlines some of these options and suggests some questions to consider in selecting an appropriate option.
It is helpful to establish guiding principles for data sharing in order to achieve a consistent agency approach that provides maximum benefits in a cost-effective manner. Possible principles include:
- By default, data should be shared unless it is sensitive, protected by law or if sharing it would pose unacceptable risks or cost burdens
- Self-service methods of data sharing should be used when there is a relatively large pool of data users and data limitations can be readily communicated via standard metadata
- Avoid proliferation of single purpose data sharing applications by adopting standard platforms where multiple data sets can be shared
- When it is necessary to share the same data set through multiple channels, the source data should be stored in a single location or a single data refresh process should be used to reflect updates
- The process of preparing data for sharing, reporting and visualization should be governed to ensure quality, ensure adequate documentation, and avoid inconsistency
Table 7.5 Data Sharing Options
| Data Sharing Option | Most appropriate for... | Considerations |
|---|---|---|
| On request | Internal or external data users | Use for uncommon, specialized requests requiring moderate to extensive effort to fulfill or where there is high potential for information misinterpretation or mis-use For common information needs, use other methods to reduce staff time spent on fulfilling information requests. |
| Direct access to specialized asset management system (e.g. for pavement, bridges, culverts, etc.) | Asset and maintenance specialists in the central office and field offices | Helpful features include: ability to provide view-only privileges and ability to provide filtered views of information (e.g. restrict to a single district) |
| Direct access to enterprise asset management system (with information about multiple assets) | Agency staff Partner agency staff (e.g. MPOs, localities) | For partner agency access, ability to provide access outside of the agency firewall is needed. |
| Enterprise GIS with spatial open data portal | Internal or external data users | It is best to design separate maps geared to specific user types May want to separate internal and external portals or restrict some specialized maps for internal use. |
| General open data portal | Internal or external data users | Consider using available federal and state-level open data portals May want to separate internal and external portals or restrict some specialized maps for internal use. |
| Data feeds/data services/Automated Programming Interfaces (APIs) | Internal or external data users | Most suitable for real time data sets, data sets that are frequently updated, and complex data sets where flexible querying options are needed. |
| Data warehouse/data mart | Agency staff | Use to create a cleansed and standardized data source for reporting/business intelligence. Particularly helpful when historical/time series data is required, and direct access to data from source systems is problematic due to data quality, consistency or performance concerns. Tabular data within the Data Warehouse can be joined with spatial data, as needed, within the Enterprise GIS. |
| Data lake | Agency data analysts/data scientists | Use to provide access to a heterogeneous collection of data including “big data” and unstructured data for research, modeling and analysis. |
| Content management system | Agency staff and partners (e.g. contractors) | Use to provide access to a curated collection of content including engineering design drawings, asset maintenance manuals, contracts, etc. |
| Common data environment (CDE) | Agency staff and partners (e.g. contractors) | Use to provide a shared information repository for a construction project. CDEs typically include document management, collaboration and workflow features. CDE is one of the key elements of BIM practice defined by the UK’s Construction Industry Council. |
DC DOT
Washington, DC has established four levels of data. By default, data is considered to be open and shareable.
- Level 0. Open (the default classification)
- Level 1. Public, Not Proactively Released (due to potential litigation risk or administrative
burden) - Level 2. For District Government Use (exempt from the Freedom of Information Act but not
confidential and of value within the agency) - Level 3. Confidential (sensitive or restricted from disclosure)
- Level 4. Restricted Confidential (unauthorized disclosure can result in major damage or injury)
VTrans
VTrans shares their data with the public through the VTransparency Public Information Portal. The goal of the portal is to “turn data into useful information for our customers” and to “create tools for getting answers to some of the questions we get most often”. The VTransparency Portal features different tools for viewing specific data. These tools include:
- Projects Map
- Road Conditions
- Plow Finder
- Weather Cams
- Maintenance Districts
- Crash Fatality Report
- Crash Query Tool
- Find a Project
- Daily Traffic
- Highway Closures
- Bridge Inspections
- Pavement Conditions
- Pavement Performance
- Maintenance Work
- Rail Asset Inventory
- Rail Bridge Inspections
- Rail Clearance
- Rail X-ing Inspections
The VTransparency Portal also links to the Vermont Open GeoData Portal. This provides GIS map layers related to the various tools for people interested in doing their own analysis of VTrans data. VTrans holds to the principle of making data available by default unless it is sensitive. The agency values transparency with the public and welcomes feedback on the tools they’ve developed. The VTransparency Portal can be accessed at https://vtrans.vermont.gov/vtransparency
Preparing Data for Sharing, Reporting and Visualization 7.3.3
Establishing a standard process to prepare data for sharing, reporting and visualization can make sure that data is publication-ready: quality checked, tested and documented.
A standard data preparation process should be used before moving data to any official reporting source – whether it is a data warehouse, a geodatabase, or a file uploaded to an open data portal.
A data preparation process might use the following checklist:
- Is the data derived from a designated authoritative source system?
- Have data quality checks been applied?
- Has metadata for the data set been prepared, including explanation of the data source, date of last update?
- Is an individual or business unit identified for data users to contact for further information?
- Is an individual or business unit identified for reporting database or system managers to contact regarding any issues that arise?
- Has metadata for the data elements included been prepared (data dictionary)?
- Has the metadata been reviewed for completeness and quality?
- Has a data owner or steward signed off on the data publication?
Ohio DOT
Data-driven decision making can be defined as:
“An approach to business governance or operations which values decisions supported with verifiable data. The success of the data-driven approach is reliant upon the quality of the data gathered and the effectiveness of its analysis and interpretation”
Fundamental Concepts and Principles 7.4.1
Data governance and management practices are essential for achieving reliable, consistent, integrated and accessible data that is of value for decision-making. Several definitions, concepts and principles are important to understand before embarking on a data governance initiative.
Data Management and the TAM Data Assistant
Data governance and data management are interrelated but distinct practices.
Data management includes activities such as data quality management, data documentation, metadata management, security and access controls, data integration, and data archiving.
Data governance is a policy making and oversight function for data management. Implementing data governance involves forming and chartering decision making bodies, defining roles and responsibilities, establishing policies that set expectations for behavior, and setting up standard processes for things like approving data standards, resolving data issues, and acquiring new types of data. Data governance is generally implemented in a hierarchical fashion, with an executive body at the top, a data council or board in the middle, and several more focused groups oriented around specific systems, business processes, organizational units or functions.
Data stewardship is closely related to data management and governance. It refers to established responsibilities and accountabilities for managing data. In general parlance, a steward is someone who is entrusted with the responsibility for taking care of someone else’s property. Similarly, a data steward is someone who takes care of data on behalf of their agency. Different types of stewardship roles can be defined and formalized within an agency data governance policy. Data stewardship can be viewed as the way to operationalize data governance policies, processes and standards.
Data governance can be implemented to:
- Improve quality and consistency of data
- Ensure coordination across different business units
- Maximize efficiency in data collection and management processes
- Enable data integration and shared solutions to make the most of available IT resources
- Ensure there is a solid business case for new data collection
- Ensure that data will be maintained once it is collected
Agencies may be motivated to establish a formal data governance function as they try to move from a siloed approach to collecting and managing data to one that is more coordinated and centralized.
For example, implementing a reporting system that takes data from multiple sources within the agency creates the need for standardization, documentation, and agreed-upon update cycles. It is important to get agreement on standard data definitions, formats and code lists from different business units to achieve consistency. It is also important to clarify who is responsible for fixing errors and the process for error correction in the event that errors occur.
Data governance is a means to an end. It is important to clearly define and communicate why an agency needs to strengthen data governance: what is happening now that the agency may want to avoid (such as data duplication)? What is not happening now that the agency may want to achieve (such as standardized data)? The effort involved in putting data governance in place should not be underestimated, since it involves changes in how decisions are made and changes in behavior. A full scale agency data governance model can take years to mature. However, data governance can be rolled out incrementally to focus on short term objectives. It is a good idea to adopt a set of principles to provide the foundation for data governance policies and practices. The AASHTO Data Principles (see callout box) can be used as a model.
TIP
Data itself should be viewed as an asset to be managed.
Florida DOT
Florida Department of Transportation (FDOT) launched a statewide initiative to better manage and integrate agency data. This effort combines the resources, goals, and objectives of Florida’s Technology and Operation Divisions into the initiative known as ROADS, which stands for:
- R—Reliable, accurate, authoritative, accessible data
- O—Organized data that produces actionable information
- A—Accurate governance-produced data
- D—Data and technology integration
- S—Shared agency data to perform cross-functional analysis
The agency has created processes, procedures, and guidelines so that all data (financial, safety, project, program, assets, etc.) are organized and accessible. Florida’s steering committee, known as RET (ROADS Executive Team), is led by the agency’s Chief of Transportation Technology and Civil Integrated Management Officer. The committee, which includes district secretaries, financial and planning executives, and operational directors, is charged with governance leadership and instituting processes that will change the culture of the agency by converting data to knowledge.
ROADS is being implemented incrementally, through a series of 6-month initiatives. One initiative related to asset management is to standardize inventory attributes for 120 different classes of infrastructure assets and the agency’s approximately 170 enterprise software applications. Part of this effort is to determine specific authoritative source data to include in a new data warehouse. The data warehouse will provide a single authoritative site for sharing the accurate data.
Through the ROADS initiatives, Florida DOT has created a strategic direction for data integration covering data stewards, division responsibilities, asset inventory, business system integration, and an implementation roadmap. By coordinating its efforts, the agency is able to maximize the value of its data while streamlining processes for data collection, management, and dissemination.
Florida DOT Enterprise Information Management
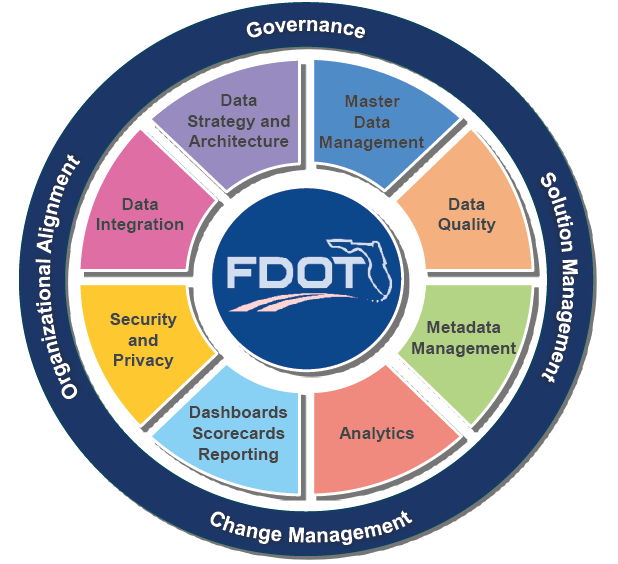
Source: Florida DOT. 2019
Data Governance Practices Supporting TAM 7.4.2
Data governance practices can be implemented to support development of a valuable, reliable base of integrated information for TAM decision making.
A first step in data governance is to identify key decision points to be governed. These may include:
- Adopting common data definitions or standard code lists
- Adopting location referencing standards
- Adopting standard tools for field data collection
- Collecting new asset data to be included within an integrated asset management system
- Archiving or deleting existing data
- Modifying data elements for an existing TAM data source
- Adding new data layers to an enterprise GIS repository
- Adding new data marts to a data warehouse
- Adding new reports or controls to a BI environment
- Responding to an external request for data
It is best to take an incremental approach to setting up governance processes, starting with a few high impact areas that are aligned with what the agency is trying to achieve. For each of the selected decisions to be governed, think both about the criteria or guidelines to be followed as well as all the people who should be consulted or involved in making the decision.
TIP
Data governance practices should involve stakeholders responsible for collecting and analyzing the data, as well as those who will be using the data in decision making.
- Criteria and Guidelines: Developing guidelines for key decisions is a good way to institutionalize practices that reflect the agency’s goals for data. For example, some agencies have established “readiness checklists” that need to be completed before data can be added to an enterprise repository. These ensure (among other things) that a data owner or point of contact has been identified, that necessary metadata is provided, that a refresh cycle has been specified, and that the authoritative source system of record has been identified.
- Decision Making Process: Consider who should be involved in each of these decisions – who is responsible for making technical recommendations, who should be consulted, who has approval authority, and who needs to be informed about the decision. Define a process for resolving issues and conflicts; and a process for granting exceptions to established standards.
Agency data governance bodies can be responsible for adopting both guidelines and process flows impacting decisions that impact multiple business functions. If there are no existing governance bodies or if decisions to be governed are specific to TAM, a separate TAM data governance group can be established.
Keep in mind that the function of governance bodies is to make decisions. Use technical advisory groups, working groups or communities of interest to do the collaborative work required to develop standards or make recommendations about changes to data and systems.
Connecticut DOT
CTDOT established a data governance structure with an initial focus on creating a Transportation Enterprise Database (TED). The vision for the TED is to:
“Create an accessible transportation safety and asset data enterprise system where authoritative data sets are managed by data stewards and formatted for consumption and analysis in a manner that allows stakeholders to use tools that are both effective and meet their business needs.”
CTDOT’s Data Governance Structure is made up of:
- An Executive Oversight Committee, chaired by the agency Chief of Staff, with membership consisting of the agency’s bureau chiefs.
- A Data Governance Council, with members representing key agency functions including Policy and Planning, Asset Management, Engineering and Construction, Maintenance, Traffic, Safety Management, Finance and Administration, Public Transportation, and Information Technology. CTDOT uses consultants to facilitate.
- Data owners and stewards.
The initial charge of the Data Governance Council was to “Prioritize safety and asset data governance solutions to provide the foundational tools necessary to expand enterprise data participation across all disciplines within the agency.” The Data Council is responsible for:
- Identifying data being collected and maintained agency wide.
- Documenting data standards and coordinate development of new standards.
- Developing guidance for data dictionaries, user manuals, and training programs.
- Establishing quality control/quality assurance (QC/QA) processes.
- Facilitating the integration and interoperability of information between authoritative roadway inventory databases and the Department’s enterprise wide data system.
- Informing the Executive Committee of emerging data priorities and how they best might be addressed.
- Reporting to the Executive Oversight Committee as needed to make recommendations regarding data governance challenges or technology opportunities.
Data Owners:
- Have supervisory, administrative, and technical control over a dataset.
- Are responsible for the oversight of the collection, storage, maintenance, and implementation of business rules / managing its use including rules for how data will be exposed for general public consumption.
- Ensure access to the data asset is authorized and controlled.
Data Stewards are responsible for the management of data assets on a day to day basis in terms of content, update and data extract processes, data migration to TED and for the development of metadata. They ensure that:
- There are documents highlighting the origin and sources of authoritative data and completes each metadata element.
- Data has a collection and a maintenance cycle defined.
- Data quality processes are in place.
- Data is protected against unauthorized access or change.
Ohio DOT
Ohio DOT has established a standard process for adding a new asset to their inventory. As illustrated in the flowchart below, the process has three stages – (1) Asset Overview, where the request is submitted, evaluated, and approved, (2) Requirements, in which business and technical requirements for collecting and managing the new data are documented, and (3) Application Development, where the technology solution is developed either in-house (using standard tools), via contract (for custom development) or through acquisition of a commercial off-the-shelf (COTS) package.
As part of the TAM Audit Group workflow shown in the figure, ODOT has introduced over 693,000 active ancillary assets into their inventory.
Ohio DOT TAM Audit Group Workflow Diagram
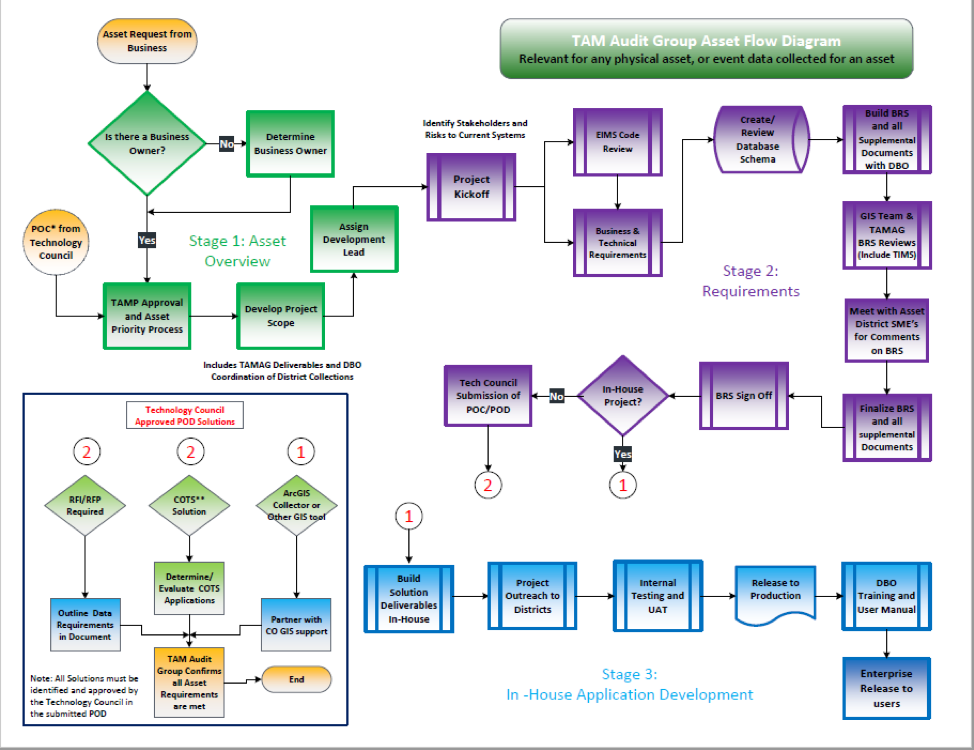
Source: Ohio DOT. 2019
Assessing Data Management and Governance Maturity 7.4.3
Data management and governance implementation can be viewed as a long term process of maturation. Several models and assessment tools are available to help agencies identify their current state, set goals for where they want to be, and create plans for moving up the maturity scale.
There are several different assessment tools tailored to DOT data programs that can be used or adapted as needed. In addition, several DOTs have created their own tools. Most of these tools are based on a maturity model.
A typical maturity model could include the following levels:
- Level 1-Initial
- Level 2-Repeatable processes
- Level 3-Defined and documented processes
- Level 4-Measured and managed processes
- Level 5-Optimizing processes (continuous improvement)
TIP
Use a maturity model to identify gaps, prioritize initiatives and track progress over time.
For TAM information and systems, maturity levels can be assigned to different aspects of data management and governance. Assessments can also be conducted at different levels of the organization – from the agency-wide level, to the level of individual information systems (or even data elements).
Figure 7.5 Example Maturity Model
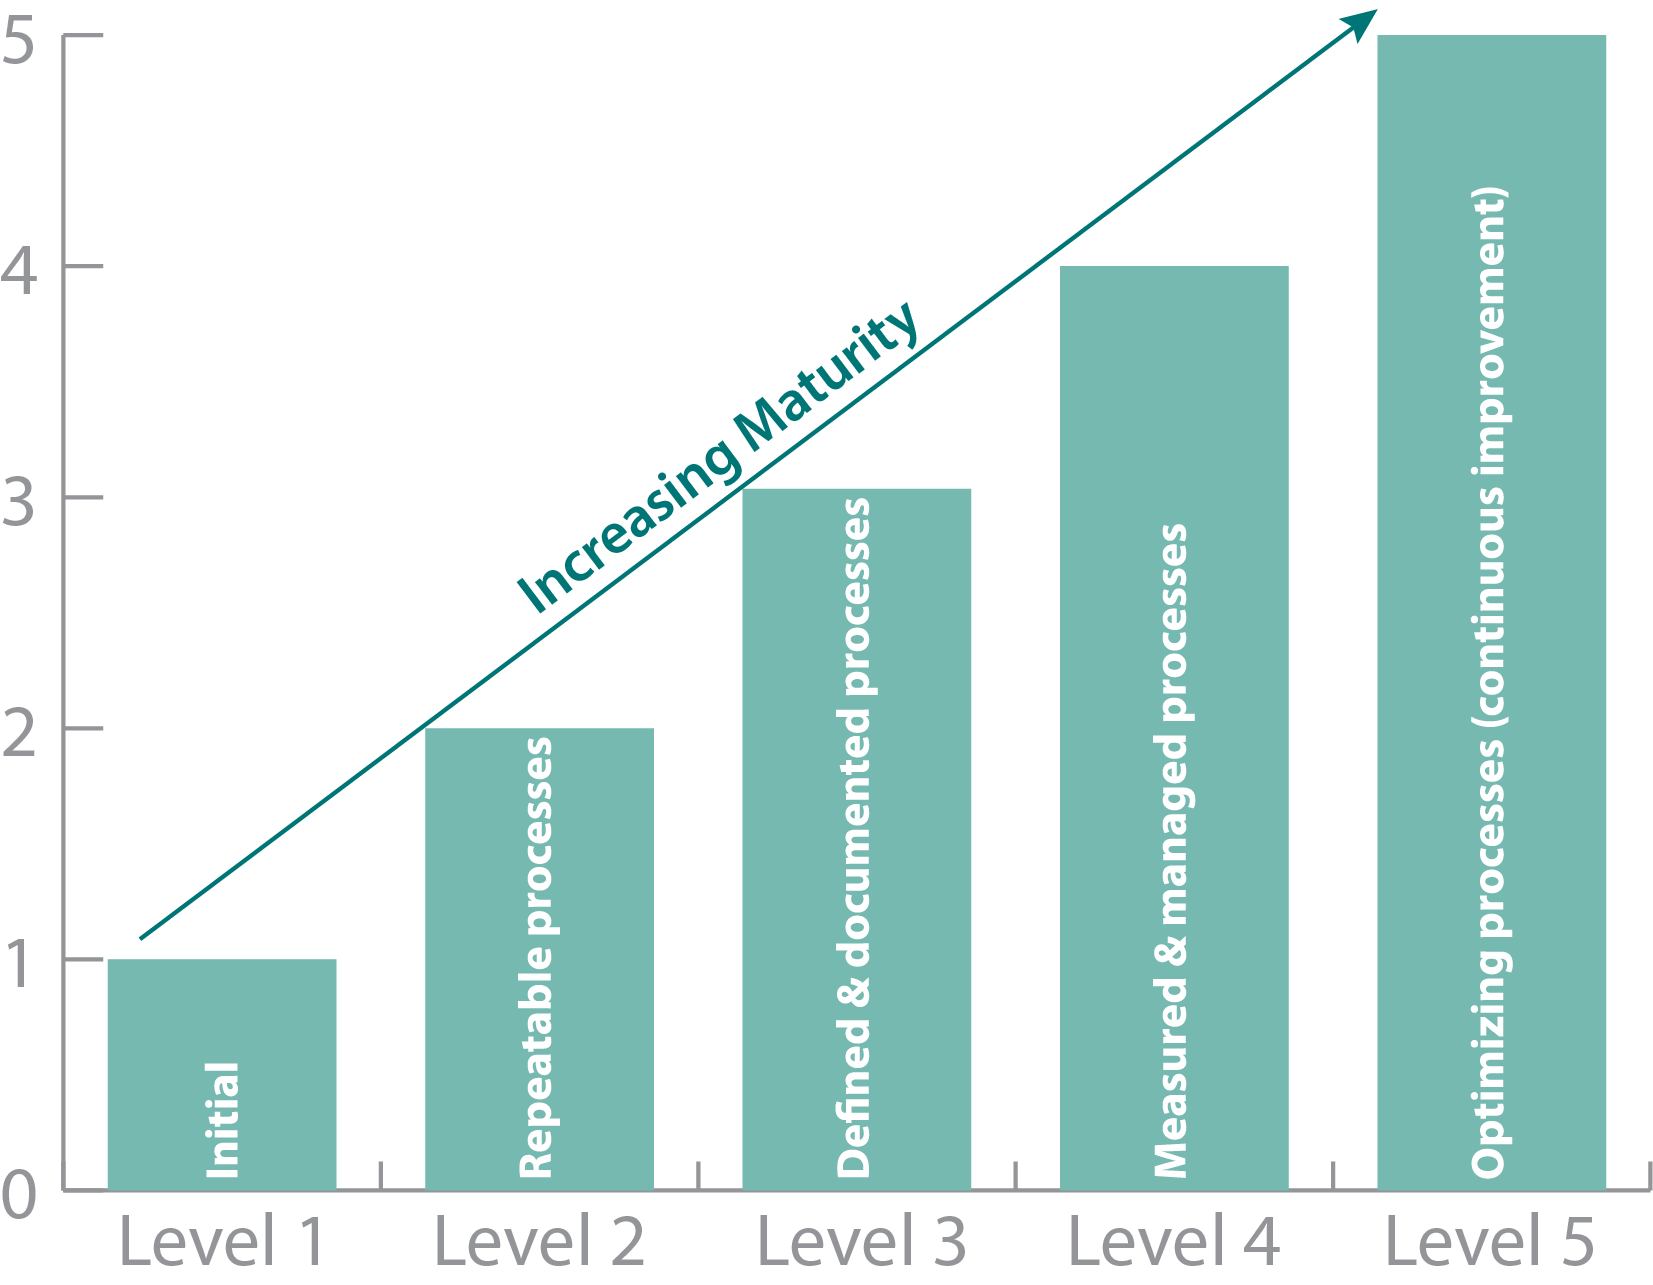
Table 7.6 shows the data management and information system-related assessment elements from the TAM Gap Analysis Tool, developed under NCHRP Project 08-90.
Table 7.6 - TAM Analysis Tool Assessment Elements
| Element | Sub-element | Sample Assessment Criteria |
|---|---|---|
Data Management| Asset Inventory |
| |
| Asset Condition and Performance |
|
|
| Data Governance |
|
|
| Information Systems | System Technology and Integration |
|
| Decision-Support Tools |
|
|
| System Features |
|
Figure 7.6 illustrates the data assessment guidance created under NCHRP 08-92. This process is suitable for application either at the agency-wide level, for an individual data program, or for a business process. It goes into greater depth than the TAM Gap Analysis Tool.
Figure 7.6 Folio Describing the Transportation Agency Data Self-Assessment Process
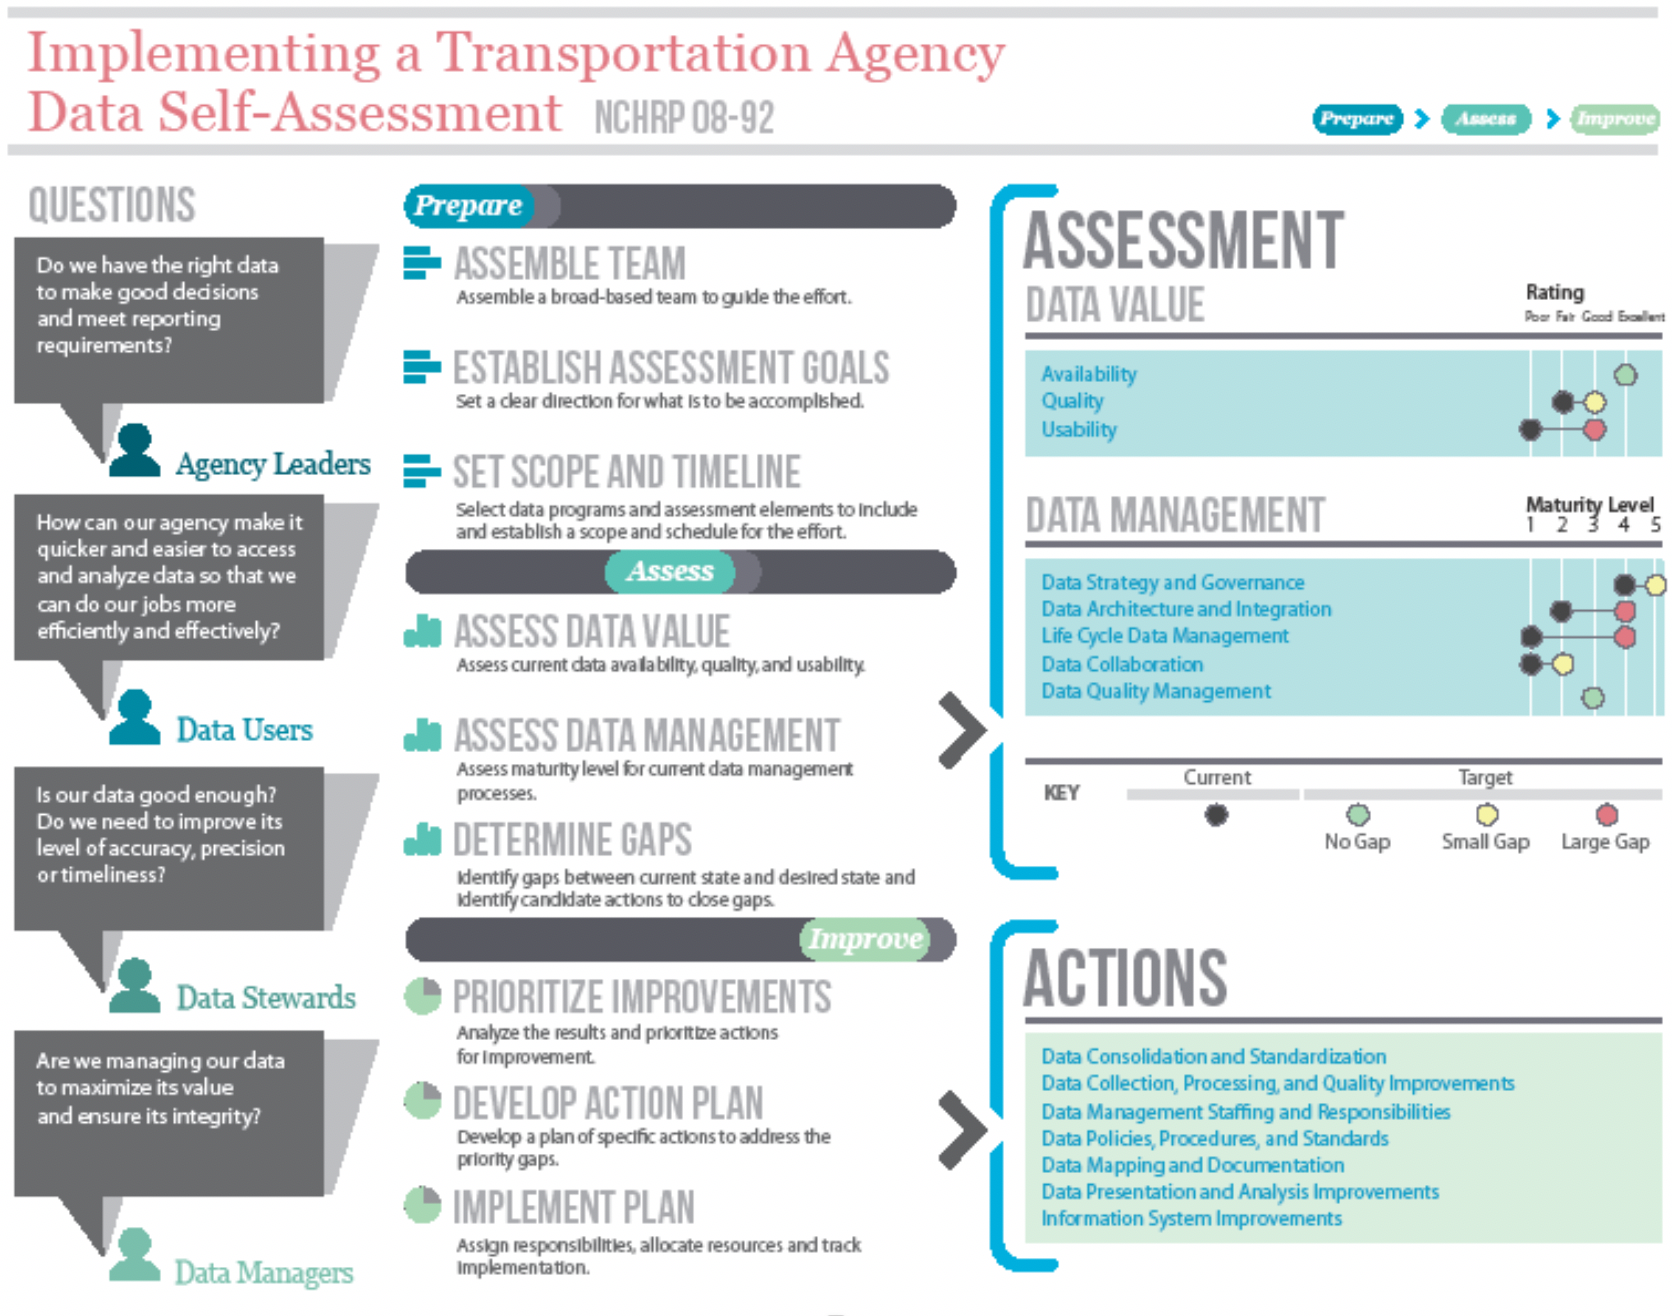
Iowa DOT
Iowa DOT conducted a detailed data maturity assessment for over 180 data systems. Assessments were based on a standardized questionnaire administered to data stewards and custodians. The questions covered data quality, availability of metadata, whether a data retention plan was in place, the degree to which data collection was automated, and several other factors. Charts were produced showing maturity scores for each system, with roll-ups at the division level. This tool helps the agency track their progress over time and identify specific data improvements to pursue.
Sample Data Assessment Summary Radar Chart
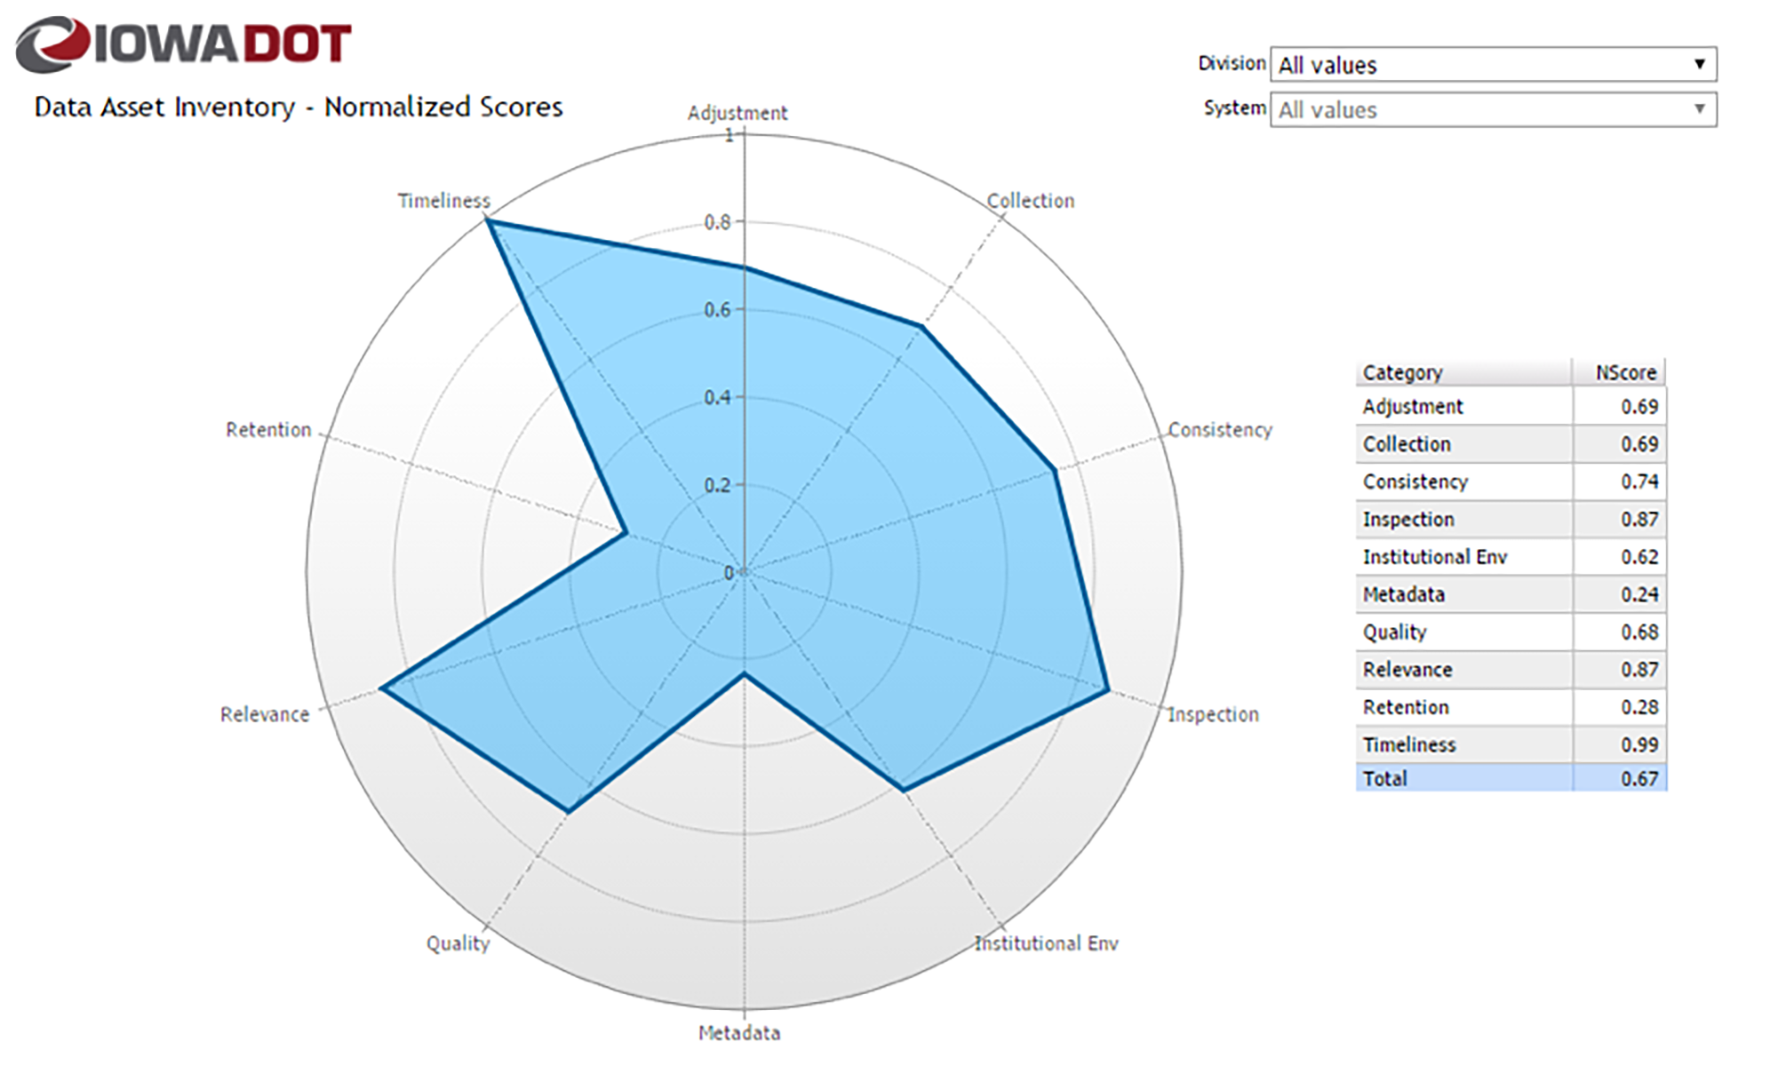
Source: Iowa DOT. 2019
AASHTO
AASHTO Digital TAM Guide Update Hackathon — Kickoff Meeting
Building Information Modeling 7.5.1
This subsection discusses Building Information Modeling (BIM) for Transportation as an emerging practice that integrates asset data across the planning, design, construction, operation, and lifecycle management of transportation assets. BIM's comprehensive digital representation streamlines access to asset information, facilitates condition assessment, supports informed decision-making, and enhances efficiency and safety in managing transportation infrastructure.
BIM Overview
Building Information Modeling (BIM) for Transportation is an emerging practice that supports asset data integration across the planning, design, construction, and lifecycle management and operation of an asset. A robust BIM implementation can support the development and maintenance of a digital twin of an asset, useful in asset maintenance and operations decision-making throughout the life of the asset. A digital twin is defined as a highly detailed virtual representation of a physical asset, reflecting its real-world configurations, historical updates, and maintenance activities throughout its lifecycle. It includes information on rehabilitation and repair actions, as well as the impacts of other related projects. The tool allows transportation agencies to enhance their efficiency in operating, maintaining, planning, scoping, developing, and delivering future investments related to the asset.
In the realm of transportation infrastructure, Building Information Modeling is revolutionizing asset management practices by providing a comprehensive digital representation of assets throughout their lifecycle. BIM's ability to integrate asset data, facilitate condition assessment, and enable informed decision-making is transforming the way transportation agencies manage their valuable infrastructure.
BIM serves as a centralized repository for asset information, encompassing geometric details, material properties, maintenance records, and inspection reports, thereby streamlining access to crucial information, and enabling efficient analysis and better decision-making. Moreover, BIM allows real-time monitoring of asset condition, enabling proactive maintenance and early detection of potential issues. This proactive approach prevents costly failures and extends asset lifespan, optimizing resource allocation and minimizing disruptions to transportation operations.
BIM's ability to simulate maintenance activities allows for more efficient planning and scheduling of tasks, ensuring optimal resource allocation and minimal disruptions to transportation operations. Furthermore, BIM enables performance analysis and simulation under various scenarios, such as traffic loads, weather events, or natural disasters, thereby identifying potential vulnerabilities and assessing the effectiveness of mitigation strategies. This comprehensive approach to asset management ensures the continued performance and reliability of transportation infrastructure, enhancing safety and resilience.
TAM Webinar #42 - TAM and BIM
CRP Project TFRS-02 7.5.2
This page discusses the completion of CRP Project TFRS-02 and the resulting publication of CRP Special Release 4, focusing on the application of Building Information Modeling (BIM) in transportation asset management. It outlines key uses of BIM, such as asset data management, condition assessment, maintenance planning, and resilience planning, emphasizing its transformative role and potential cost and time savings.
TAM Webinar #51 - TAM and Transportation Systems Management and Operations (TSMO)
CRP Project TFRS-02 was completed in 2023, resulting in publication of CRP Special Release 4: Lifecycle BIM for Infrastructure: A Business Case for Project Delivery and Asset Management. This report presents guidance and resources to advance adoption of BIM in infrastructure as developed based on a request to evaluate the business case for BIM by quantifying how enterprise-wide BIM systems can lead to agency efficiencies and improved cost savings.
BIM can be a powerful tool for transportation asset management, providing a comprehensive digital representation of transportation infrastructure assets throughout their lifecycle. Here are some key applications of BIM in transportation asset management:
- Asset Inventory and Data Management: BIM models can serve as a centralized repository for asset data, including geometric information, material properties, maintenance records, and inspection reports. This centralized data management facilitates efficient access to asset information for decision-making and analysis.
- Condition Assessment and Monitoring: BIM models can be integrated with sensor data and inspection reports to provide real-time monitoring of asset condition. This enables proactive maintenance and early detection of potential issues, preventing costly failures and extending asset lifespan.
- Maintenance Planning and Scheduling: BIM models can be used to visualize and simulate maintenance activities, allowing for more efficient planning and scheduling of maintenance tasks. This can optimize resource allocation and minimize disruptions to transportation operations.
- Performance Analysis and Simulation: BIM models can be used to simulate asset performance under various scenarios, such as traffic loads, weather events, or natural disasters. This helps identify potential vulnerabilities and assess the effectiveness of mitigation strategies.
- Decision-Making and Investment Prioritization: BIM models can provide valuable insights for decision-making regarding asset management investments. By analyzing asset condition, performance, and risk factors, BIM can help prioritize maintenance, rehabilitation, or replacement projects.
- Resilience Planning and Adaptation: BIM models can be used to assess the resilience of transportation assets to extreme events and climate change. This information can guide the development of resilience strategies, such as hardening assets or improving redundancy.
Overall, BIM offers a transformative approach to transportation asset management, enabling informed decision-making, efficient maintenance practices, and enhanced resilience of transportation infrastructure. As BIM technology continues to evolve, its role in transportation asset management is expected to expand further, leading to more sustainable and resilient transportation systems.
TFRS-02 identified benefits for BIM implementation included time savings from improved design efficiency, time saved on completing design quantities, time saved from reusing previous BIM content for future similar work, and cost savings from avoided change orders. These savings represent value typically captured during project design and delivery, however further efficiencies can be captured in asset management and operation where additional in-house agency cost savings, project cost savings, staff time savings, and user benefits can be realized.
The TFRS-02 project also developed a series of complementary spreadsheet tools to assist transportation agencies with identifying costs and benefits for implementing BIM for Infrastructure and evaluating their current BIM maturity. Supporting these tools is a multi-media toolkit with addressing frequently asked quotations, and providing presentation materials directed at various levels of agency staff.
Transportation Research Board
The CRP Special Release 4 multi-media toolkit includes video interviews with TRB panel members and research team members regarding the TFRS-02 study findings and lessons learned.
Further information on the multi-media toolkit & interviews available at: https://www.trb.org/Publications/Blurbs/182837.aspx
Practice Examples:
Ohio DOT
Transportation Information Mapping System (TIMS)
Ohio DOT (ODOT) has focused on data and information management improvements as a foundational element of their asset management program. …
Yukon Department of Highways and Public Works
The Yukon Department of Transportation and Public Works (TPW) is committed to taking a consistent, strategic approach to asset planning a…
Ohio DOT
The Ohio DOT Asset Management Leadership Team is a cross-disciplined team, with representatives from all major business units, that estab…
Virginia DOT
Defining Roles & Responsibilities To Ensure Data Stays Current
The Virginia DOT maintains most of the assets on state roads and regularly assesses the condition of those assets for determining investm…
CrossRail & Transportation for London
Application of Building Information Modeling (BIM)
Crossrail is a major design-build project to construct a new railway line across central London (UK). It includes 42km of track and 10 ne…
New Hampshire DOT
NHDOT Bridge Preservation Program Assessment
The New Hampshire DOT (NHDOT) was interested in improving data and information systems to enable better alignment between bridge preserva…
New Mexico DOT
NMDOT Project Evaluation Assessment
New Mexico DOT (NMDOT) had recently implemented a new data-driven methodology to prioritize proposed capital projects. The agency wanted …
Virginia DOT
VDOT Highway Maintenance Management System Assessment
This TAM Data Assessment examined the Virginia DOT maintenance management system to identify how current functionality could be expanded …
Virginia DOT
VDOT Pavement Management Systems Assessment
Virginia DOT (VDOT) has a long standing and high functioning Pavement Management program. This program is organized around a well-establi…
Oregon DOT
- Tier 1: Assets with high replacement values and substantial potential cost savings from life cycle management (e.g…
Utah DOT
Integrated Approach to Data Collection
Utah DOT started capturing LiDAR data for multiple assets in 2011. Several different business units within the agency provided funding fo…
DC DOT
Washington, DC has established four levels of data. By default, data is considered to be open and shareable.
- Level 0…
Practices:
Data and Systems for Life Cycle Management
- A computerized maintenance management system is being implemented/customized to better understand operations and maintenance activities within the agency.
- Some basic asset modeling is used to predict asset performance in the future for financial planning purposes.
- Computer management systems meeting the minimum federal requirements are implemented and used for compliance.
- A computerized maintenance management system captures operations and maintenance costs within the agency and assigns these to assets appropriately.
- Appropriate probabilistic and deterministic modeling techniques are used to predict asset performance for high value assets.
- A computerized maintenance management system captures operations and maintenance costs within the agency, and supports trade-off analysis between capital investment and operations and maintenance intervention alternative tactics
- Appropriate probabilistic and deterministic modeling techniques are used to predict asset performance in the future, and inform financial planning and intervention selection.
Information and Systems
- Agency information systems are unintegrated, however the current portfolio of systems are well mapped, and an improvement plan is in progress to improve integration toward a clearly defined future state that is suited to agency requirements.
- Agency information systems are partially integrated, interconnected and a plan is being implemented to create a system that is suited to agency requirements.
- Agency information systems are fully integrated. Systems supporting inventory management, data warehouses and statistics, inspections and condition assessments, maintenance management, performance modeling, analytics, forecasting and financial systems are interconnected and are suited to agency requirements.
Collecting Asset Data
- Collection occurs periodically and data is maintained, current and accurate.
- Data collection strategies are targeted to agency decision-making requirements.
- Collection occurs periodically and data is maintained, current and accurate.
- Data collection strategies are targeted to agency decision-making requirements, and collection resources add value.
- Collection occurs periodically and data is maintained, current and accurate.
Asset Data Sharing, Reporting and Visualization
- Information is available to most stakeholders and allow for improving decisions over time.
- Data and analysis presentation is improving with a plan for consistency across the agency.
- Information is available to most stakeholders and allow for informed, supported decisions
- Data and analysis presentation is improving and is targeted to key decision-makers, and consistent across the agency.
- Information is available to all stakeholders and allow for informed, supported decisions
- Data and analysis presentation is well crafted, easy to understand for the targeted audience, and consistent across the agency.
Data Governance and Management
- Data governance and management practices are being established with a gap assessment identifying an improvement strategy over time.
- Data governance and management practices well established and support continuous improvement in data systems.
- Data governance and management practices well established and support reliable, consistent, integrated and accessible data systems
- Governance frameworks are reviewed periodically to ensure it evolves with agency requirements.
How To Guides:
Determine What Data Is Needed to Support Life Cycle Management
Perform a Data Management Maturity Assessment
Evaluate Current Maturity to Support BIM and Identify a Future Target
Evaluate Return on Investment for BIM
Perform a Data Value Assessment and Develop a Data Value Improvement Action Plan
Perform a TAM Data Value Assessment
June 6, 2006 | AASHTO
This guide contains information on several highway right-of-way assets including pavements, bridges, culverts, guardrails, and drainage structures.
External Link: https://store.transportation.org/Item/PublicationDetail?ID=390
January 30, 2017 | ASCE Library
This paper proposes collecting asset inventory data as an integrated part of the construction process, providing an example of such a practice in the construction of a transportation project in Indiana. It asserts that collecting inventory during project construction significantly cuts costs by eliminating duplicative data documentation.
External Link: https://ascelibrary.org/doi/10.1061/%28ASCE%29CO.1943-7862.0001288
January 1, 2013 | FHWA
The Practical Guide provides information related to the development and implementation of a QM program, incorporating proven QM practices, and showcasing examples or case studies using pavement condition data from a variety of state DOTs.
External Link: https://www.fhwa.dot.gov/pavement/management/qm/data_qm_guide.pdf
January 9, 2009 | Transportation Research Board
Quality Management of Pavement Condition Data Collection explores the quality management practices being employed by public highway agencies for automated, semi-automated, and manual pavement data collection and delivery.
External Link: https://www.nap.edu/catalog/14325/quality-management-of-pavement-condition-data-collection
April 19, 2018 | Transportation Research Board
The objective of this project is to validate the use of commercial remote sensing and spatial information (CRS&SI) technologies, including emerging 3D line laser imaging technology, mobile light detection and ranging (LiDAR), image processing algorithms, and Global Positioning System (GPS)/Geographic Information System (GIS) technologies, to improve transportation asset data collection, condition assessment, and management.
External Link: https://trid.trb.org/Results?txtKeywords=%22asset+data+collection%22#/View/1505178
September 1, 2015 | Purdue University: Joint Transportation Research Program
The purpose of this project was to conduct a synthesis study to 1) assess the current status at INDOT regarding the collection of asset data during the construction phase and the use of such data in the operation and maintenance (O&M) phase, and 2) develop a framework for INDOT to leverage the construction inspection and documentation process to collect data for assets.
External Link: https://docs.lib.purdue.edu/jtrp/1588/
January 31, 2012 | U.S. DOT Volpe Center
This report provides background on GIS and asset management, describes how public agencies have been integrating the two, and identifies benefits and challenges to doing so.
External Link: https://www.gis.fhwa.dot.gov/documents/GIS_AssetMgmt.pdf
September 30, 2015 | Transportation Research Board
The objective of Communicating Performance Management—State DOTs Continuing to “Tell Their Story” is to provide a resource base for guiding state departments of transportation (DOT) performance management (PM) and communications professionals in communicating transportation system performance. The hope for this resource is to advance PM communications practices, particularly with respect to Moving Ahead for Progress in the 21st Century (MAP-21) reporting requirements.
External Link: http://onlinepubs.trb.org/onlinepubs/nchrp/docs/NCHRP20-24(93)B02_FR.pdf
January 31, 2017 | W3C
This document provides Best Practices related to the publication and usage of data on the Web designed to help support a self-sustaining ecosystem.
External Link: https://www.w3.org/TR/2017/REC-dwbp-20170131/
July 1, 2017 | Cambridge Systematics, Inc.
This website is intended as a resource for transportation professionals who want to use illustrations and visualizations to communicate their ideas to an audience.
External Link: https://vizguide.tpm-portal.com/
May 1, 2017 | ESRI
This white paper discusses the role of GIS based on lessons learned in this author's experience at his own utility and from customer implementations of the Esri ecosystem.
External Link: http://www.esri.com/library/whitepapers/pdfs/a-practical-guide-togis-in-asset-management.pdf
August 22, 2023 | Metropolitan Transportation Commission
Vital Signs is an interactive website by MTC and the Association of Bay Area Governments (ABAG) that offers data, visual representations of that data and written explanations about important trends in the Bay Area.
External Link: https://mtc.ca.gov/tools-resources/vital-signs
September 1, 2015 | Transportation Research Board
Successful Practices in GIS-Based Asset Management provides guidance for state transportation agencies on using geographic information system (GIS) technologies in transportation asset management (TAM).
External Link: https://nap.nationalacademies.org/catalog/22194/successful-practices-in-gis-based-asset-management
September 1, 2001 | Graphics Press LLC
Guide to statistical graphics, with emphasis on its use as a statistical method and applications in data analysis and mapping - includes chapters on aesthetics and the methodology of preparing graphs and visual aids.
External Link: http://faculty.salisbury.edu/~jtanderson/teaching/cosc311/fa21/files/tufte.pdf
May 9, 2022 | Transportation Research Board
This research implementation project to help decision makers and data practitioners to evaluate and improve their data quality and data management practices. The objectives of this resource is to encourage dissemination and application of the principles and practices presented in NCHRP Report 814: Data to Support Transportation Agency Business Needs: A Self-Assessment Guide
External Link: https://apps.trb.org/cmsfeed/TRBNetProjectDisplay.asp?ProjectID=4669
January 1, 2015 | Transportation Research Board
Data to Support Transportation Agency Business Needs: A Self-Assessment Guide provides methods to evaluate and improve the value of their data for decision making and their data-management practices.
External Link: https://nap.nationalacademies.org/catalog/23463/data-to-support-transportation-agency-business-needs-a-self-assessment-guide
August 8, 2023 | FHWA
This resource outlines the adoption of building information modeling (BIM) in transportation structures through an ongoing study conducted by AASHTO.
External Link: https://www.pooledfund.org/Details/Study/624
November 16, 2018 | EDP Sciences
The present paper reports different applications which have a common data source: Automatic Road Analyzer (ARAN) of the Transport Infrastructure Laboratory of the University of Catania. Data surveyed with ARAN were used to develop performance indicators of the road asset, as well as develop a BIM model.
January 1, 2020 | Transportation Research Board
BIM Beyond Design Guidebook gives airport owners the basic knowledge required to manage this complexity through building information modeling (BIM), a practice that has transformed the design and construction industry over the last decade and is now emerging as a key component to enhancing an asset life cycle management approach for many organizations.
External Link: https://nap.nationalacademies.org/catalog/25840/bim-beyond-design-guidebook
February 1, 2021 | FHWA
This publication describes how integrating data from law enforcement and public safety computer-aided dispatch systems with transportation operating systems can improve incident response, help to save responder lives, and improve safety for travelers on the network. It presents several successful case studies of data sharing partnerships that have resulted in improved operational information as well as improved decision-making data for travelers.
External Link: https://ops.fhwa.dot.gov/publications/fhwahop20064/index.htm
February 19, 2020 | Journal of Transportation Engineering
In this study, a transportation data-integration framework based on a uniform geospatial roadway referencing layer is proposed. In the framework, on the basis of traffic sensors’ locations and sensing areas, transportation-related data are classified into four categories, including on-road segment-based data, off-road segment-based data, on-road point-based data, and off-road point-based data.
External Link: https://trid.trb.org/view/1693703
October 15, 2020 | FHWA
This handbook is intended to expand upon and provide general information and guidance on the management of systems and associated assets used in the transit operating environment in support of the FTA Transit Asset Management (TAM) rule.
External Link: https://www.transit.dot.gov/regulations-and-programs/asset-management/transit-asset-management-systems-handbook
October 17, 2023 | FTA
This online database contains extensive information on national transit records.
External Link: https://www.transit.dot.gov/ntd/ntd-data
January 1, 2021 | TRB
Collaborative Practices for Performance-Based Asset Management Between State DOTs and MPOs documents DOT practices for collaborating with MPOs relative to target setting, investment decisions, and performance monitoring of pavement and bridge assets.
December 31, 2022 | Transportation Research Board
The objectives of this NCHRP project were to develop a guidebook and related guidance materials, to ensure the usability of the guidance, and to encourage awareness and application of the guidance: principles, organizational strategies, governance mechanisms, and practical examples for improving management of the processes for collecting data, developing useful information, and providing that information for decision making about management of the transportation system assets.
External Link: https://apps.trb.org/cmsfeed/TRBNetProjectDisplay.asp?ProjectID=4362
May 1, 2020 | AASHTO
This guidebook provides a structured approach to assess current practices and improve use of data and information for TAM. Explore and apply this guidance through this website and the companion TAM Data Assistant digital application.
External Link: https://www.tamdataguide.com/
October 18, 2023 | AASHTO
The AASHTO TAM Data Assistant provides a structured approach to assess current TAM practices and improve use of data and information for TAM.
External Link: https://dataassessment.tam-portal.com/
December 31, 2021 | Transportation Research Board
The objective of this research was to evaluate the business case for BIM in the United States by quantifying how adopting enterprise-wide BIM systems can provide increased agency efficiencies and foster advanced, comprehensive lifecycle management of enterprise assets.
External Link: https://apps.trb.org/cmsfeed/TRBNetProjectDisplay.asp?ProjectID=4874
Resources:
Data to Support Transportation Agency Business Needs: A Self-Assessment Guide
NCHRP Report 814 provides a guidebook to help decision-makers and data practitioners to evaluate and improve their data management practices. These include data management maturity assessments which can be completed at program or agency-levels, as well as data value assessments which can be used to evaluate the degree to which data are meeting the needs of your decision-making needs. This guidance was refined and expanded upon through the NCHRP 20-44(12) research implementation project, providing improved tools as well as supplemental implementation guidance and assessment facilitation materials. NCHRP 08-36
External Link: https://www.trb.org/Main/Blurbs/173470.aspx
Data Visualization Methods for Transportation Agencies
Task 128 produced a Guide for Data Visualization Methods for Transportation Agencies which provides a five step approach for the data analytics and visualization process.
External Link: https://www.trb.org/Publications/Blurbs/175902.aspx