Improving South Dakota DOT’s Pavement Deterioration Models / South Dakota DOT
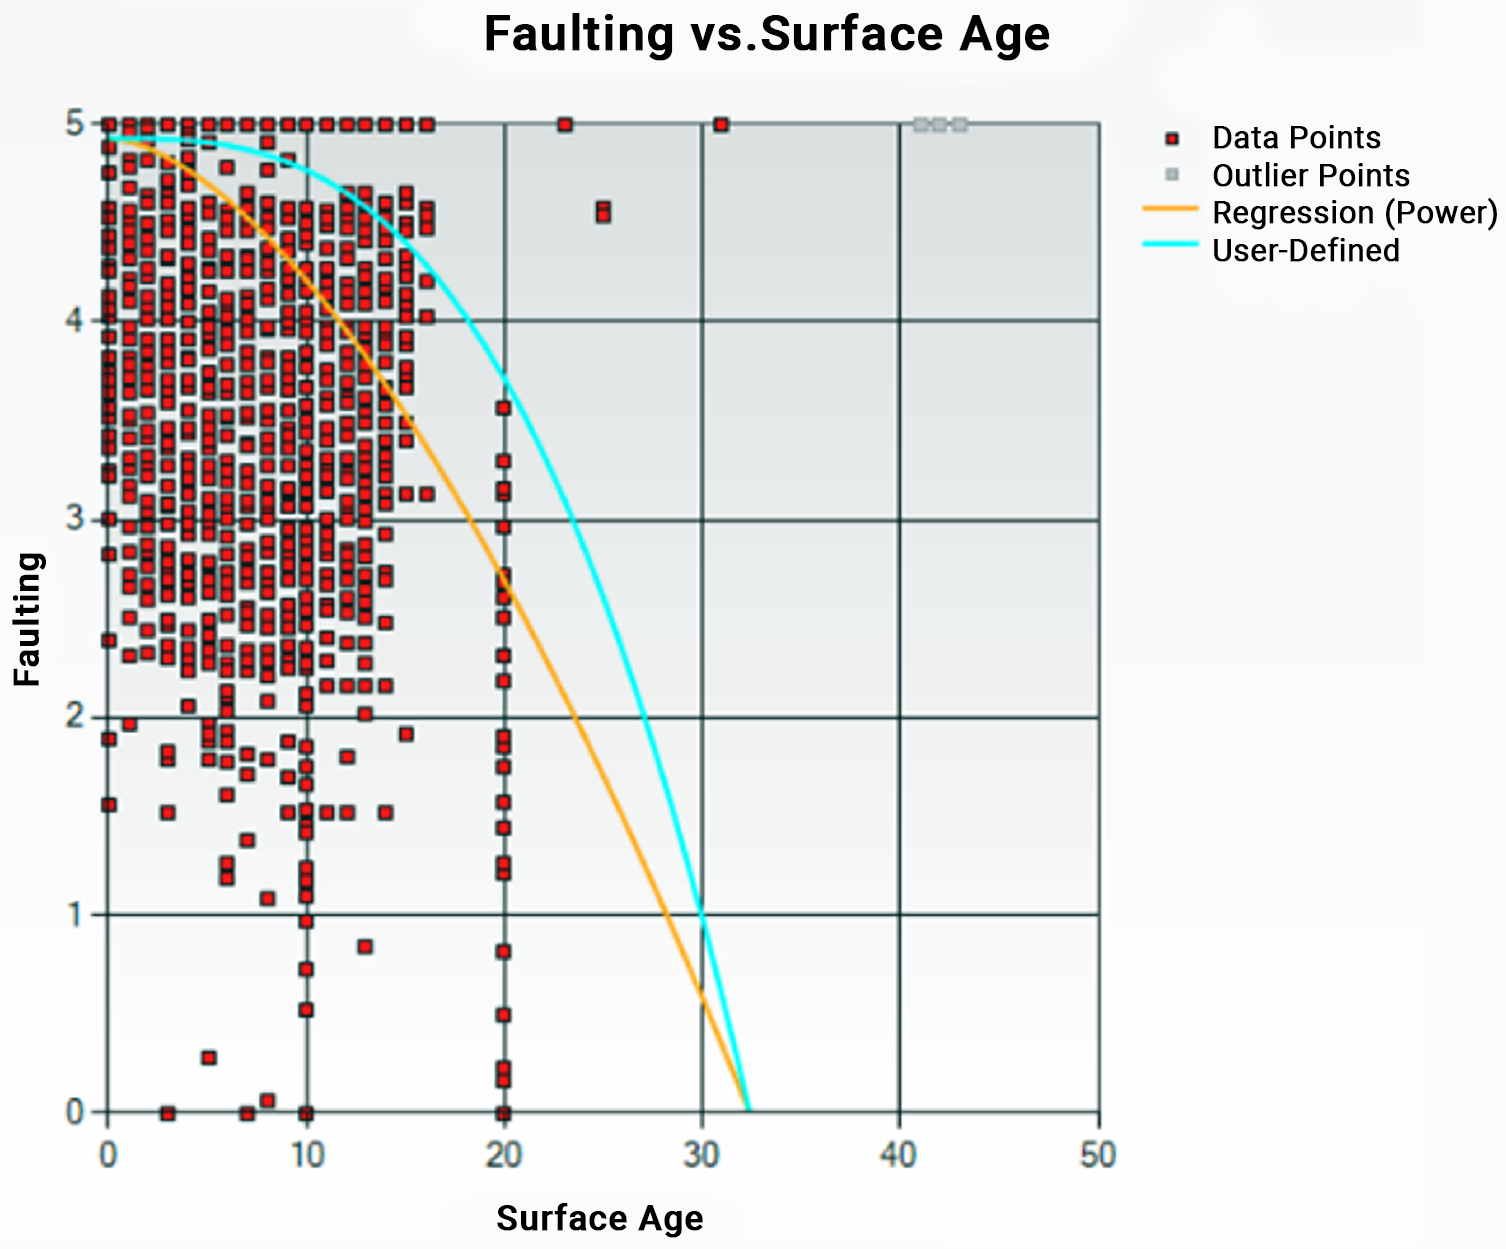
In 2011, the South Dakota DOT initiated a project to revise the pavement deterioration models developed in 1997 using 17 years of historical pavement condition data. The tool for developing the models included features allowing all the condition-versus-age data points for each pavement meeting the family description (based on surface type and pavement structure) to be plotted on a graph, facilitating a comparison of the historical model and the recommended model based on the updated pavement condition information. In this example, the blue line (labeled as the user-defined model) represents the model being used in the pavement management system for predicting faulting on a thick, short-jointed doweled concrete pavement and the gold line (labeled as the regression equation). The regression analysis on the historical data, represented by the red data points, indicates faulting is occurring at a much more accelerated rate than was previously predicted. As a result, recommendations for addressing faulting were likely lagging the actual need observed in the field.
Illustration Showing How Historical Data can be Used to Modify a Deterioration Model
Source: South Dakota DOT. 2012. Technical Memo/Software Documentation
Read more in the chapter: 6.4.3 Using Work History Information to Improve Models