Topic: Financial Management
Financial Management
This page features information on managing the financial aspects of TAM. Whether you want to improve planning processes, track costs more effectively, or improve resource allocation methods, you can find what you need here.
Performance Management
Asset management utilizes performance management to set objectives, define measures, establish targets, and monitor results. Transportation Performance Management (TPM) relies on the TAM principles and process to help achieve the agency's broader goals and objectives.
Relationship to Federal TPM Activities
The MAP-21 Act (2012) established a performance-based program intended to focus Federal Aid highway program and public transportation system (e.g., bus, light rail, and ferry) investments on national transportation goals. It was also intended to increase accountability and transparency in the use of federal transportation funds, as well as improve project decision-making through the strategic use of system performance information. The performance-based provisions of MAP-21 were retained in the FAST Act in 2015.
TPM is defined by FHWA as a strategic approach to making investment and policy decisions to achieve national performance goals using system information in accordance with rules established by the Department of Transportation (see Figure 2.3). The FHWA recognizes asset management as the application of TPM to manage the condition of infrastructure assets needed to provide for mobility and safety in the nation’s transportation system. In short, the FHWA refers to asset management as the engine driving infrastructure performance.
Figure 2.3 FHWA's Strategic Approach to TPM
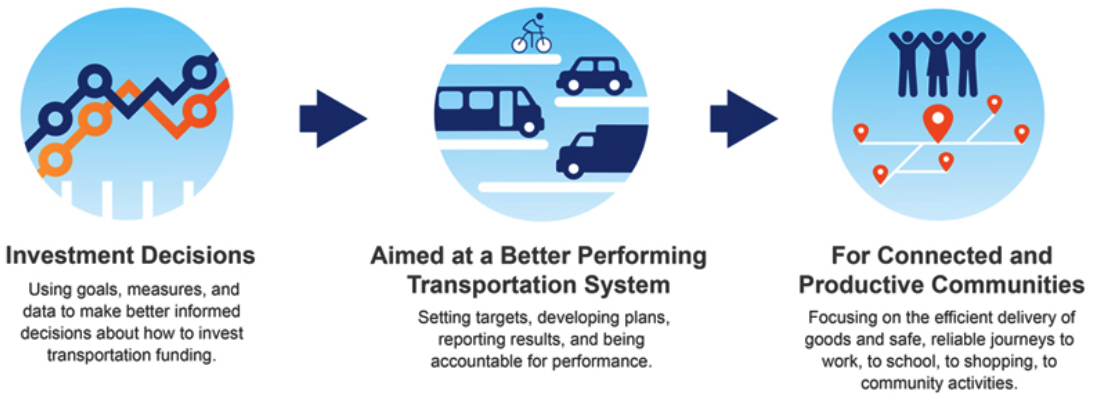
Source: FHWA TPM Homepage. 2019 https://www.fhwa.dot.gov/tpm/
Asset management plans document the processes and investment strategies developed by an agency to manage its infrastructure assets. These asset management plans support an agency’s performance-based planning and programming processes for making long-term investment decisions and feed shorter-term project and treatment selection activities. Together, these activities ensure the investment decisions of an agency are aligned with performance objectives and goals.
TPM Regulations
The TPM provisions for highways included in federal law are implemented in accordance with rulemakings organized around the following six elements:
- National goals – focusing the Federal Aid highway program on the seven areas listed below:
- Congestion reduction
- System reliability
- Environmental sustainability
- Freight and economic vitality
- Infrastructure condition
- Reduced project delivery delays
- Safety
- Measures – assessing performance or condition in carrying out the TPM-based Federal Aid highway program
- Targets – funding recipients are required to document future performance expectations under a fiscally-constrained environment
- Plans – identifying strategies and investments for addressing performance needs
- Reports – documenting progress toward target achievement and investment effectiveness
- Accountability and transparency – requiring federal funding recipients to achieve or make significant progress toward targets
TPM Relationship with TAM
There is a close relationship between TPM and TAM, since both consider asset and system performance, risks and available resources to achieve desired objectives over time. Both rely on a strategic approach, using data to make investment and policy decisions in order to achieve performance objectives. Internationally, there is less distinction between asset management and performance management, with the IAM defining asset management as encompassing the “balancing of cost, opportunities and risks against the desired performance of assets to achieve the organizational objectives.” In the United States, TAM applies to the technical and financial decisions, plans and actions related to physical infrastructure, while TPM considers a broad range of system performance categories.
A graphic illustrating the integration of asset management and performance management is provided in Figure 2-4. In the figure, the circle on the left represents the interconnection of the various performance areas that transportation agencies are concerned with throughout their planning processes. Flowing into the performance circle is the asset management circle, representing an agency’s infrastructure needs to support system performance.
The FHWA’s Expert Task Group (ETG) published a white paper explaining the relationship between asset management and performance management. It acknowledges the performance of a transportation system is dependent on many factors, including operational characteristics, and system usage and demand, in addition to the physical condition of the infrastructure assets. The paper explains that “performance management focuses on how policies, resource allocation, and other decisions affect all aspects of system performance including safety, operations, environmental stewardship, and infrastructure condition.” (FHWA 2012) Asset management is described as an application of performance management principles with a long-term focus to manage the performance of infrastructure assets, the resources allocated to operate a transportation system, and the investments made to achieve the agency’s long-term goals and objectives.
Figure 2.4 Integration of Performance Management and TAM
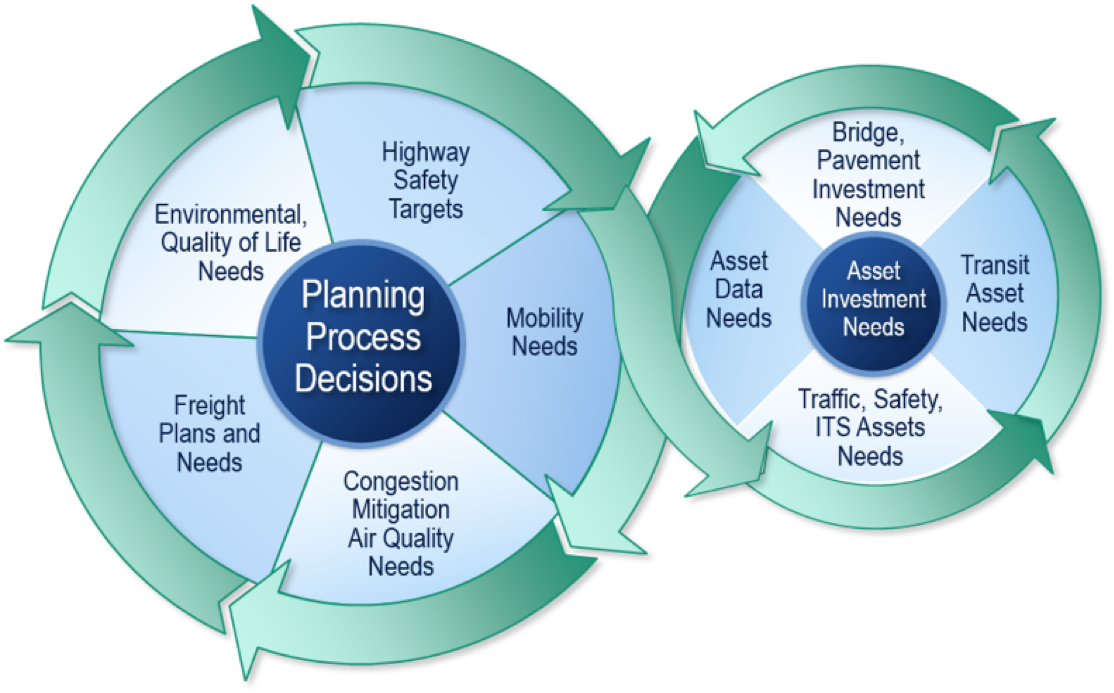
Source: NHI 136106A, Introduction to Transportation Asset Management. 2019
British Columbia
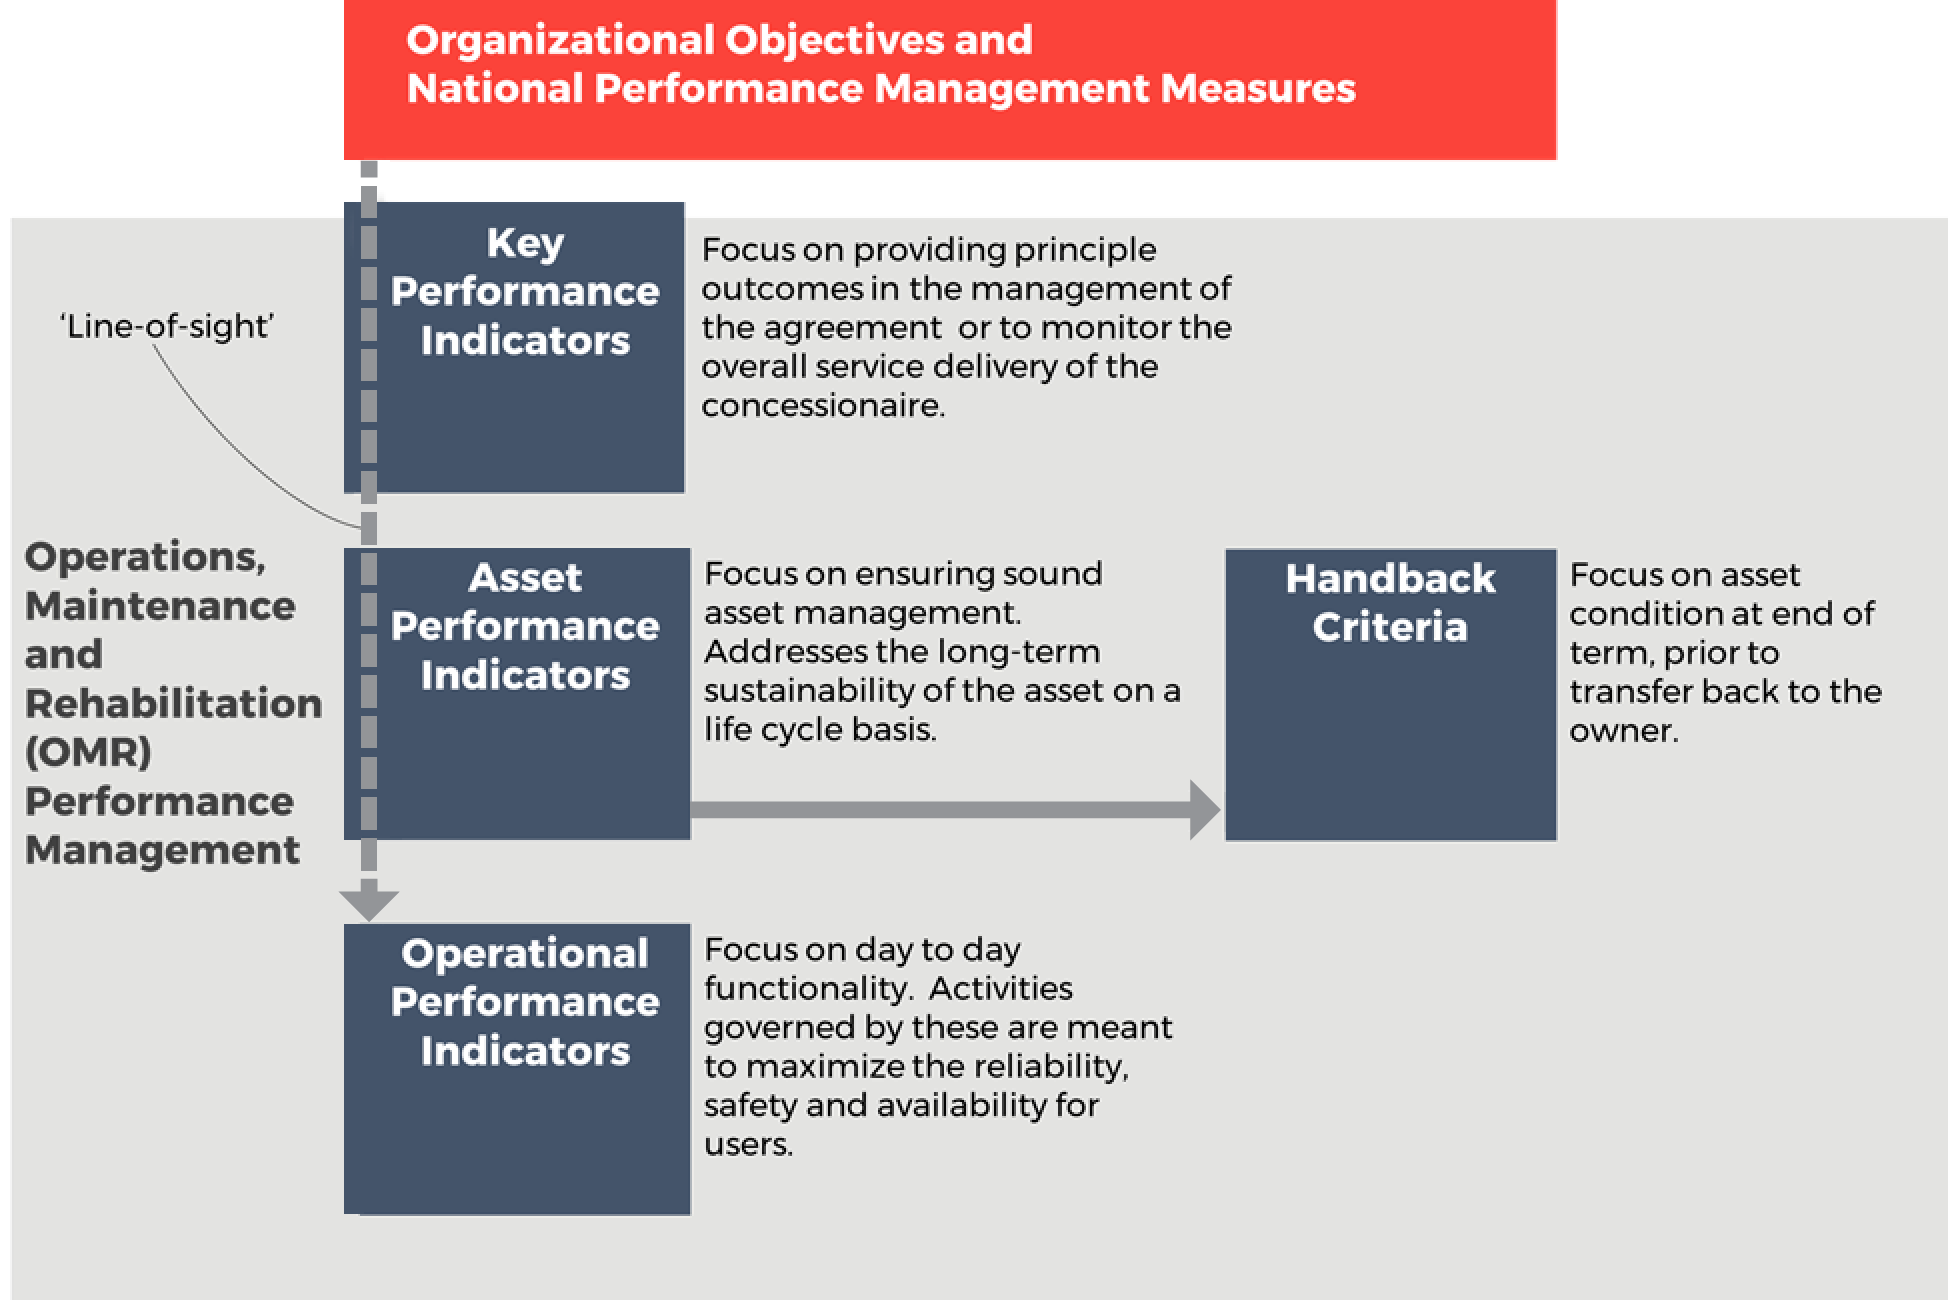
To support the alignment of agency policies, objectives and day-to-day practices, the Province of British Columbia established the tiered structure shown in Figure 2.5 for a design-build-finance-operate project. The highest of the three levels, Key Performance Measures, defines the high-level outcomes for service delivery in terms of a few key strategic areas. The second level, Asset Preservation Performance Measures, defines the minimum acceptable condition levels for each of the individual assets to preserve their value. The third level, Operational Performance Measures, corresponds to the many specific requirements for operating and maintaining the highway in a safe manner on a day-to-day basis. The tiered approach helped align stakeholders at all levels and clarified priorities for all parties.
Performance Management Framework
To support the alignment of agency policies, objectives and day-to-day practices, agencies may establish a tiered performance management framework, such as the example illustrated below for a model Design-Build-Finance-Maintain-Operate (DBFMO) project (Figure 2.5). The highest of the three levels, Key Performance Measures, defines the high-level outcomes for service delivery in terms of a few key strategic areas. The second level, Asset Preservation Performance Measures, defines the minimum acceptable condition levels for each of the individual assets to preserve their value. The third level, Operational Performance Measures, corresponds to the many specific requirements for operating and maintaining the highway in a safe manner on a day-to-day basis.
Further discussion on Performance Management Frameworks, defining Performance Measures and Performance Targets is included in Chapter 6.
Figure 2.5 Typical Performance Management Framework used in a DBFMO Project
Assessing Current Practice
An assessment of current agency competency against industry-leading practice enables an agency to assess a desired future performance level. It can also help to identify the steps required to reach that goal.
TAM is an evolving process; ongoing improvement is an important component for a TAM program. In fact, the ISO 55001 Asset Management certification requires ongoing assessment and continual improvement.
A gap assessment process is used to understand how well an agency aligns with an established asset management framework. The gap assessment can be conducted internally or by a third party. Organizations seeking or wanting to maintain ISO certification will also undergo a formal third party audit.
The results of a gap assessment can help agencies identify changes in business processes needed to better link plans and decisions and better align to leading practice.
NCHRP Project 08-90 led to the development of a gap analysis tool, available through AASHTO and the TAM Portal. Figure 2.8 illustrates how this assessment tool is intended to be used. There are several other frameworks that can be used, including ISO 55001 and the Institute of Asset Management (IAM). A range of gap assessment framework’s are discussed further in Figure 2.9. Each framework, process or tool will enable an agency to assess current performance and, from this, identify a desired capability level.
Figure 2.8 TAM Improvement Cycle
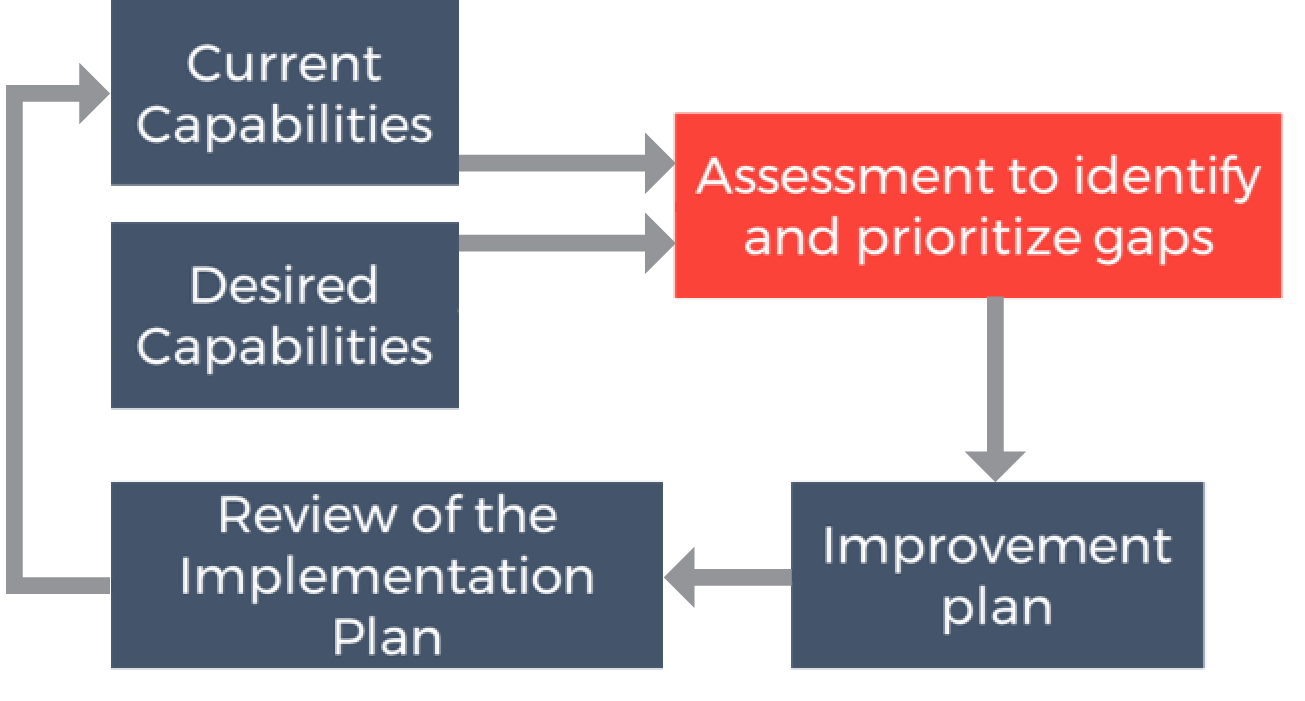
Source: Modified from original in NCHRP Project 08-90
TIP
Factors to consider when prioritizing advancement in TAM approaches will vary from agency to agency. Consider those factors that are of most importance to you and are well-aligned to your strategic goals.
In some cases, agencies also seek benchmarks that reflect how peers are performing to help them decide on the level of maturity and complexity to which they should aspire. ISO 55001 trends away from this. It encourages agencies to check against a framework of practices and process, and select what is best for the agency. Chapter 6 addresses benchmarking and related topics.
Actions to close gaps between desired and actual performance should be addressed within a TAM improvement or implementation plan.
Undertaking a gap assessment can form an important part of a change management process by aligning those within the agency on current performance, opportunities and targets for improvement.
Table 2.1 - Frameworks for Assessing Current Practice
| Framework | NCHRP 08-90 Gap Analysis Tool | ISO 55001 Asset Management Gap Analysis | International Infrastructure Manual (IIMM) | IAM Self-Assessment Methodology |
|---|---|---|---|---|
| Background | This tool was developed based on the tool and process created through development of the 2011 AASHTO TAM Guide. Uses a point scale for evaluating current and desired capabilities. See more | This is the most widely adopted standard for asset management globally. It is generic to accommodate many contexts. Describes a management system approach to asset management. See more | Recognizing that the ISO Standards for asset management are very much the “What to do”, the IIMM looks to provide the “How to do it”. Identifies an Asset Maturity Index (Aware, Basis, Core, Intermediate, Advanced) to identify the current and an appropriate level of asset management for each asset. See more | As an aid to the application of ISO 55001, the IAM decided to update their methodology into one that enables organizations in all sectors to measure their capabilities against the requirements of both PAS 55 and ISO 55001. See more |
| Assessment or Focus Areas |
|
|
|
|
| Why use this framework? | This framework is best for an agency that wants to work explicitly within a US-defined context that adopt wider influences. Since this tool can be fully customized by an agency, an agency that wants to tailor the analysis to their particular needs will find this useful. Finally, the tool facilitates the analysis of data, and can generate graphs and charts using the data imported into it. | This framework is ideal for agencies that want to adopt a world-recognized approach to asset management that provides a developed asset management lexicon. This is currently the most internationally-recognized standard in the world. | This framework has been refined over time with many examples that illustrate successful application of concepts by organizations. Public agency focused, and largely written for the asset management practitioner responsible for civil assets. | This standard is well recognized internationally, is infrastructure agnostic, and has applicability to infrastructure owners in both the private and public sector. It has many other resources developed along with the framework including training materials, reference guides and courses to upskill an agency. |
Amtrak
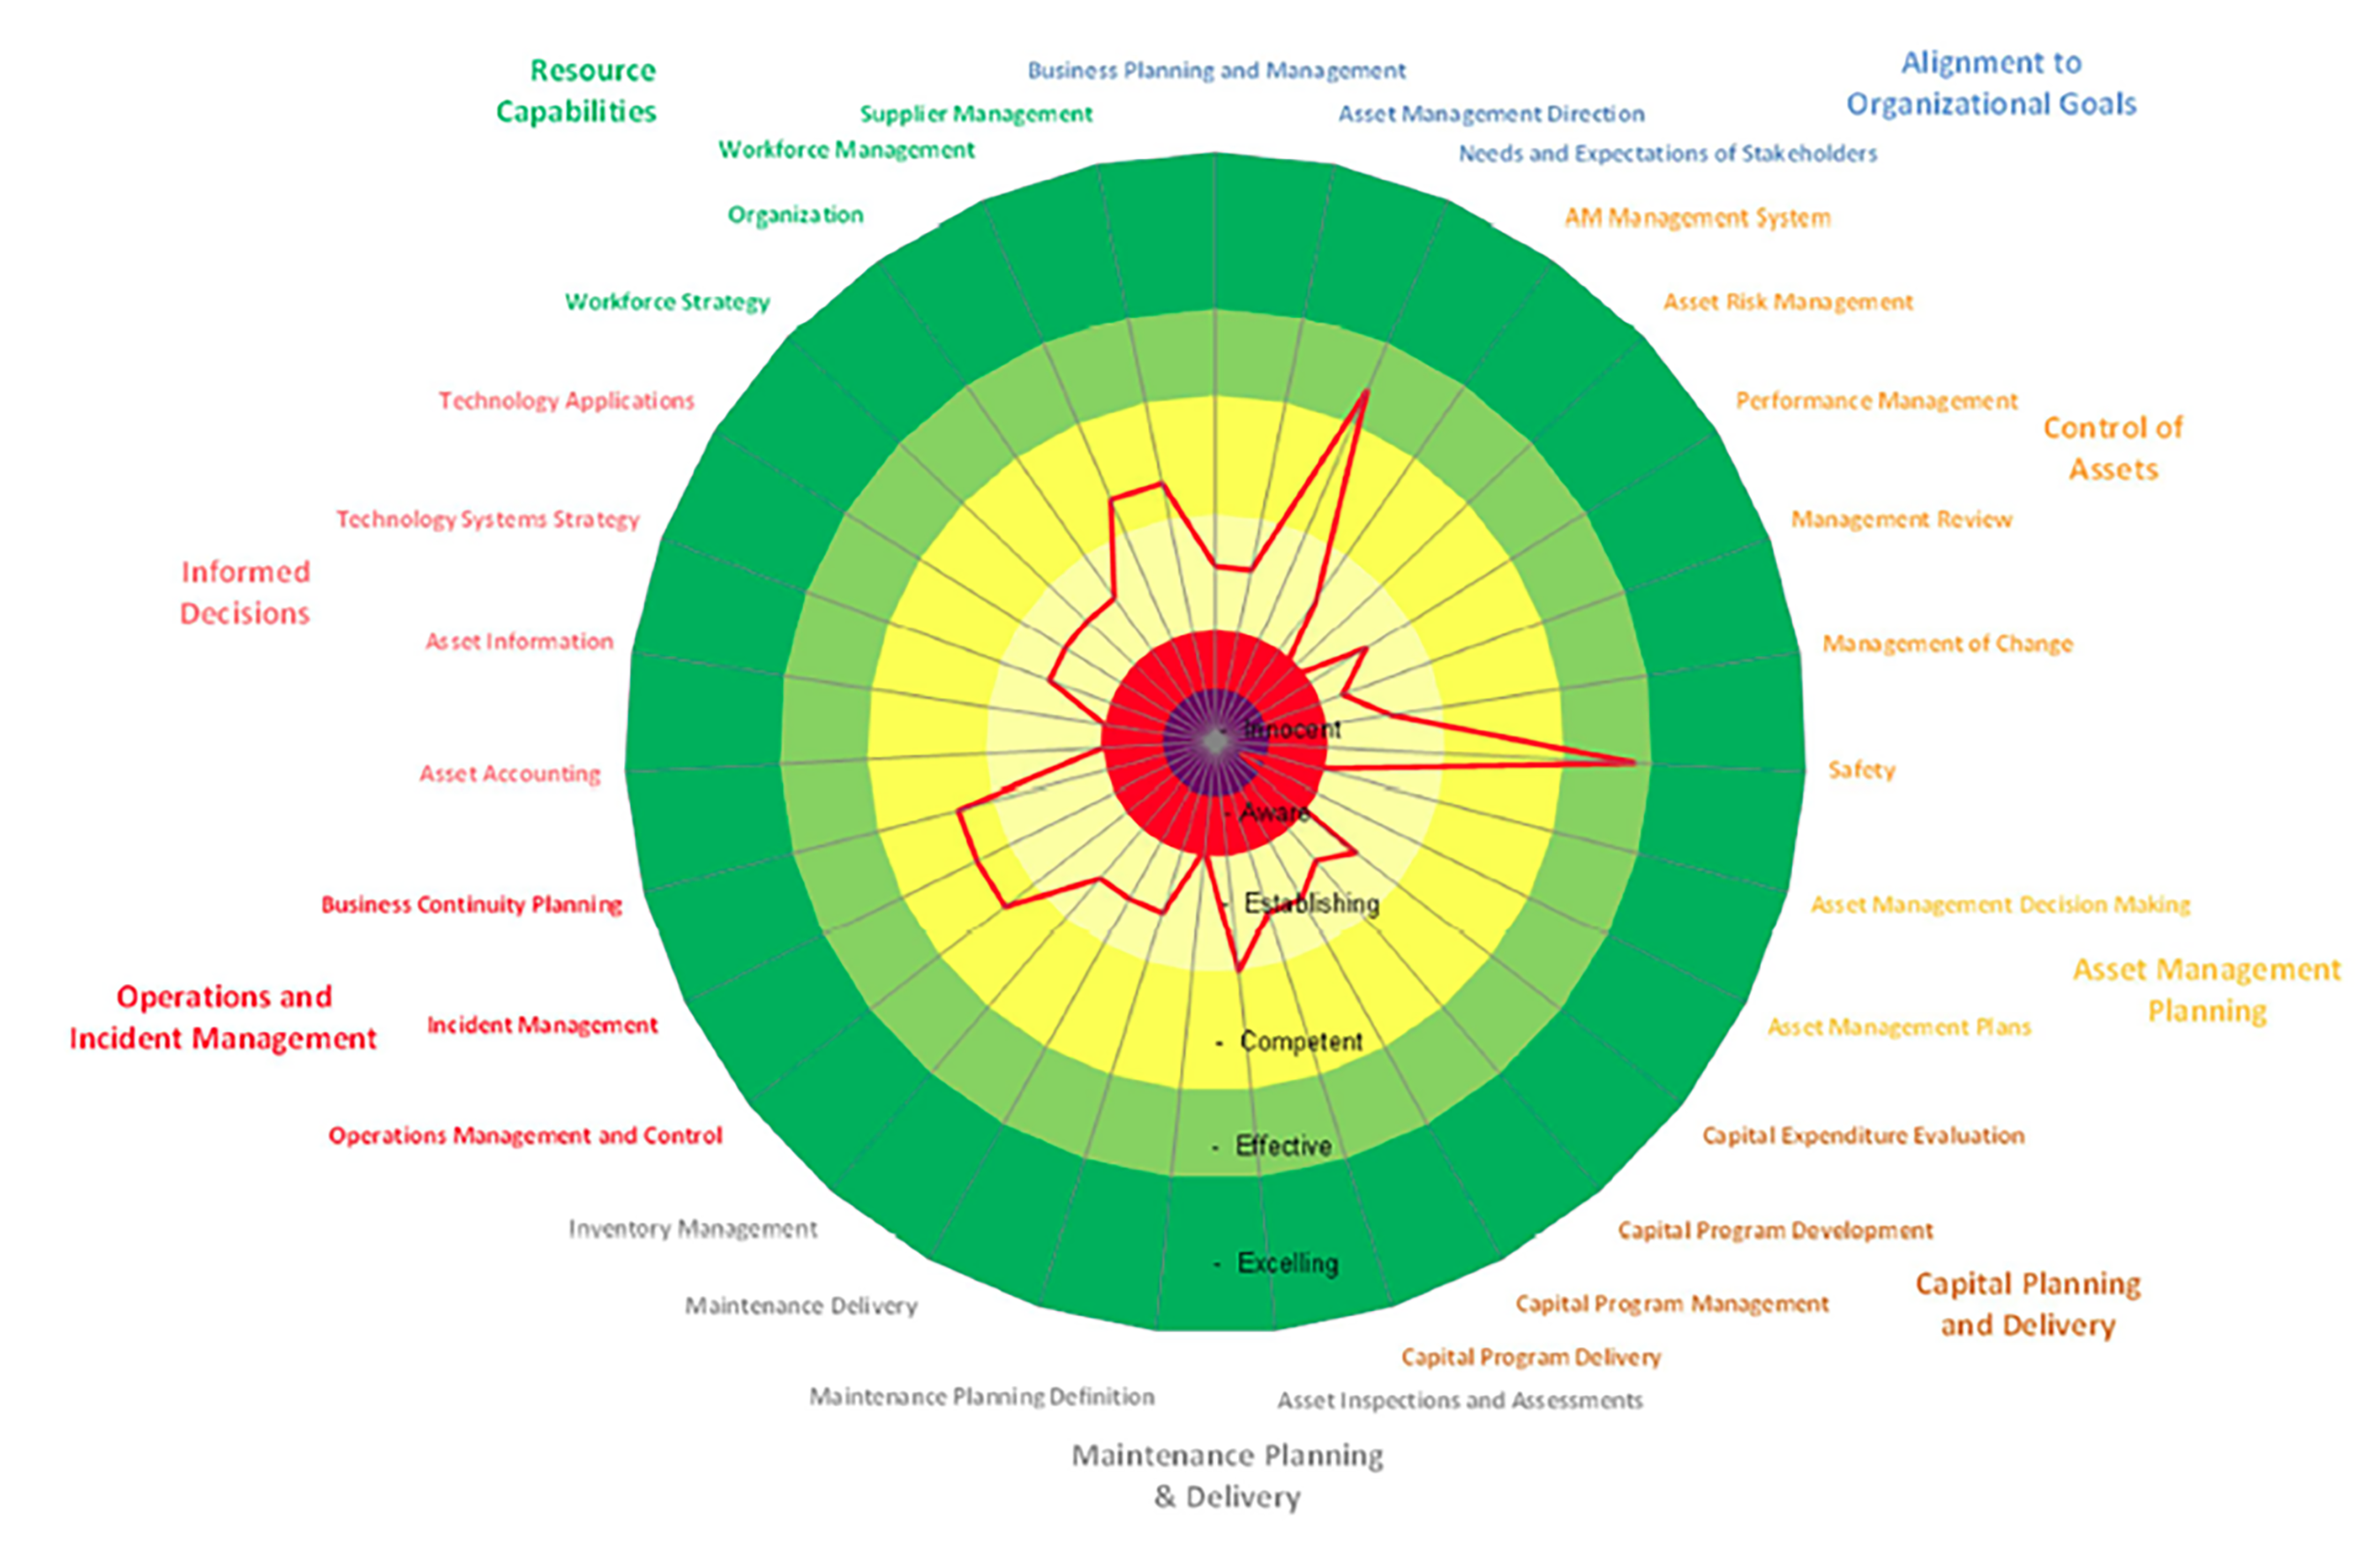
In 2016, Amtrak Engineering undertook an Asset Management Capability Assessment which bases maturity on the degree of formality and optimization of processes. The assessment uses several questions grouped into eight assessment areas, which describe operational processes necessary for asset management success. This maturity methodology is aligned with emerging guidance from the Institute of Asset Management (IAM), ISO 55001 standards, and requirements of the US FAST Act.
The assessment used a six-point scale, scoring Amtrak at the Establishing level, indicative of an agency that is actively developing asset management capabilities and establishing them to be consistent, repeatable, and well-defined.
Based on the 2016 assessment results, key challenges were identified and a series of improvement recommendations were developed and integrated into an Asset Management Improvement Roadmap.
In addition, Amtrak established a target position, driving process implementation priorities, with the intention of continuous monitoring by repeating the capabilities assessment process on an annual basis.
2016 Amtrak Asset Management Capabilities Assessment Results
Source: Amtrak Engineering 2019
Defining and Prioritizing Improvement in TAM Approaches
Agencies managing different types of assets are faced with the decision of where to prioritize advancing formal asset management. Determining where to improve the organizations effort can depend on different factors, but should always align with the organizational context and priorities.
For transportation agencies, asset management typically begins with the high-visibility, high-value assets, such as pavements and bridges. However, operating the transportation system requires a supporting cast of assets, typically referred to as ancillary assets, that include lighting structures, roadway signs, ITS assets or even operations facilities and technology hardware components. Establishing the appropriate management approach, and future desired approach for each asset is an essential step in strategic planning for asset management, defining boundaries around the effort. Furthermore, for each type of asset, it is important to determine how broadly to define the inventory of assets, such as the decision to include only arterial roads initially or all roads in a network.
Defining Appropriate Management Approaches for Different Asset Categories
An appropriate approach to manage and monitor each asset governed by the TAM framework needs to be established. Depending on the nature of the asset and the level of risk involved, different approaches can be selected by an agency.
Structuring asset management also involves evaluating different management approach- es and defining the appropriate level of maturity. There are several approaches to managing highway assets, each with different data needs, and several ways to structure and implement asset management processes. These include:
- Reactive-Based. Treatment is performed to fix a problem after it has occurred.
- Interval-Based. The asset is treated based on a time or usage basis whether it needs it or not.
- Condition-Based (Life Cycle Approach). Select intervention based on a forecasted condition exceedance interval.
Chapter 4 provides more details on these different approaches to managing assets.
Processes and approaches can range in their level of detail and complexity. This is what forms the foundation of some asset management maturity levels. Much like deciding on the scope of assets to manage, the level of advancement of the asset management processes an agency adopts should depend on the context and readiness of the agency, as well as the problem being addressed. Consideration should be given to the data, processes and tools available to support the asset management approaches and processes, as well as resource availability and capability. It is common for an agency to begin at a simple level and mature over time towards more complex asset management that integrates processes and decision-making.
Utah DOT
To accomplish the objective of allocating transportation funding toward the most valuable assets and those with the highest risk to system operation, UDOT developed a tiered system of asset management. Asset Management tiers range from one to three with tier one being the most extensive management plan for the highest value assets.
Tier 1. Performance-based management
- Accurate and sophisticated data collection
- Targets and measures set and tracked
- Predictive modeling and risk analysis
- Dedicated funding
Tier 2. Condition-based management
- Accurate data collection
- Condition targets
- Risk assessment primarily based on asset failure
Tier 3. Reactive management
- Risk assessment primarily based on asset failure
- General condition analysis
- Repair or replace when damaged
Source: Utah DOT. 2018. Utah TAMP. https://www.tamptemplate.org/tamp/053_utahdot/
Prioritizing TAM Improvements
Deciding on the appropriate management approach and level of asset management is a strategic decision that should consider several factors:
Organizational Strategic Goals
The decision of which assets to prioritize should be driven by the organization’s strategic goals. A desire to focus on one aspect of the transportation system over another in order to meet a larger objective can present a good reason for prioritizing some assets over others.
Asset Value
A common consideration for selecting assets to include is the financial value. Monetizing value provides a consistent way of comparing asset classes. In general, assets that are the most expensive to replace or cause the greatest financial concern for an organization fall into the highest priority. Strategic management of these assets means strategic investments over the life cycle of the asset, which will prevent or delay the need for significant additional investment, help avoid premature failure, and allow time to plan for appropriate replacement.
Data Availability
TAM as a concept is heavily dependent on data. Deciding on which assets to focus on based on existing data collection and management practices and will often support achievement of “quick wins.” Data availability does not always indicate strategic priority or risk exposure of the asset, but can still be an important factor in selecting assets to include the cost of collecting and analyzing data to form the basis for more advanced TAM decision making can in some instances be significant, and require new skills and training.
It should be recognized that data does not need to be comprehensive and complete as a basis for TAM decision making. An accepted approach is to group assets into classes (age, type, function) and then inspect a sample set. This can provide important insights to guide long-term planning at minimal initial expense/time. It can also highlight any issues with particular types of assets and allow for more detailed inspections to be undertaken if required. A gap analysis to define future data requirements and determine how to collect this data should be considered for long term TAM outcomes.
Risk of Failure
Often, it can be necessary to consider including assets if the probability and consequence of failure is significant. Assets with a high risk of failure can be a high priority due to the potential losses to the agency and its stakeholders should they fail. Asset management can alleviate or prevent the impact of failure.
Asset Criticality and Network Reliability
Decisions to formally manage certain assets can be based on their importance to the service provided, such as operations, or the importance of the travel paths under consideration. Defining criticality is context specific, but is important, since user experience is based on the journey, not the specific assets. Considering criticality in selecting assets to include in TAM will ensure that the most important assets–those necessary to maintain network reliability–are managed first.
Stakeholder Influence
In general, the scope of TAM should be agreed to in coordination with leadership and influenced by stakeholders. Stakeholders can be any asset owners, metropolitan planning organizations (MPOs), cities, tolling authorities, P3 concessions, federal (mandated requirements), and others. The public can also be stakeholders who influence which assets to include, especially when high-profile incidents potentially attributed to the state of good repair occur.
Aurizon
Aurizon is Australia’s largest freight rail operator, transporting more than 500 million tons of coal to markets including Japan, China, South Korea, India, and Taiwan, in addition to over 800 million tons of freight through an extensive network throughout the country. Aurizon Network manages the largest heavy haul rail infrastructure network in the country. The network is economically regulated by the State through a process that sets investment levels and tariffs. Asset management practice is well-entrenched in the organization, with a focus on “optimizing the life of assets, keeping a tension between investment in maintenance and capital.” The scope of the Aurizon Network asset base, known as the Regulated Asset Base includes all assets used in the provision of the rail infrastructure service. Management is informed by external engineering standards and legislative and regulatory obligations including:
- Prevention and intervention levels specified in an Asset Maintenance and Renewals Policy.
- Commitments to the Central Queensland Coal Network.
- A Safety Management System aimed to minimize safety risks.
- Network Strategic Asset Plan models which are based on asset age, predicted condition and historical and forecasted usage.
Source: Aurizon. 2019. Network: Planning and Development.https://www.aurizon.com.au/what-we-deliver/network#planning---development
Developing a TAM Implementation Plan
A TAM implementation plan can clearly communicate an agency’s next steps for TAM and define responsibilities for implementation.
The product of a gap assessment will often take the form of an implementation plan for TAM improvements. These improvements can involve changing behaviors across many business units within an organization. The actions should, therefore, be prioritized and staged to advance one step at a time. When defining actions, it is important to understand the purpose and outcome to be achieved, who is responsible, how long it will take and how many resources are required for it to happen.
Note that a TAM Implementation Plan is different from a Transportation Asset Management Plan (TAMP) described further in Section 2.4. An implementation plan focuses on business process improvement, while a TAMP focuses on an organization’s assets and how it is investing in and managing them. However, the implementation plan may be included as a section of a larger TAMP.
The improvements identified need to recognize potential barriers to implementation. As an example, improving decision-making tools will likely require improvements in data practices. The implementation plan should consider any foreseeable obstacles, including staff resistance to new business procedures, lack of support from agency leadership, inadequate skills among staff, data integration issues or outdated analytical tools.
Communicating the Implementation Plan
Effective, organization-wide communication can serve as a powerful tool to facilitate smooth and swift adoption of the TAM implementation plan. At the start of implementation, communicating the future vision and benefits can help build awareness and buy-in. Throughout the duration of the implementation initiative, communication about milestones and accomplishments can help sustain or regain momentum. Additionally, as different projects are initiated, delivered and completed, agencies will want to ensure that the resulting changes in processes, systems and tools are adopted and used consistently to achieve the intended outcomes and objectives. As illustrated in Figure 2.10, the TAM communication strategy should cover six key elements – why, who, what, when, how and how well.
Objectives. Why communicate?
Establishing early buy-in to the implementation plan by providing an upfront explanation of why execution of the TAM implementation plan is needed—the anticipated benefits for the organization as well as for different stakeholder groups—will help jumpstart success of the implementation.
Stakeholders. Who delivers and receives the communication?
To make sure the right people are receiving the right information, it is key to develop and categorize a complete list of internal and external stakeholders who will be impacted by the TAM implementation plan and its resulting changes. In determining stakeholders, consider who needs to receive different types of information and who best to deliver that information to support achievement of implementation plan objectives.
Messages. What are the messages to communicate?
In developing the key messages to communicate, consider intent – what should stakeholders know, think or do as a result of the message? Key messages should promote awareness, desire and reinforcement of the implementation plan and its associated changes. They should also align with objectives of the implementation plan as well as organizational objectives.
Timing & Frequency. When will the communication occur?
Communication about the TAM implementation plan and corresponding changes should be timely, frequent enough to keep stakeholder groups well informed about approaching milestones and key dates of impact, and not so frequent that they lose value. Take into account what is being communicated and to whom, as different stakeholder groups receiving different types of messages often require different delivery frequency.
Tactics & Channels. How will information be communicated?
Depending on the duration of the TAM implementation plan and the number of associated changes, communication needs often shift over the course of its execution. Agencies should determine the most effective types of communication and delivery channels as they progress through change. By including stakeholder categories, messages and frequency as inputs when determining the most effective channels, the communications strategy remains agile, which facilitates continuous improvement.
Continuous Improvement. How well is the communications strategy working?
Assessing the effectiveness or performance of any strategy is important for achieving objectives. Including a stakeholder feedback loop into the communications strategy is one way to accomplish this. Agencies can use surveys, polls, focus groups or meetings to gather information and gauge opposition and support. This crucial feedback serves as guidance for subsequent content and can lead to changes in the communications strategy.
Figure 2.10 Communicating the Plan
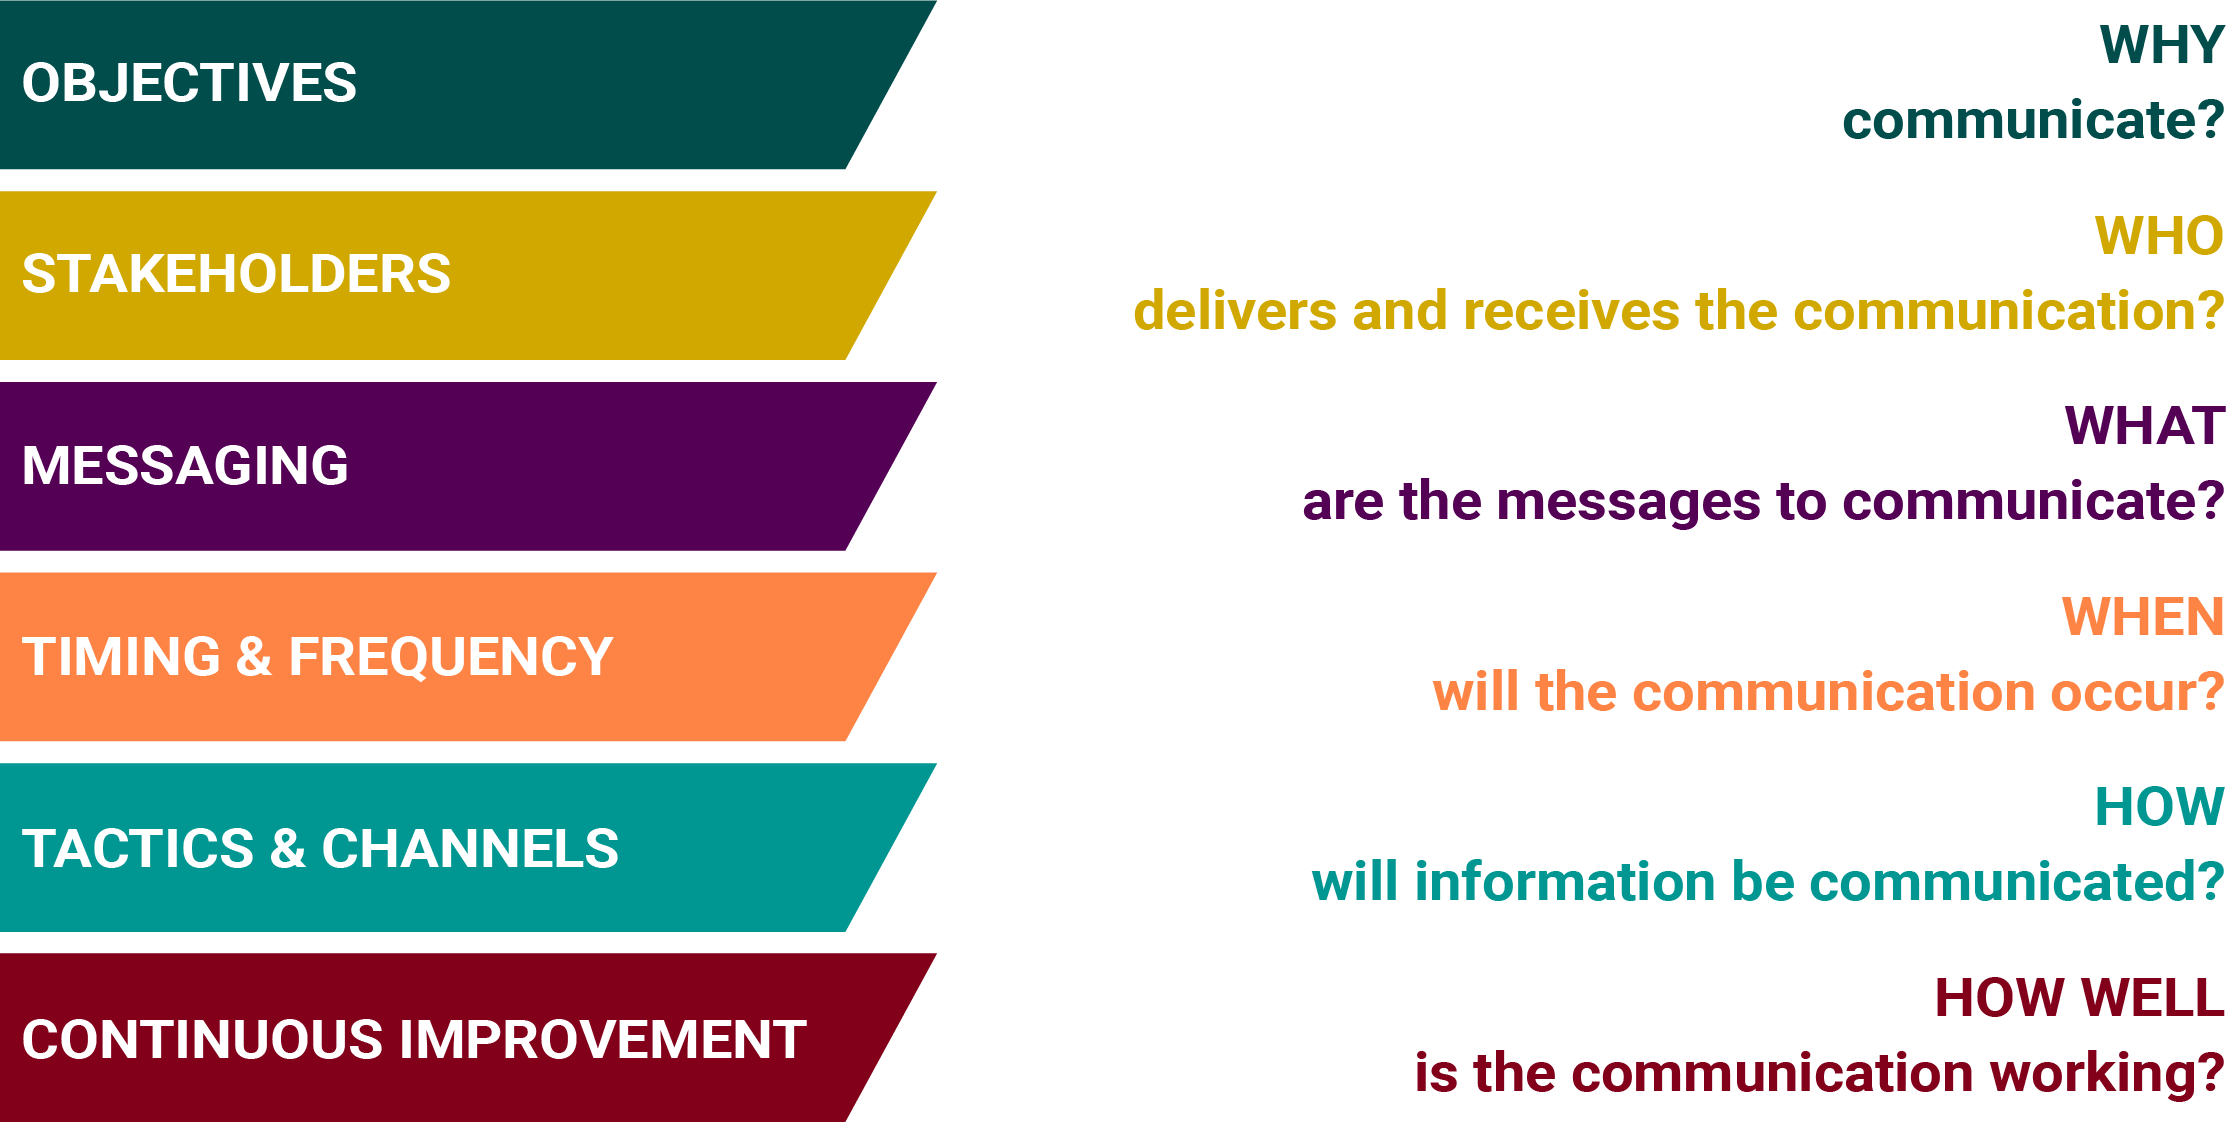
Key questions to answer in communicating your implementation plan.
Clackamas County DOT
Based on their gap assessment, Clackamas County Department of Transportation and Development established a Transportation Asset Management Strategic Plan (TAMSP), which documents its methods to implementing a comprehensive transportation asset management program over a five year period. This TAMSP was accompanied by an asset management implementation strategy that identified the key actions to be undertaken.
Clackamas County, 2051 Kaen Road #426 Oregon City, OR 97045
Extract from Clackamas County DOT Implementation Plan
Monitoring TAM Program Improvements
Measuring TAM improvement is important for understanding if the plan needs adjustment, and to communicate success and motivate those responsible for implementation.
Once a commitment to make improvements has been made, the improvement process needs to be managed and monitored.
Regular updates, meetings, performance tracking (monitoring improving performance against the selected framework) and scheduled reviews by the TAM Governance Groups will help provide oversight to those responsible for undertaking the improvements.
This process also helps remove roadblocks by involving leaders from across the organization.
When to Re-Assess Performance
A regular commitment to monitor progress is important. This assessment will compare progress from the initial benchmark toward the desired level of competency. There is no set recommendation for when to assess progress; some agencies find it more important in the early stages of implementation, while others do not.
When considering the timing of progress assessments, it is important to consider:
- Process checkpoints. The frequency could be aligned with reporting requirements, but should also consider appropriate points where progress will be noticeable.
- Commitment. Undertaking an assessment will take time and resources, so it is important this is balanced against progressing with implementation.
- Champions and change agents. As these individuals are critical to the overall success of TAM implementation, if they change or need to monitor their own performance, then a review of progress can help motivate and reset goals.
Measuring Performance Improvements
Monitoring performance of the asset management system and the results of improvement actions can be challenging, as the cost of service delivery, quality of service levels and risk of service failures may shift over time, and can change following the implementation of an improvement action. The IIMM suggests some of the following potential TAM system performance indicators:
- Financial performance
- Data management performance
- Timeliness relative to target response times
- Productivity and utilization of resources
- Skills availability relative to planned requirements
- Adherence to quality procedures
Chapter 6 provides more information on performance measures, targets, and monitoring asset performance. Self assessment can focus both on service / asset outcomes experienced by users, as well as be internally focused to determine how well the agency is aligned with desired practices. It is important that agencies consider and select the appropriate level and focus of self-assessment for their requirements.
TIP
TAM Maturity Assessments should end with an Improvement Program, highlighting areas for self-improvement, which can then be prioritized according to agency priorities or strategic direction.
New Zealand Treasury
The New Zealand Treasury stewards the NZ government’s Investment Management System to optimize value from new and existing investments and assets for current and future generations of New Zealanders. One of the tools the system uses is the Investor Confidence Rating (ICR), which illustrates the confidence that government leadership (i.e. Ministers) can have in an agency’s ability to deliver investments that produce the desired results.
The ICR also promotes and provides a pathway for capability uplift. One element of the ICR evaluates the gap between current and target asset management maturity levels on the basis that good asset management practice provides the foundation for good investment management. The Treasury recommends periodic self-assessments using a methodology based on international asset management guidelines and the ISO 55001 standard.
The ICR assessment is conducted every 3 years, resulting in more decision-making autonomy for agencies that obtain a good rating and potential flexibility over investment assurance arrangement.
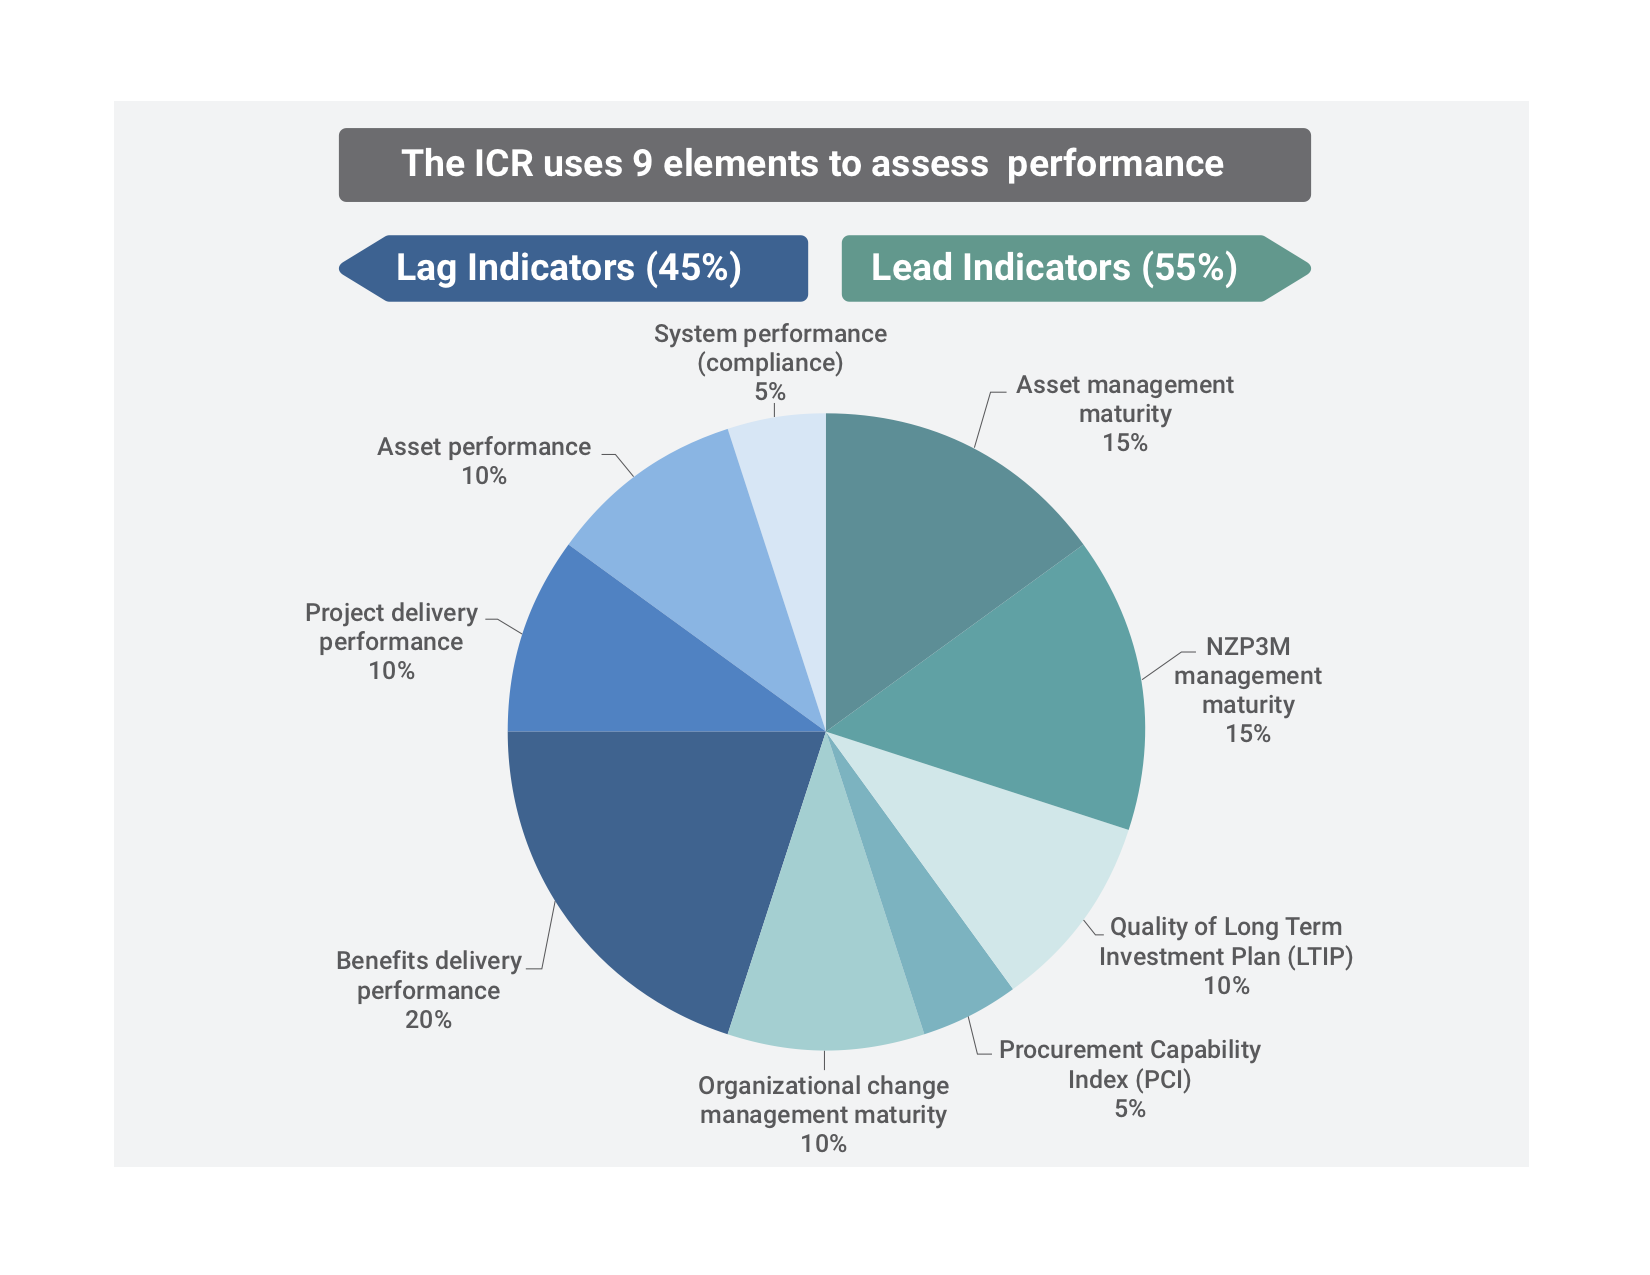
Adapted from New Zealand Treasury. Investor Confidence Rating (ICR).
https://treasury.govt.nz/information-and-services/state-sector-leadership/investment-management/review-investment-reviews/investor-confidence-rating-icr
Defining Life Cycle Management
Through life cycle management, agencies employ data on asset condition, treatment options, costs, deterioration rates, replacement cycles, and other factors to determine the most cost-effective, long-term strategies for managing assets throughout their lives.
All transportation infrastructure assets have a life cycle, which includes several stages from initial construction to removal or replacement (see figure 4.1). Life cycle management is an investment approach that considers maintenance, renewal, replacement, or repair options through an asset’s service life with the intent to maximize the benefit provided by the asset at the minimum practicable cost. It employs data on asset condition, treatment options, costs, deterioration rates, replacement cycles, and other factors to evaluate trade-offs between possible investment strategies and treatment timings. Effective life cycle management requires knowledge of the agency’s strategic priorities and an understanding of the performance criteria driving investment decisions, so the right management strategy can be identified and implemented for each asset class. Aligning asset management measures with agency priorities ensures the investments made to extend asset service life provide the maximum impact to the agency’s long-term goals.
Figure 4.1 illustrates a variety of interventions that occur over an asset life cycle. The larger circles represented in the figure are service life altering, and represent a capital investment in infrastructure. Capital investments provide significant life extension, and may alter or enhance the operational nature of the asset, e.g. expand capacity, without fully replacing the asset. Maintenance (reactive, interval based and routine) activities are required throughout the life cycle to ensure the asset achieves its service life. Preservation treatments restore condition or performance to achieve service life, and may extend service life as well, but do not significantly alter the operational nature of the asset. Some agencies may capitalize investment in these preservation activities; however, regardless of the timing and character of the selected interventions, all of them are part of the life cycle management process. More (lower cost) maintenance interventions can offset the number and cost of the larger (and more costly) interventions. Balancing the right intervention, at the right time, can greatly reduce the overall investment needed for infrastructure to be reliably available for providing service.
Figure 4.1 Stage of an Asset Life Cycle
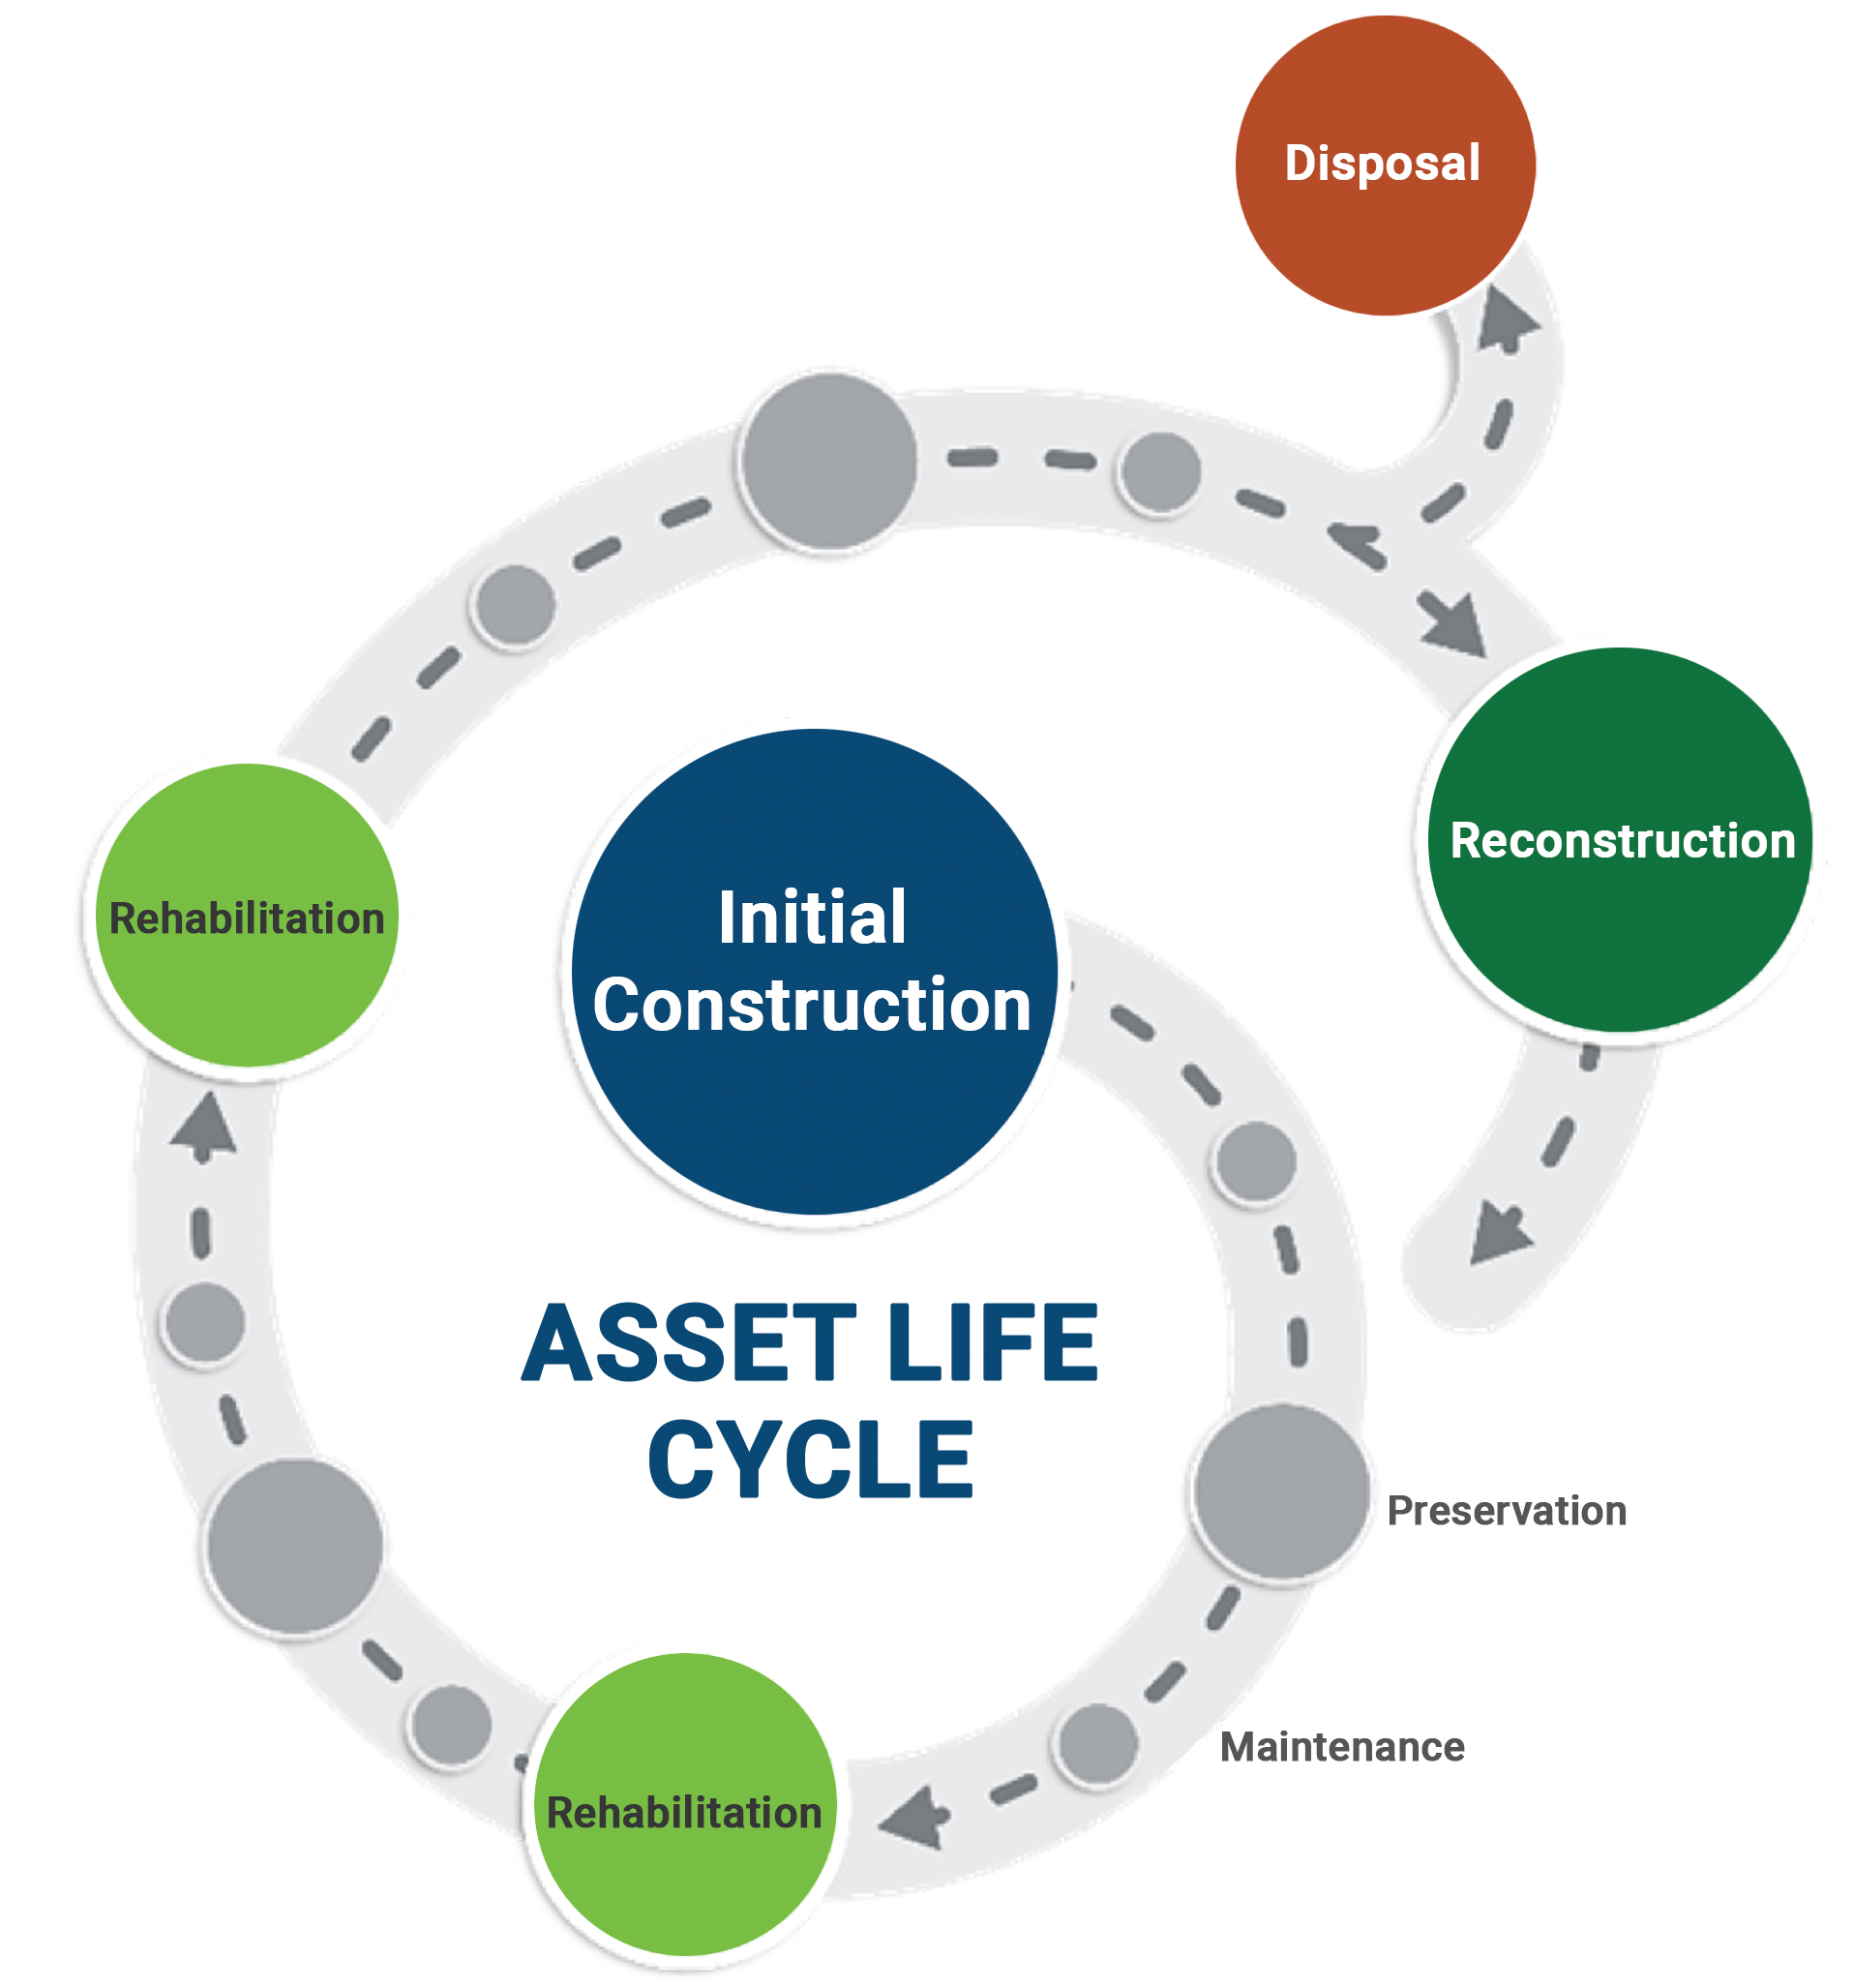
Source: Applied Pavement Technology, Inc. 2017
Life cycle management can be used at both network level and at project level. At network-level, life cycle management considers the needs of an entire asset class, as well as the available funding, to determine the most appropriate life-cycle strategies. For example, analysis can establish the optimal proportions of overall investment that should be allocated to different types of interventions over the network, to minimize investment to achieve performance targets or an average condition level. At a project level, life cycle management is commonly used to develop asset-specific strategies. Project level life cycle plans provide input into the network level life cycle plans. Large bridges or other distinct network components are often planned and managed in this manner.
Life Cycle Cost Analysis (LCCA) is an engineering-economics approach that can be used to quantify the differential costs of alternative design approaches. Network level life cycle management, while a more holistic process that manages every stage of an asset’s life, may employ LCCA or other forms of analysis to inform management decision-making. Figure 4.2 highlights some of the major differences between life cycle management and life cycle cost analysis. At the network level, LCCA can be used to understand how to best manage the network as it ages. At a project level, it is used to understand what are the most effective actions to be taken on the assets within the project scope at the time of project delivery. Both network level and project level analyses contain many aspects of engineering economic analysis, such as consideration of user benefits, user costs, and the time-value of money to identify alternatives that represent the lowest practicable life cycle cost over the analysis period to achieve the desired objectives.
Figure 4.2 Attributes of network level life cycle management and project level life cycle cost analysis
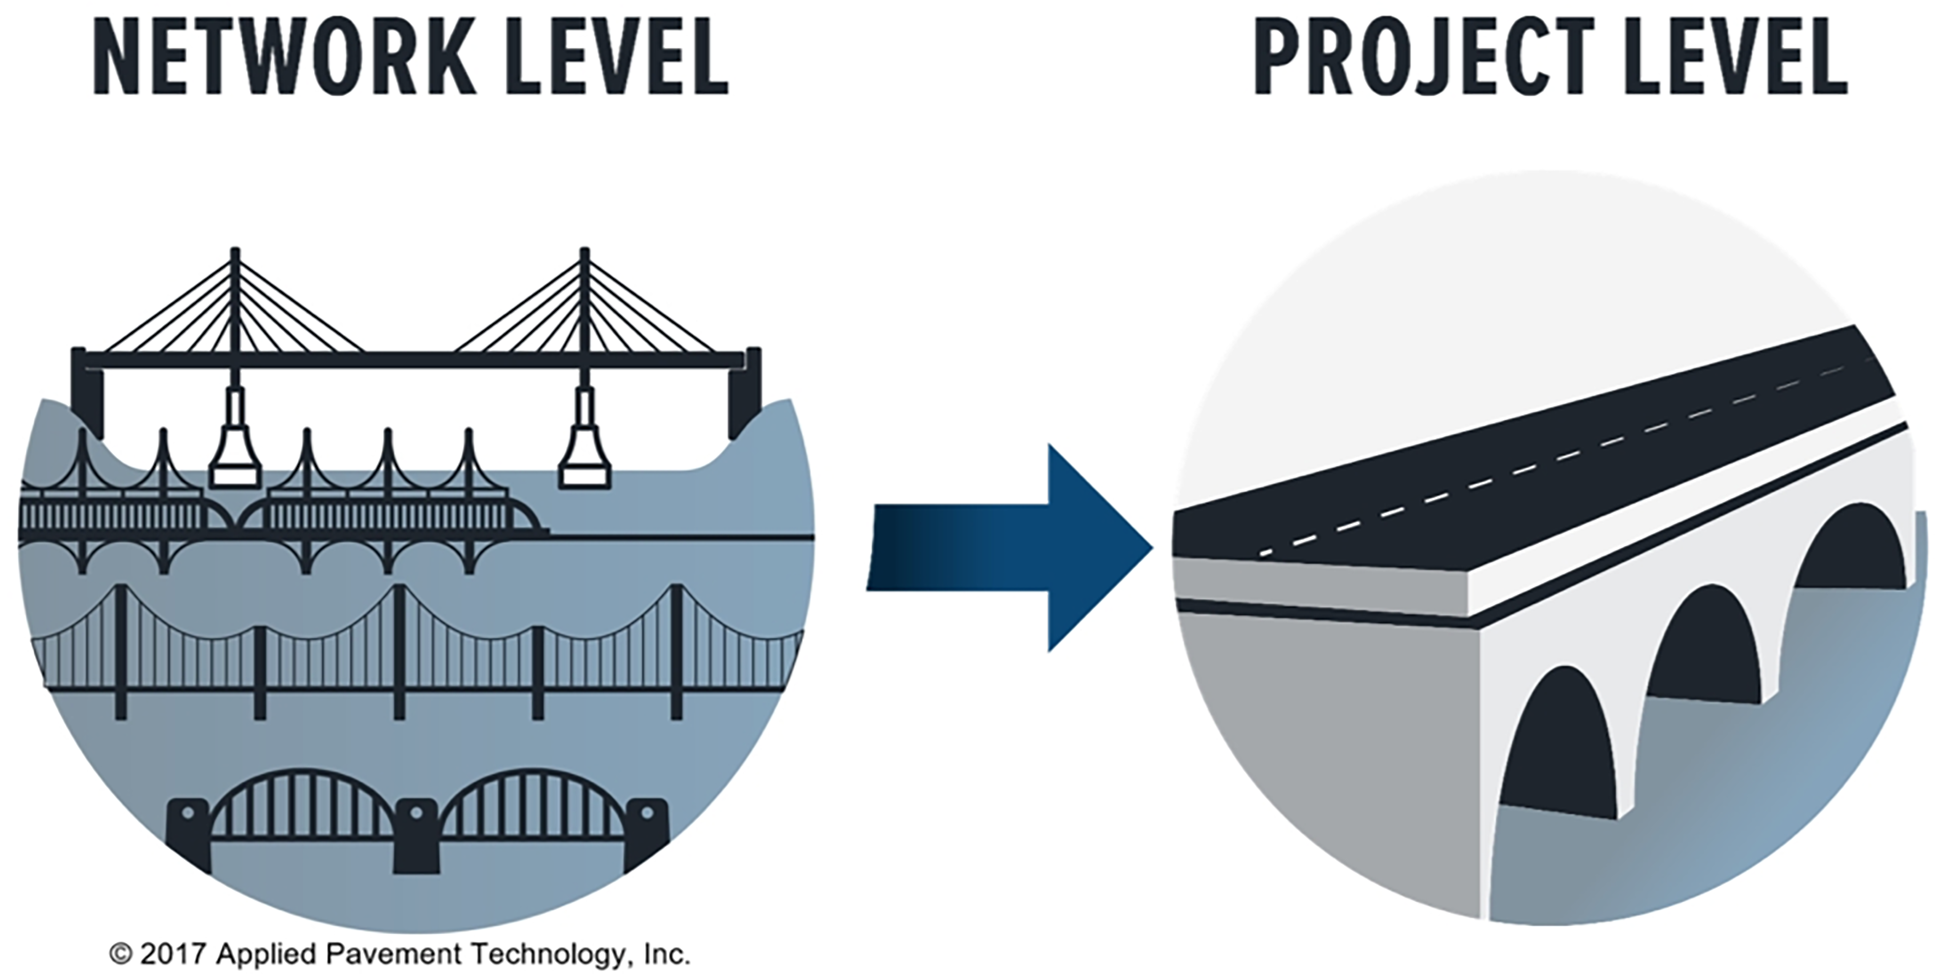
- High level.
- One asset class or subclass.
- Multiple locations.
- Looks at impacts of varied treatment timing.
- Considers future cost changes.
- Detailed.
- Multiple asset classes.
- Single location.
- Treatment timing fixed for all options.
- Uses discount rate.
Source: Applied Pavement Technology, Inc. 2017
Decision Making Context
Life cycle management is driven by the need for owners to provide consistent service to those that use the transportation system with the resources available. Infrastructure decision making can take place at several levels within an organization, and in each case, considers different but often interrelated factors. These are illustrated in table 4.1.
Table 4.1 - TAM Decision-Making Contexts
Key Questions and Connections to Other Chapters
| Strategic | Tactical | Operational | |
|---|---|---|---|
| Key Decisions | Setting goals and objectives. | Capital investment prioritization and scoping and Integration of maintenance and renewal strategies | Delivery of the capital program, routine maintenance, and highway-operations activities. |
| Decision Makers |
| Directors and managers who are asset stewards. | District and field mangers, supervisors, and staff. |
| Key Questions |
|
|
|
| Other Factors | Decisions and outcomes of these strategic questions help focus investment. They add value to overall performance of the transportation system by setting priorities, values, and help prioritization of investment at lower levels. Creating new assets and disposing of existing ones are strongly influenced by decisions and priorities defined at this level. Chapter 2 discusses these considerations in more detail, and the level of service section in this chapter discusses linking these strategic priorities to decision-making at lower levels. Performance and target setting in Chapter 6 also discusses this linkage and how targets can be set to achieve these strategic goals. | This Chapter focuses on these questions and on the analysis that informs their corresponding answers and decisions. Life cycle management and analysis focuses on the existing transportation system and evaluates how:
| Delivering a program work, ranging from maintenance activities to capital improvements, requires a coordinated management of a large workforce. It requires processes that minimize input of resources to get the output required for desired system performance. Work management systems, efficiency and improvement techniques and performance management focus on improving decisions at this level. These concepts are discussed in Chapter 5, 6 and 7. |
Figure 4.3 Analysis of KYTC Future Costs Under Two Strategies
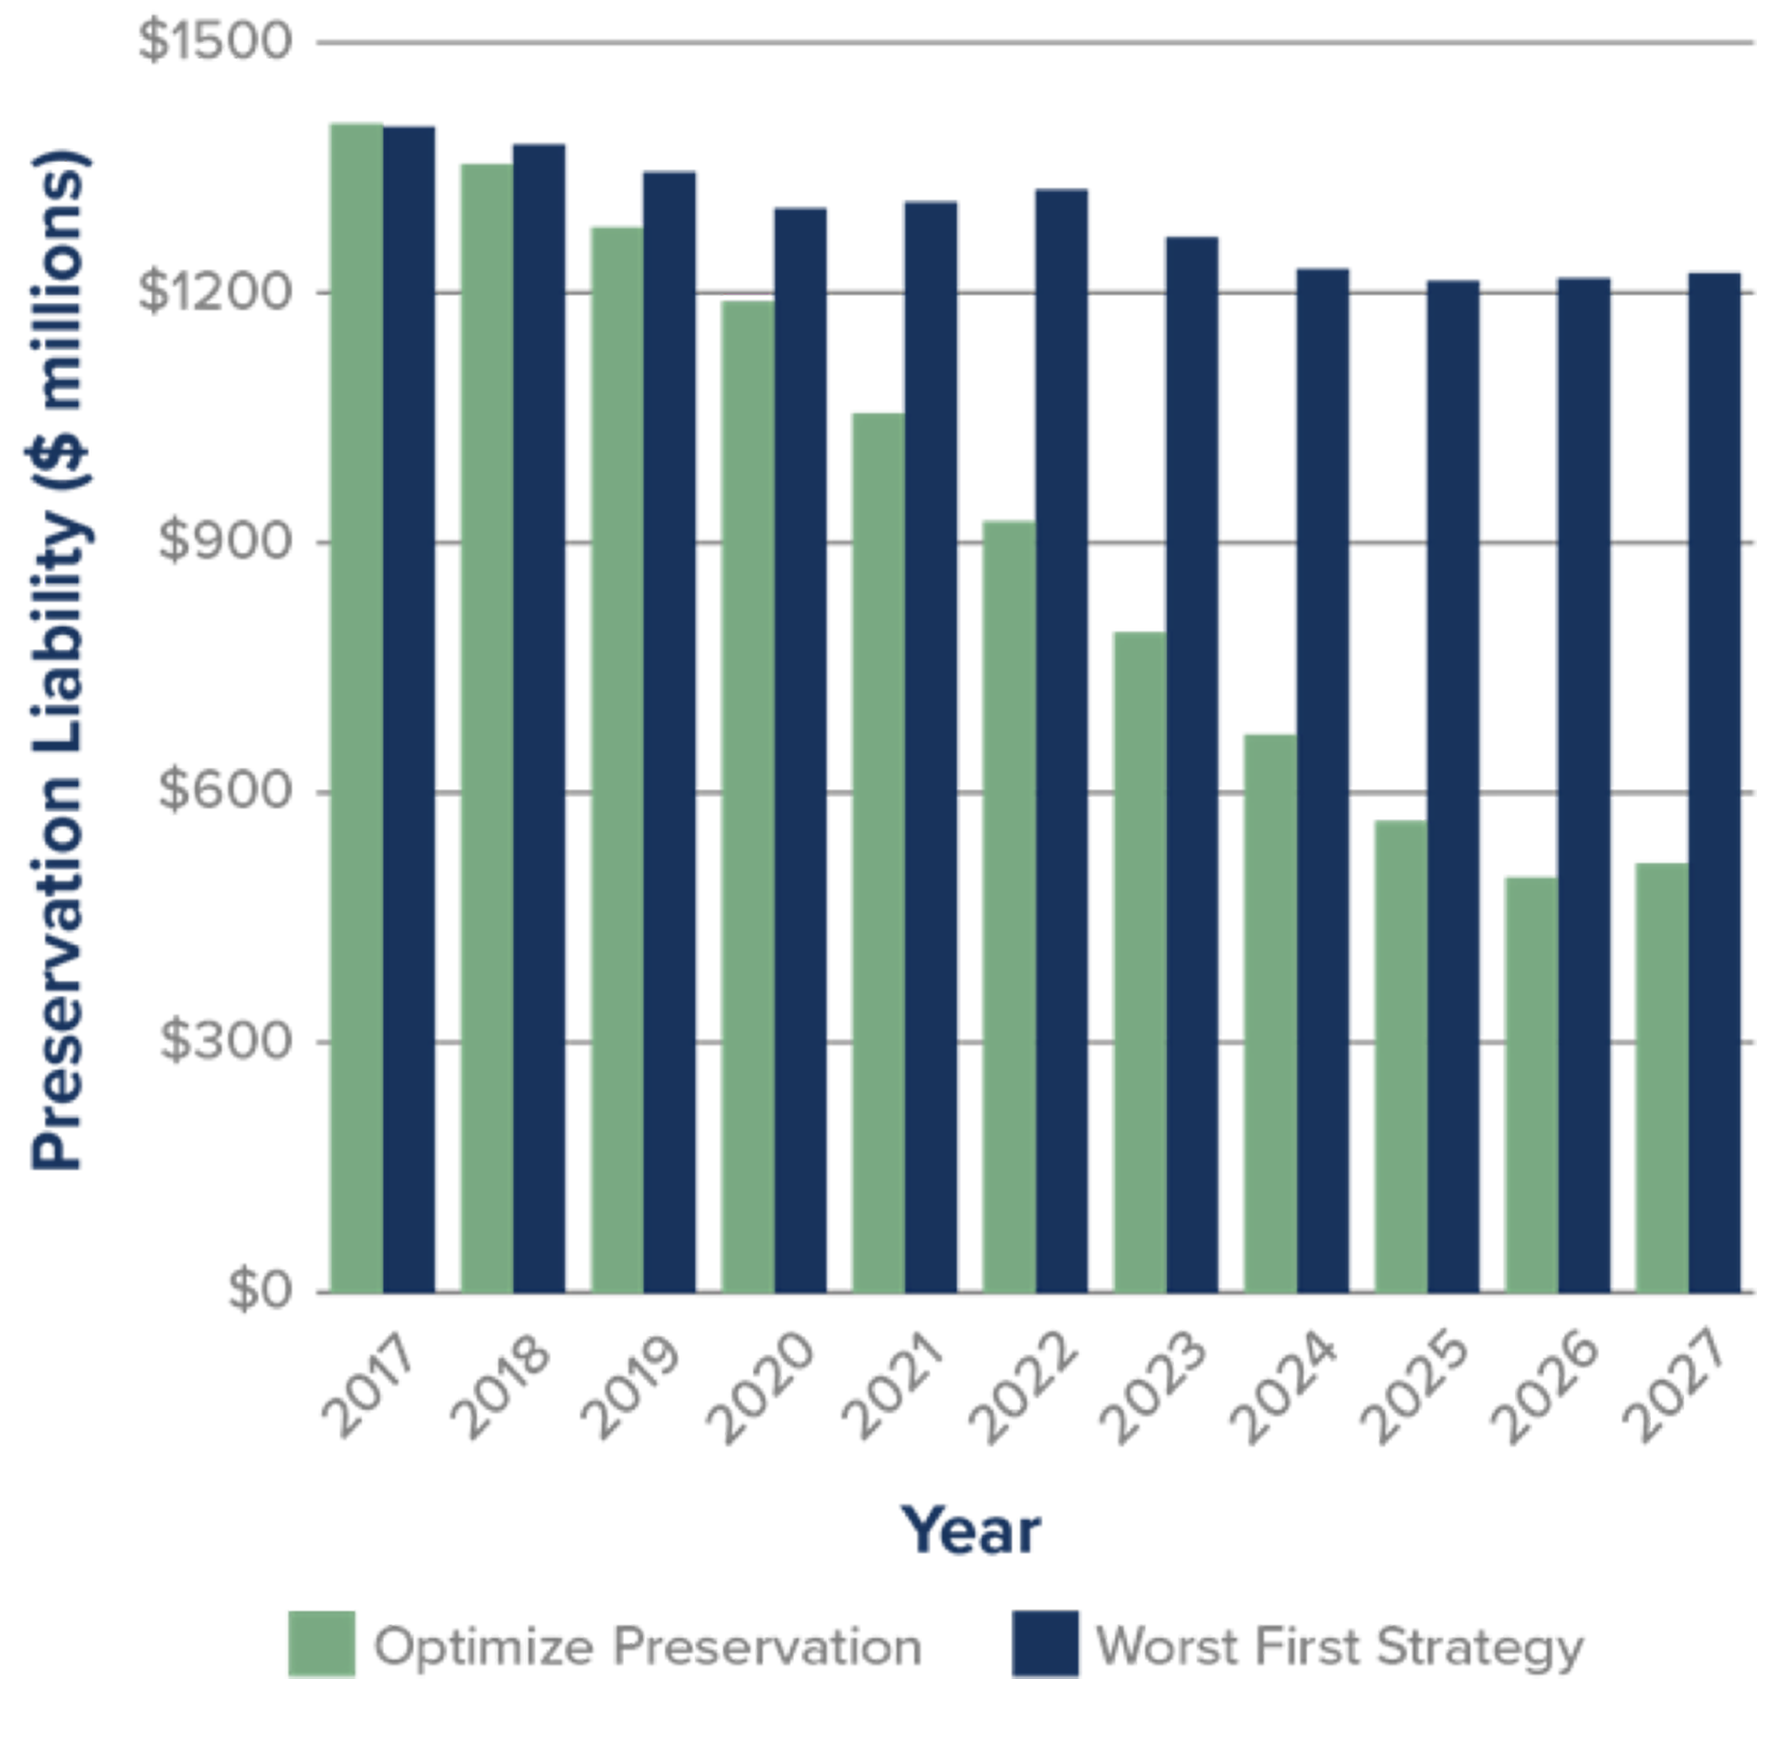
Source: Kentucky Transportation Cabinet Transportation Asset Management Plan, 2018.
Kentucky Transportation Cabinet (KYTC)
In the early 2000s, KYTC found that the cost of hot-mix asphalt (HMA) was increasing faster than its budget to maintain pavement conditions. In response, KYTC evaluated the feasibility of strategies that relied heavily on preventive maintenance overlays such as thin HMA overlays (< 1 inch), chip seals, cape seals, and slurry seals. KYTC found that while the costs of these treatments were substantially less than a traditional HMA overlay, their service lives were only marginally shorter. As a result, the agency began increasing the use of these treatments on its secondary system. As part of developing its risk-based TAMP in 2018, KYTC evaluated life cycle strategies, as shown in Figure 4.3 Analysis of KYTC Future Costs Under Two Strategies that expanded the use of preventive maintenance overlays to its parkway and interstate pavements. The analysis results led the agency to select a life cycle management strategy that maximizes the use of preventive maintenance overlays on secondary roads and parkways and increases their use on interstate pavements over time. As shown in Figure 4.3, this new life cycle strategy achieved conditions over the 10-year TAMP analysis period that would have cost an additional $644 million if they had continued to rely on traditional 1- to 2-inch HMA overlays. By implementing these improved strategies, KYTC has significantly reduced the risk that the infrastructure will reach an unsustainable cost to maintain in the future.
Source: KYTC Transportation Asset Management Plan, 2018. http://www.tamptemplate.org/wp-content/uploads/tamps/048_kentuckytc.pdf
Defining Asset Service and Performance Levels
Before asset performance can be managed, an agency must first define what it is seeking to achieve. In TAM, asset performance is most commonly defined in terms of asset condition or maintenance level of service. Performance may also be evaluated in terms of safety, availability, reliability, resiliency and other service attributes. Regardless of the method used to monitor performance, it should be used to inform analysis that supports decisions to help ensure that investments enable an agency to achieve its goals cost-effectively.
Establishing Desired Levels of Service
Before a whole-life strategy can be developed and implemented, an agency must determine what they seek to achieve. In many transportation agencies, the desired level of service (or asset management organizational objectives, in ISO 55000 terminology) provides the linkage between what the goals of an agency are, and what investments and interventions should take priority when managing assets. High level goals should directly influence investment choices when resource allocation decisions are made. Service levels help establish when gaps need closing to achieve a goal, and merits investment. Chapter 2 discusses ways to create linkages between goals and investment decision making.
When managing the life cycle of existing assets, performance targets are commonly established as a way to manage service levels for the transportation network. How to determine the expected level of performance may vary depending on the type of asset being managed. Level of service targets that are part of performance framework typically are a mixture of both customer focused performance measures, and technical service measures that help those responsible for the asset assess what types of interventions might be required and when. Customer focused service measures are important to road users and other stakeholders that require mobility. Travel time reliability, safety, load capacity and clearances, and lane availability are all examples of service targets that are customer focused. Condition, strength, regulatory compliance and examples of technical service attributes are commonly of greater interest to asset stewards than asset users. Both types are service level targets that are important to evaluate the efficacy, effectiveness and efficiency of a transportation system.
TIP
“The organizational objectives provide the overarching context and direction to the organization’s activities, including its asset management activities. The organizational objectives are generally produced from the organization’s strategic level planning activities and are documented in an organizational plan.” (ISO 55000, 2.5.3.4) These organizational objectives are analogous to strategic objectives typically found in long range transportation plans.
For pavements and bridges, and other assets managed using a condition-based approach, asset condition is commonly used to establish expected technical levels of performance, but also is relevant to customers. For example, condition is employed as a proxy in this way for pavements because it is objectively measurable, deterioration has some predictability. It is a valuable service attribute because often, user experience is also directly connected to condition as well. Potholes, rutting and roughness all reduce quality of service from a pavement. Performance measures, such as those discussed in Chapter 6, are used to establish the desired long-term performance and to set short-term targets that can be used to track progress towards the long-term objectives. For other highway assets, including those managed using interval- or time-based maintenance approaches, performance may be linked to the expected service life, the ability of the asset to fulfill its intended function, and/or other operational factors. For these other highway assets, performance targets are often established as part of a Maintenance Quality Assurance (MQA) program in terms of desired maintenance levels of service (MLOS) and integrated with operational service targets that may also be customer focused.
Risk can also be used as a measure of performance. As described in chapter 2, risk considers both the potential impact and consequence of failure. This can be particularly useful when the potential consequences of failure impact other assets or facilities. An example of how Colorado uses risk to manage rockfalls is included in section 4.3 of this chapter. Additional details on how to track risk-based performance measures is included in Chapter 6.
Establishing a desired level of performance is typically a collaborative process that considers existing conditions, available funding, expected demands on the system, policy goals and guidance, and stakeholder priorities. The desired level of performance is typically established once baseline data is available, so performance trends can be evaluated. The desired level of performance may be adjusted over time to reflect changes in agency performance, changes in asset condition, capacity, safety, resiliency and other factors.
Three types of service expectations are often used in combination to manage asset performance:
- Performance target – the level of performance beyond which additional performance gains are not desired or worth the additional cost. When performance is measured based on condition, the desired performance may describe the desired state of good repair. There may be an expected specific time frame to achieve this desired performance target.
- Current Performance – an intermediate level of performance achieved by the organization and is usually reported relative to the desired target. Target setting is described in more detail in Chapter 5.
- Minimum acceptable performance – the lowest level of performance allowed for the asset or asset class to still function as designed.
Performance expectations may be set for the road network, a road corridor, for individual assets or for a group of assets. Commonly, performance expectations are set using a combination of asset class or subclass or sub network, such as:
- Key network corridors.
- Bridges on the National Highway System.
- Interstate pavements.
- Culverts larger than 10 feet in diameter.
- Traffic signals serving more than 10,000 vehicles per day.
TIP
A desired state of good repair is often established as the level of performance beyond which further performance gains are not necessary or desirable, usually represented as a condition state for a set of assets.
The nature of performance expectations can be either strategic or tactical or operational. Strategic expectations support freight movement; for example, the long-term goal of providing unrestricted flow of legal loads is supported by a performance expectation of no load-posted or restricted bridges on interstate highways. This expectation cannot be accomplished without the tactical delivery of work to address factors contributing to the physical condition of bridges. Thus, an agency may include tactical expectations to perform maintenance and repair on structural members on a routine basis or as conditions warrant. These enhancements can be also integrated with renewal and other rehabilitation interventions to help improve both tactical performance metrics, as well as achieve higher level goals and objectives. Operational improvements such as more responsive snow clearance, and better signage are all integrated treatment options to achieve the strategic objective.
Life cycle management analysis, and the decisions it supports, require service levels, performance targets and other objectives to be able to determine the optimal choices for agencies to select during resource allocation. Over an asset life cycle, a range of interventions are possible, from reactive, routine and preventative maintenance, to large investment associated with renewal, replacement, or removal. Having targets helps select the right interventions and investment option while balancing risk, service and cost.
Connecting performance measures to higher level strategic goals also supports an agency’s ability to communicate how technical measures relate to system performance as experienced by highway users and other external stakeholders, thus tying asset management outcomes to system performance. Asset management measures are often very technical. Performance indicators like bridge ratings, pavement distress measurements, and risk ratings are not commonly understood by those outside transportation agencies. However, agencies can use these technical measures to support the performance indicators that are more commonly understood and prioritized by system users and external stakeholders. Communicating system performance and the status of the road network is discussed in Chapter 2, and is illustrated in several examples below. Customer service level targets are often established for this purpose, and give users an ability to understand the quality of service they should expect on the transportation system.
Colorado DOT
Each year, the Colorado DOT must report to its legislature on the statewide highway infrastructure and the agency’s ability to meet those needs with available resources. This requirement is met through the Annual Infrastructure Deficit Report, which addresses pavements, bridges, and annual maintenance. The agency supports the annual maintenance portion of this report with its Maintenance Level of Service Measure, which rates the delivery of services in nine program areas in terms of a letter grade from A to D and F. The agency has used historic data to develop deterioration rates for each service area that estimate the resources needed to improve the maintenance level of service by a given amount over a specific time period. These estimates are summarized in the Report, which is in turn used by the Legislature and the DOT to establish the annual maintenance budget. The figure provides an example of information on MLOS in the 2016 Report. Once the targeted MLOS is established, maintenance funding can be allocated to ensure that agency priorities are met.
Colorado DOT Example of Funding Needed to Support Maintenance Levels of Service
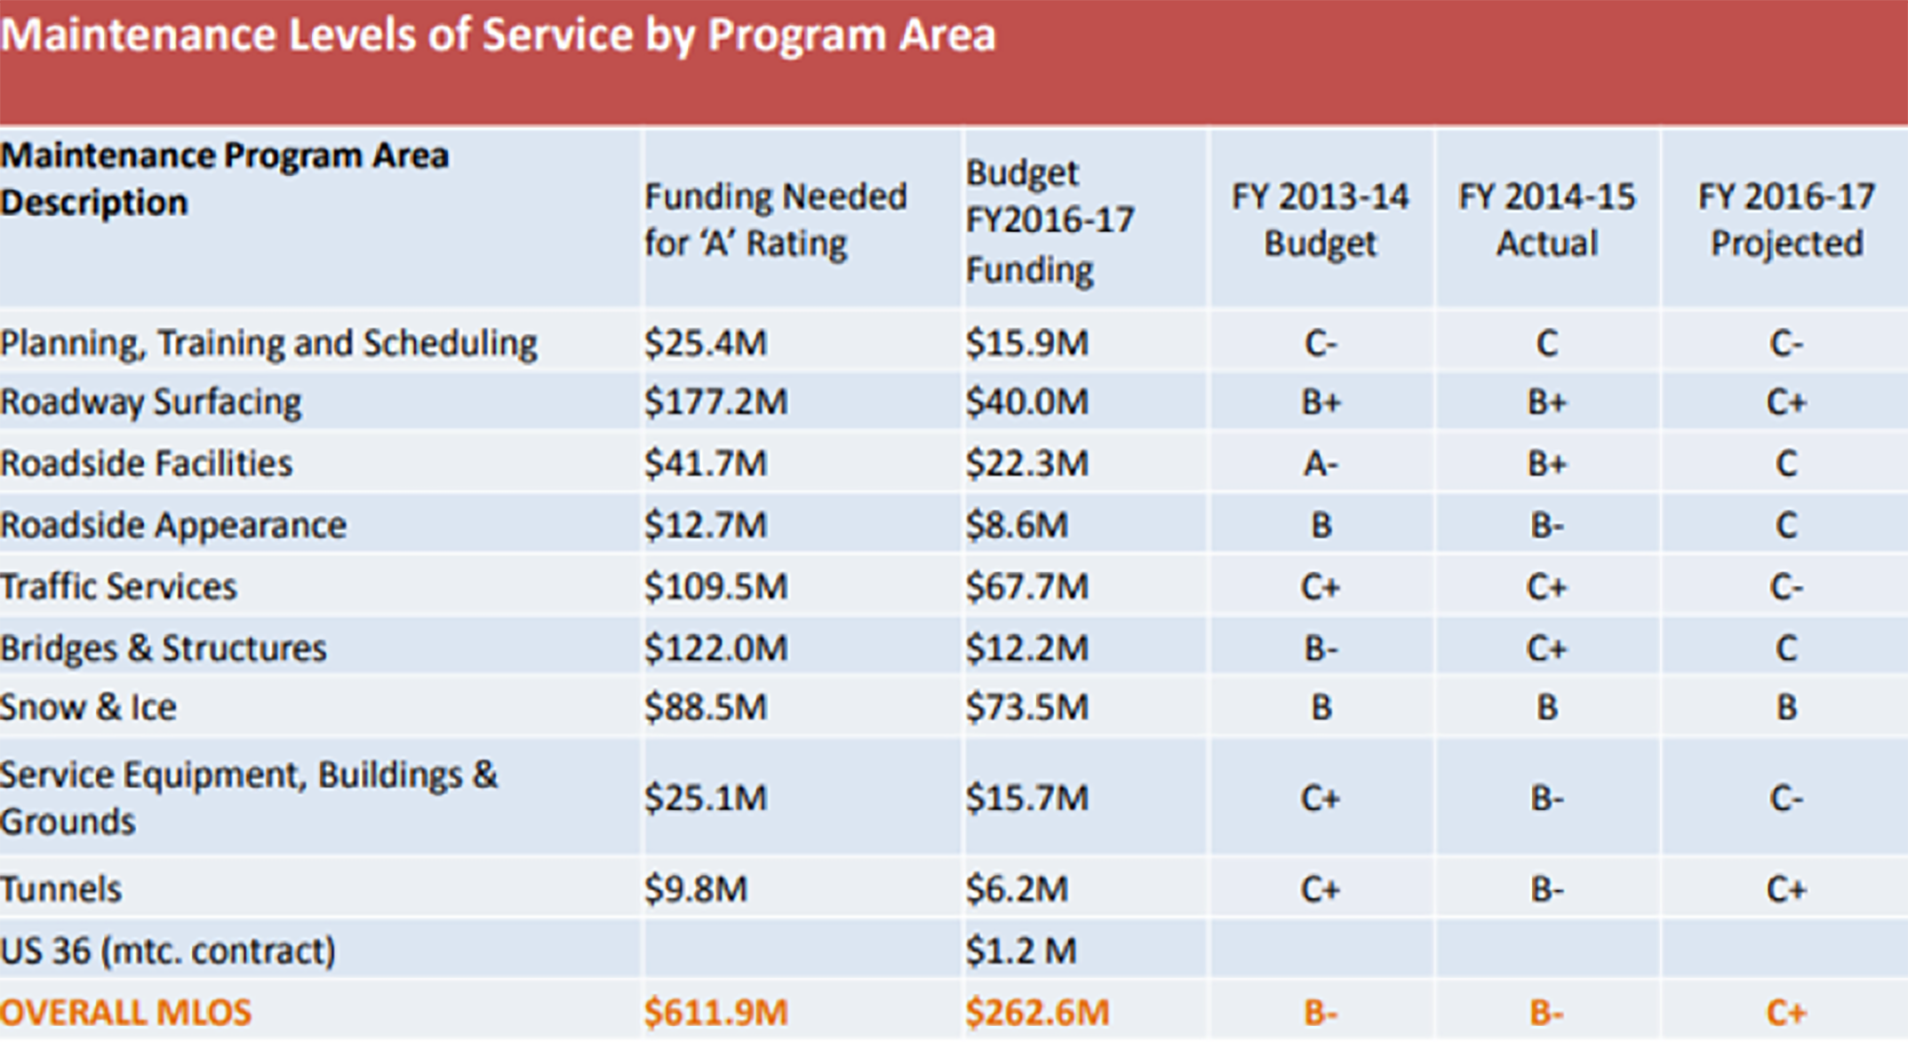
Source: Colorado DOT. 2016. https://leg.colorado.gov/sites/default/files/cdot_smart_2017_presentation.1.pdf
Washington State DOT
When seeking to establish the connection between investments and performance across a wide range of assets or roadway attributes such as litter, vegetation height, drainage, or functionality it is helpful to relate all of the various measures of performance to a common rating scale. Washington State DOT has developed its Maintenance Accountability Process to establish the relationship between maintenance level of effort and the resulting level of service. The process rates conditions and services in seven areas using a common letter-grade system, or MLOS.
- Roadway Maintenance & Operations.
- Drainage Maintenance & Slope Repair.
- Roadside and Vegetation Management.
- Bridge & Urban Tunnel Maintenance and Operations.
- Snow & Ice Control Operations.
- Traffic Control Maintenance & Operations.
- Rest Area Operations.
Each group of services or conditions includes several performance measures, which are translated to the MLOS grades of “A” (highest performance), “B”, “C” (adequate performance), “D” or “F” (unacceptable performance). Applying the MLOS grades allows for a consistent means of rating performance across services and geographic regions. Letter grades can also be represented in photographs of facilities that meet the criteria for each condition state to support communications with stakeholder groups. The MLOS are outcome-based measures that allow the agency to predict the expected level of service that can be achieved based on anticipated budget and work planning decisions. By tracking maintenance expenditures and MLOS results annually, Washington State DOT is able to adjust its maintenance priorities and budgets to address system needs and stakeholder wants.
Source: https://www.wsdot.wa.gov/Maintenance/Accountability/
New Zealand
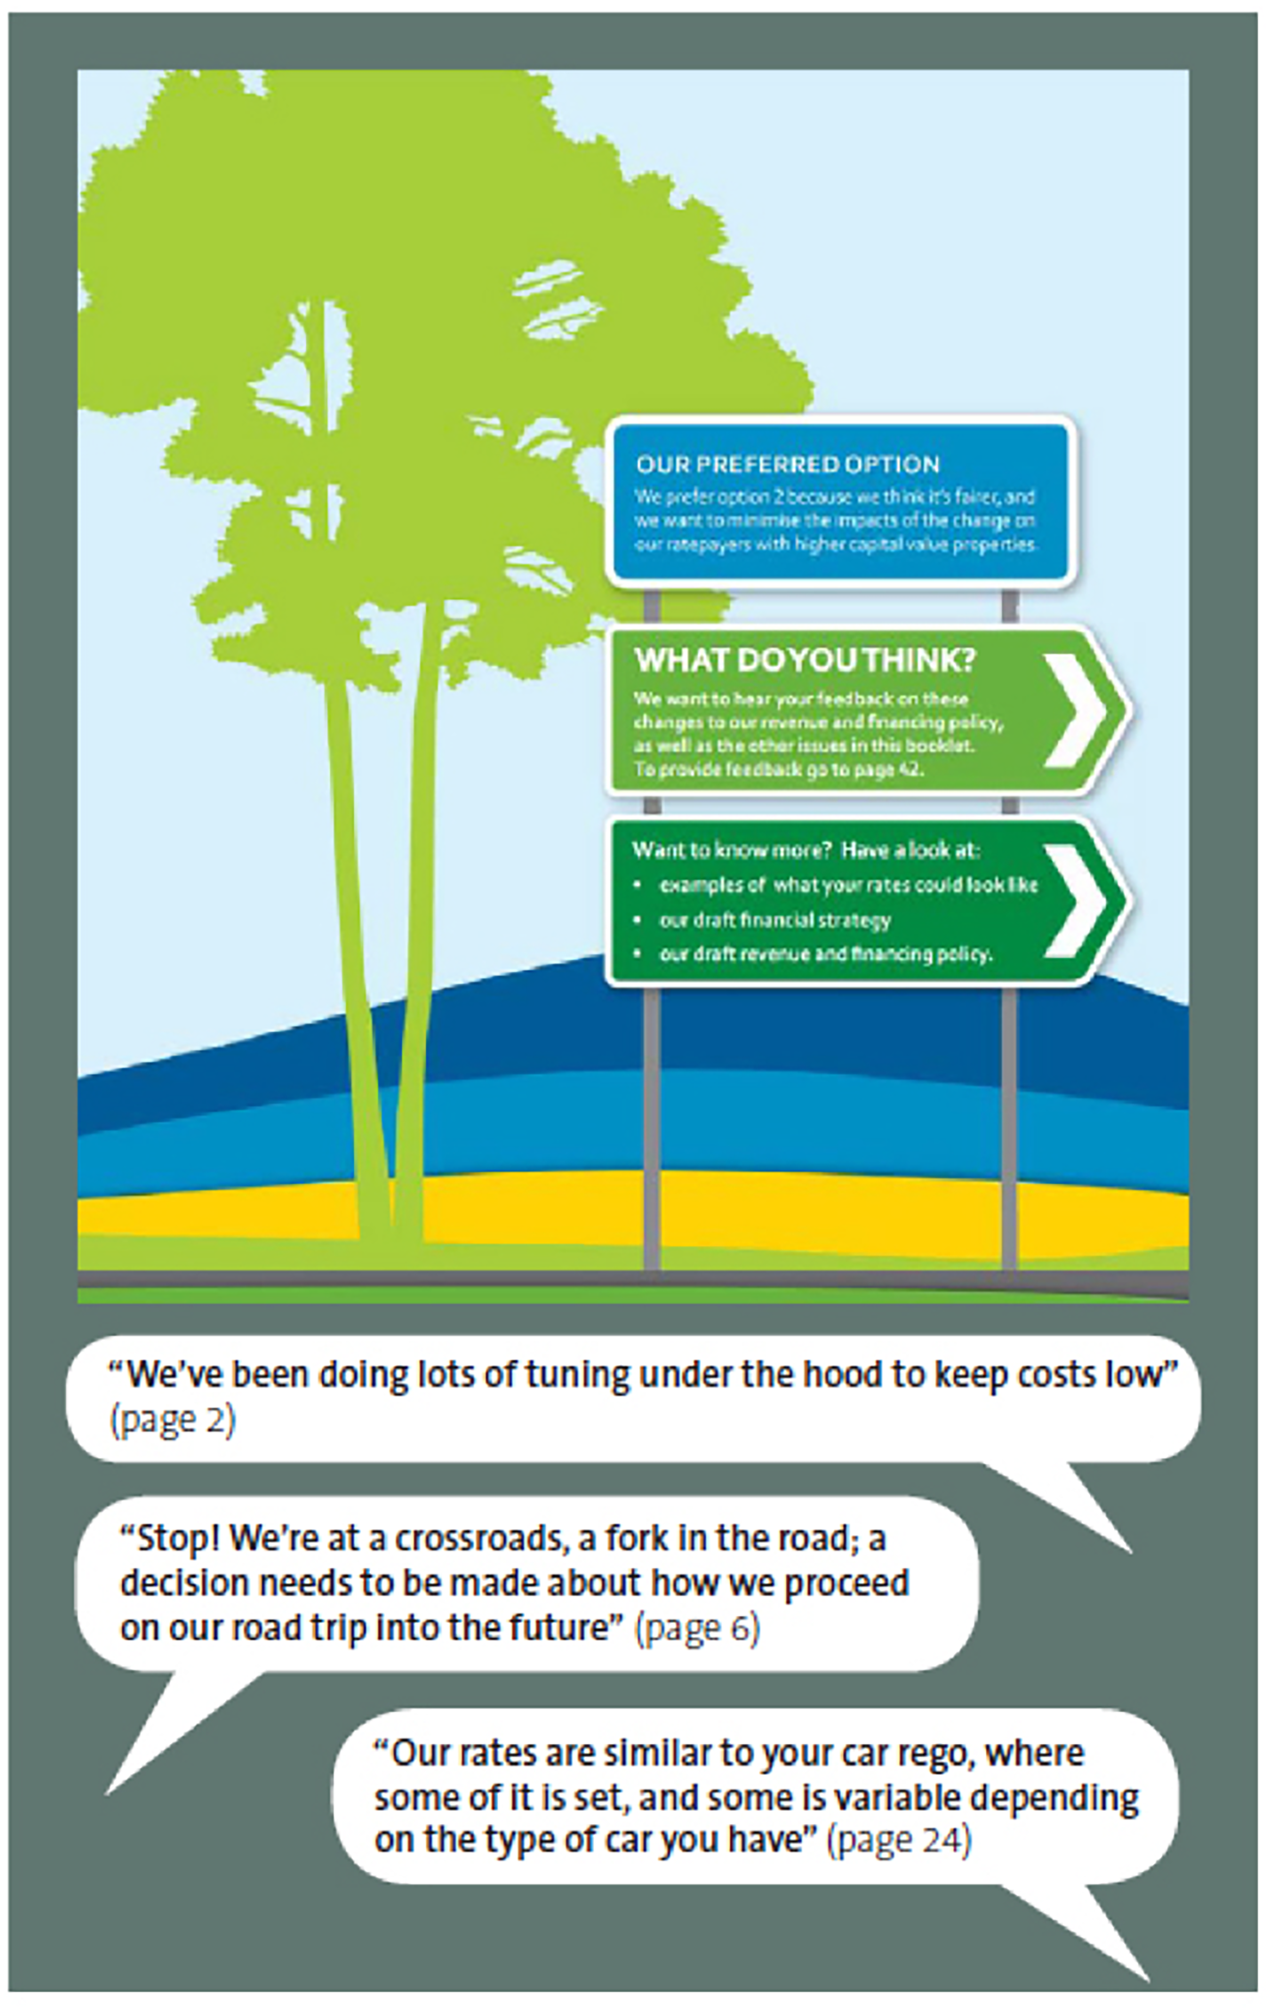
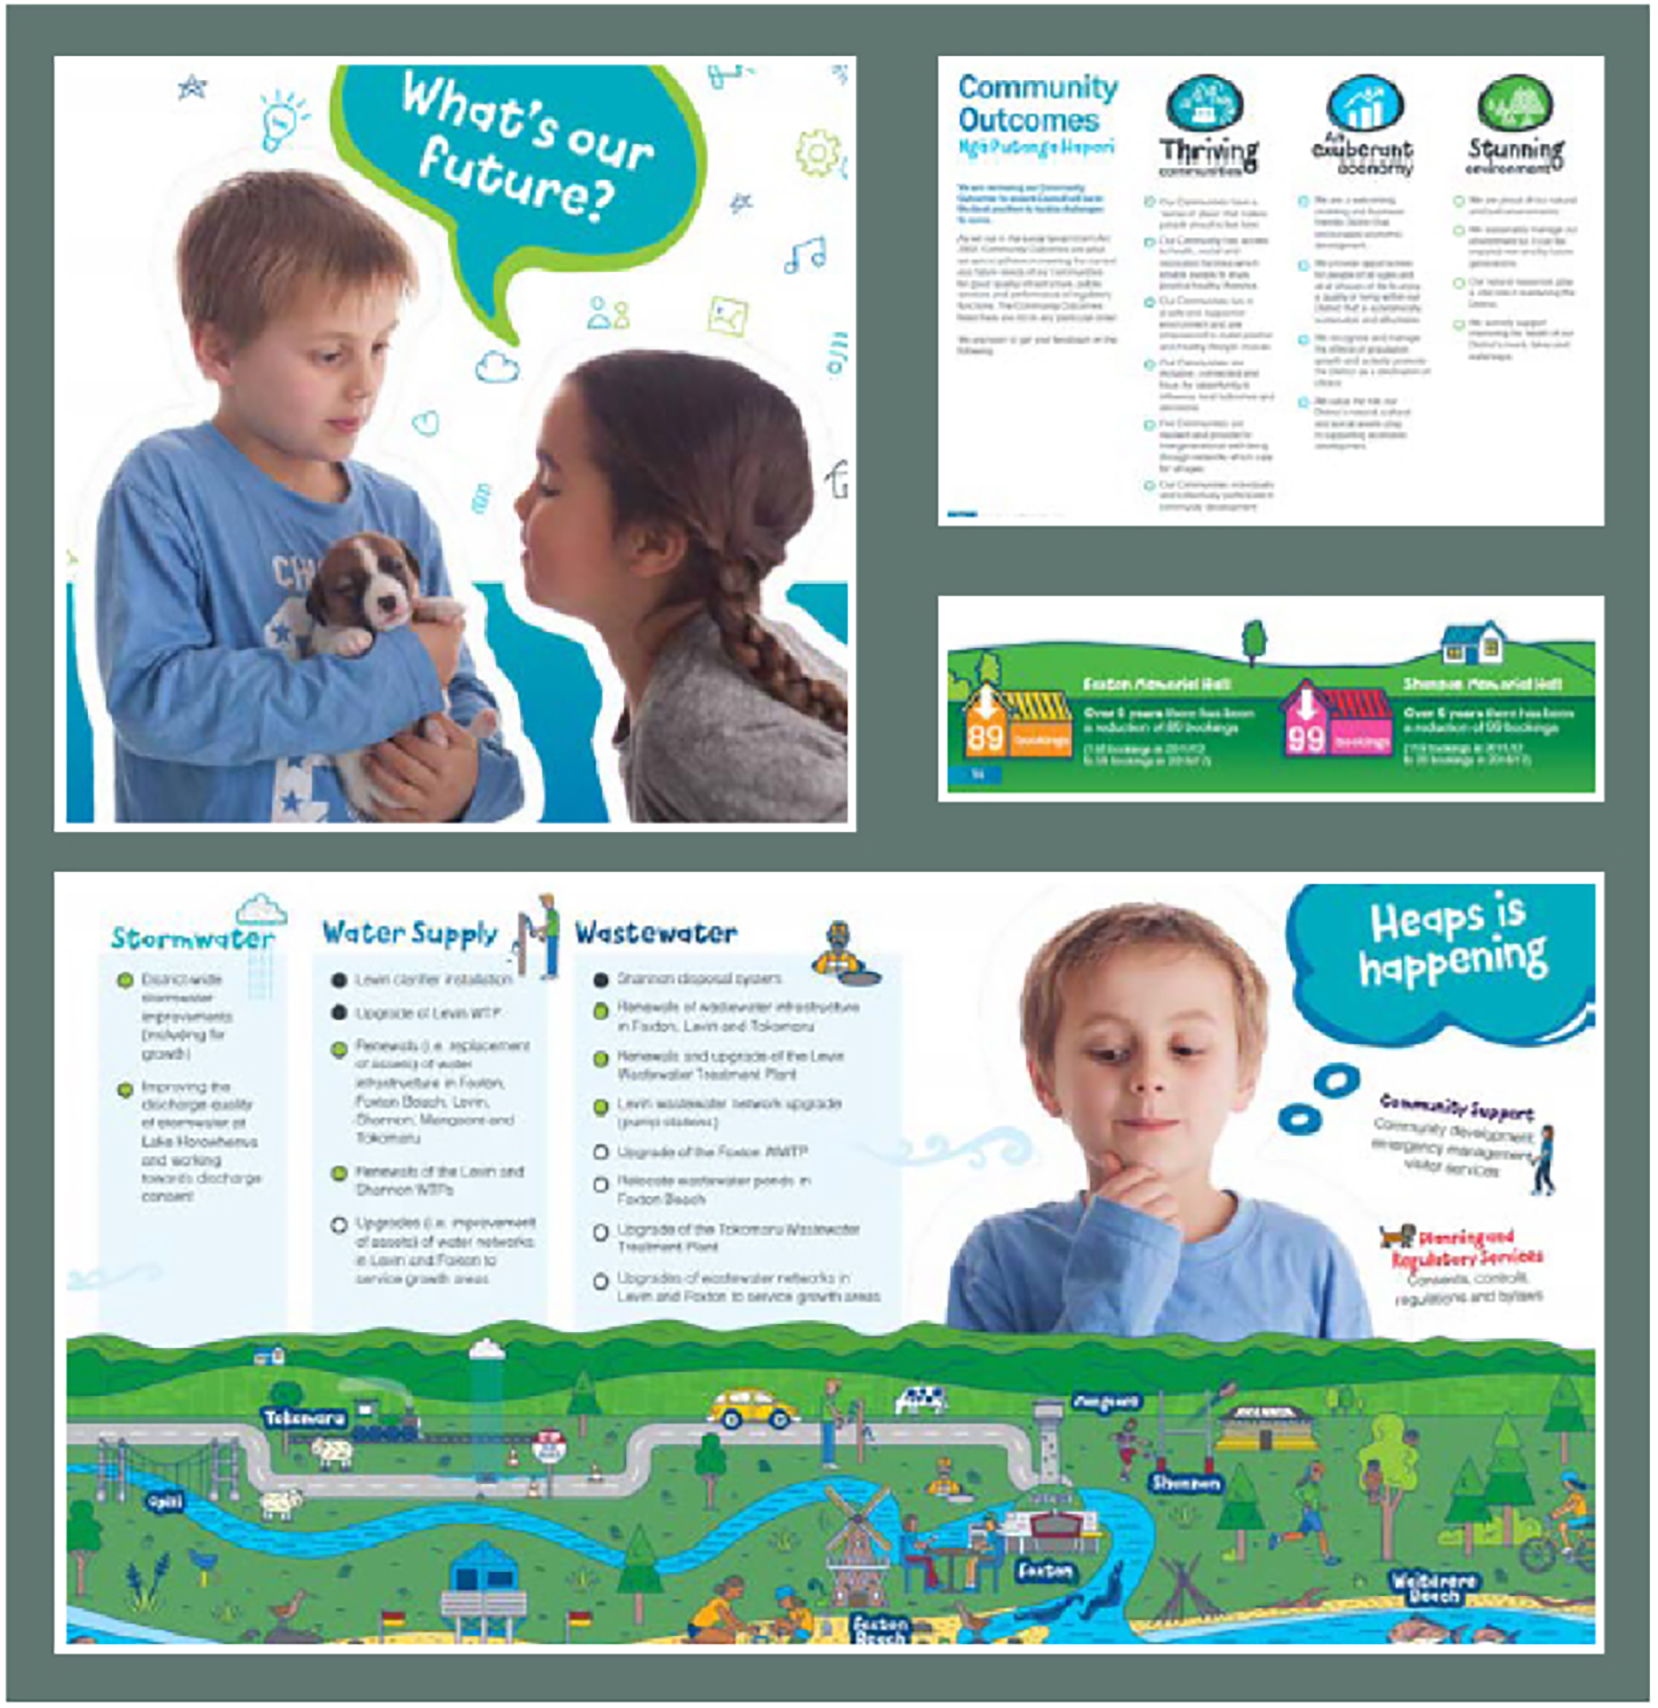
New Zealand Local Government Act legally requires councils to consult with their communities on their long-term plans. The consultation plan provides an effective basis for public participation in infrastructure decision-making associated with the long-term plan. It includes a fair representation of overall objectives, and how tax levels, debt, and levels of service might be affected by the intended plan and can be readily understood by interested or affected people. The Auditor General recently reviewed plans produced by communities across the country. Key findings highlighted aspects that help define good practice:
- Consultation documents present their information in a concise, readable and understandable way.
- Clear and unambiguous explanations on why proposed taxation and debt increases and significant changes in plans or intentions were considered “affordable” or “equitable” make consultation documents more effective.
- Some communities used a road-trip analogy throughout the document. The analogy makes technical subjects relatable without over-simplifying the issues.
- Some used a personalized approach that connected with people. For example, one uses two primary school children, Maia and Xander, who are pitched as the “champions of the Long Term Plan 2018-2038.”
By focusing on the inclusion of transportation customers, New Zealand municipalities are better able to address customer needs, inform customers of the actions they are taking, and refine work planning practices to address concerns critical to infrastructure operations and customer expectations.
Developing Life Cycle Strategies
Most transportation infrastructure assets have long service lives, lasting years or decades. Making decisions based on short-term performance without an understanding of the long-term cost effectiveness usually leads to higher future costs. Through life cycle management, agencies can develop strategies for maximizing their ability to meet both short- and long-term goals with available resources.
Adopting life cycle management can often achieve desired performance levels at lower life cycle costs than traditional strategies. Improved performance comes from analyzing the impact of various sequences of treatments on the future performance and costs of an asset class or subclass. By comparing the costs and benefits of long-term sequences of treatments, agencies can develop life-cycle strategies which provide the best practical long-term performance at lowest practical long-term costs. The implementation of life cycle strategies also enables an agency to better address its stewardship responsibilities and improve the alignment between agency investments and priorities.
By establishing sound long-term strategies, agencies can minimize the life cycle costs of preserving assets, while also managing asset performance to a defined target, the extent practicable with available resources. While strategies with a short-term outlook may provide better short-term performance, they can greatly increase the risk of higher future costs.
When developing long-term strategies, it is important to differentiate between the primary asset, with a long service life, and elements or components of that asset, that may be repaired or replaced to allow the primary asset to achieve its design life. In the case of pavements, the pavement structure may require several wearing surface replacements, either through overlay or removal and replacement of the wearing surface, to ensure the pavement structure lasts as long as intended. For assets such as bridges or signal installations structural elements or functional components may be repaired or replaced multiple times within the service life of the primary asset. In almost every case the failure to perform these maintenance and preservation actions, or failure to perform them at the appropriate time will lead to reduced service life of the primary asset.
When determining the appropriate treatment for a long-life asset, it is important to understand the root cause of the condition being prevented or corrected. Inexpensive treatments that address the visible or measured condition without addressing the cause of the distress are not cost effective. Examples of such treatments include:
- Thin overlays of asphalt pavements that are displaying structural cracking.
- Painting corroded structural steel members without proper surface preparation.
- Filling leaking bridge joints without proper materials or preparation.
While such treatments may, in some specific circumstances, be needed to provide minimal function or safety until a more substantial repair can be made, they should not be considered part of an optimal life cycle strategy.
Treatments made to achieve or extend the service life of these assets can also address changes in conditions or assumptions that have occurred since the asset was designed and constructed. Examples of these types of treatments include seismic retrofitting or applying scour protection to bridges, or increasing the hydraulic capacity of corrugated culverts by relining with smooth interiors. Each of these treatments reduces the risk of premature failure to an extreme event, and may at the same time address other structural or functional needs, without replacing the primary asset or changing its functional nature, i.e. increasing traffic-carrying capacity.
Life cycle strategies in construction and design stages
Transportation infrastructure assets are expected to provide agencies with a desired level of performance over their design lives. To ensure the desired performance is achieved, decision-makers should consider factors that impact asset service life and future costs at the time of construction. This is commonly performed as part of the project development process to select a preferred design alternative. Factors to forecast should include design criteria, constraints, standards, and risks.
- Traffic
- Environmental and climatic conditions
- Material properties
- Design standards
- Operational constraints
- Construction practices
- Climate change
- Changing customer expectations
- Regional, state and national travel pattern changes
- Advancing technology
Because these factors contribute to asset performance, deterioration and the continued functionality of the asset, they must be considered when developing life cycle strategies in early and later stages of asset life. Life cycle strategies are based on an understanding of how these factors contribute to the rates of deterioration, how well the asset will accommodate future requirements and which treatments are effective in addressing deterioration or slowing the rate at which the asset deteriorates or underperforms.
Operation, maintenance, and rehabilitation strategies
Treatment strategies consider how the asset, once constructed, will be managed to ensure it attains its design life, while maintaining the desired level of functionality. Special consideration should be given to long-life assets. There are three primary reasons short-term strategies are inefficient for long-life assets:
- As long-life assets age, deterioration accelerates, and there is greater risk of performance failing to meet current needs.
- As deterioration increases, the cost of treatments addressing deterioration tend to increase exponentially.
- Inexpensive treatments that restore condition but do not address the root cause of the deterioration will fail prematurely, leading to higher future costs.
These factors are reflected in Figure 4.5, which illustrates these concepts using a generic asset deterioration model. As shown in the figure, the average cost of treatment increases substantially as assets age. Additionally, the rate of deterioration tends to accelerate as assets age. Long-term strategies that use low-cost treatments early in an asset’s life cycle tend to improve asset condition very cost-effectively by deferring the need for most costly repairs.
Figure 4.5 Example Showing the Cost of Deferred Treatments
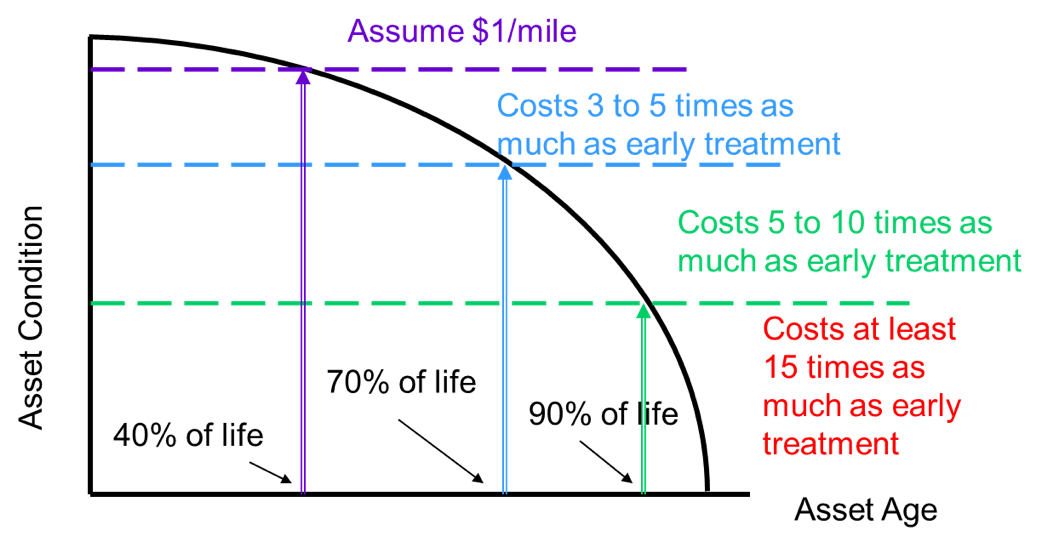
Source: Applied Pavement Technology, Inc. 2018
South Dakota DOT
To analyze the benefits of potential actions at the network level, South Dakota DOT (SDDOT) uses incremental benefit cost (IBC) analysis and deterioration models to determine the combination of feasible reconstruction, rehabilitation, and preventative maintenance treatments and timing at the network level that will give the best overall pavement and bridge conditions at the lowest practicable life cycle cost.
IBC analysis is used to answer a series of two important questions regarding pavement section treatments: Should the section be improved now, and if so, what is the best improvement to make? SDDOT’s IBC analysis process answers this set of questions by determining the combination of feasible reconstruction, rehabilitation and preventative maintenance treatments and timings that will use the anticipated state funds to yield the optimal overall asset conditions on the state highway network over a 20-year analysis period and the best long-term value to the system users (SDDOT TAMP, 2018).
Source: http://www.sddot.com/resources/reports/SDDOT2018TAMPFHWASubmittal.pdf
Considering Transformational Changes in Life Cycle Management
Life cycle management requires an understanding of past performance to predict future performance and plan appropriate actions. However, as technology advances and society’s needs change, the inputs and objectives of life cycle management need to adapt. Technology can lead to new materials or techniques that allow agencies to get longer life from existing assets. However, technology can also lead to broader societal changes that may make the need for some assets obsolete. Similarly changes in standards and regulations, may make it necessary to replace or update some assets prior to the planned ends of their service lives. Asset managers should regularly review their assumptions about anticipated asset service lives, consider new treatment options, and adjust to technological and regulatory trends and adjust the life cycle approach accordingly. Much of the information to support this effort can be found in agency’s long-term planning documents, as discussed in Chapter 2.
Incorporating Resilience in Life Cycle Strategies
Environmental changes such as extreme weather, temperature rise, sea level change, and changes in other environmental conditions can threaten transportation infrastructure. Even when these changes don’t increase the risk of failure, they can require infrastructure owners to change their strategies for managing assets. This is particularly important for long-life infrastructure assets such as bridges, pavement, culverts, and geotechnical assets.
Resilience is the term used to describe an asset’s ability to withstand environmental changes. Resilience can be considered at all stages of an asset’s life and should be an integral aspect of any life-cycle strategy.
FHWA developed the Adaptation Decision-Making Assessment Process (ADAP) as a tool for planners and designers to address resilience in the design of infrastructure projects. While ADAP was developed to be used on a project-by-project basis, it can also be applied to the development of a lifecycle strategy. Figure 4.6 shows the 11 step ADAP process. The key difference between applying the ADAP process to developing a life-cycle strategy, as compared to a project, is in step 1. Understand the site context. When applied to a project this step is focused on a specific physical location, bounded by the project limits. When applied to developing a life-cycle strategy, the site context will likely be broader to an area that is expected to be subject to a given environmental change, such as increasing seasonal temperatures, or sea level rise. Once the proper context is established, the process steps can be followed to evaluate potential strategic adjustments that will allow life cycle management practices to account for the anticipated effects of the environmental change.
Figure 4.6 Decision Tree of the ADAP Steps
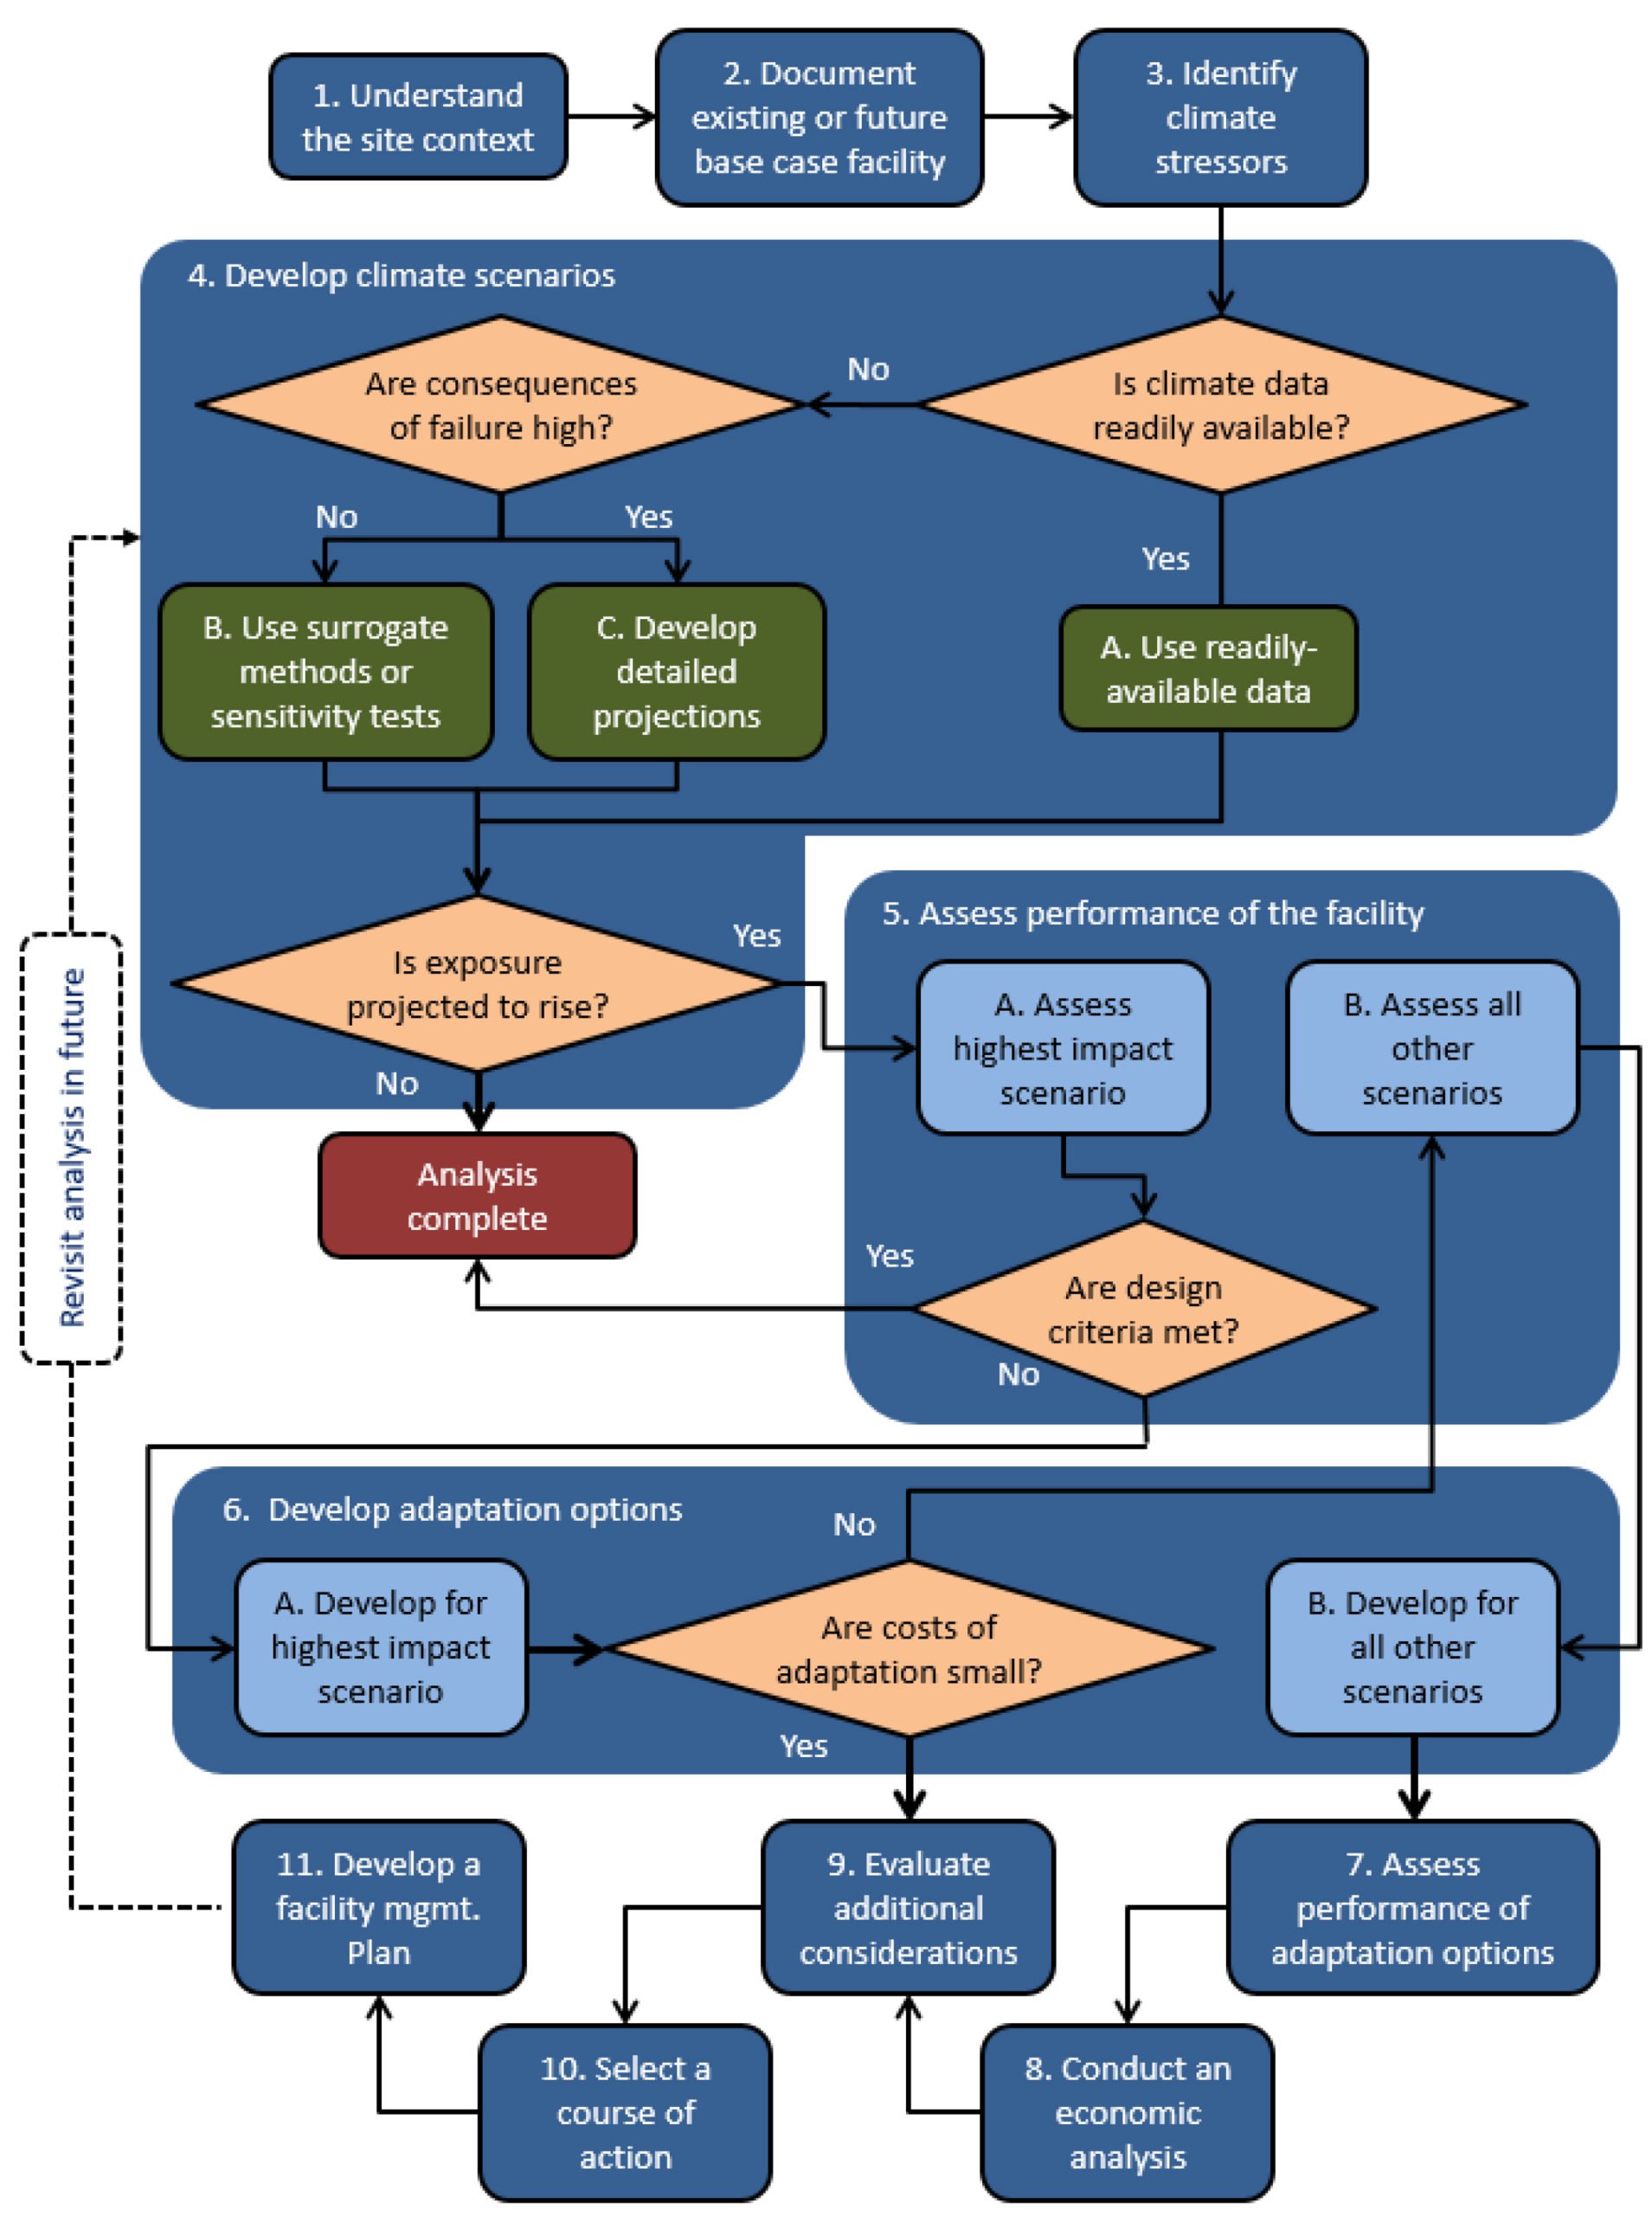
Source: FHWA. 2016. TEACR Engineering Assessment. Adaptation Decision-Making Assessment Process (ADAP). FHWA-HEP-17-004
New York State DOT
In 1994, New York State DOT (NYSDOT) determined that it needed to modernize its bridge designs to have longer service lives to help reduce future rehabilitation and replacement costs. Prior to this effort, the agency designed bridge decks for a 50-year service life with a planned rehabilitation at year 35. The goal for this effort was to double the bridge deck design life to 100 years with a planned rehabilitation at year 75. The NYSDOT Materials Bureau investigated the major causes of bridge deck deterioration and determined that the primary cause of failure was corrosion of the reinforcing steel due the intrusion of chlorides from winter maintenance activities. Upon further investigation, it was determined that the chlorides were penetrating the bridge decks both through cracks and the natural porosity of the concrete. As a result of this research, the agency began a research and development effort to design a new standard concrete mix design that had lower permeability, higher resistance to cracking, and was pumpable to support standard bridge deck construction practices.
The result of the Materials Bureau’s effort became NYSDOT’s “Class HP” concrete, which utilizes fly ash (a byproduct of electric power production) and micro silica (a byproduct of electric arc furnaces used in manufacturing) to replace some of the Portland cement in its standard bridge deck concrete. These new materials are finer in size than cement particles, resulting in well graded denser packing of particles in the concrete, which reduces permeability. Class HP also creates less heat while it cures (or hardens), which reduces the occurrence of thermal shrinkage cracks when the deck cools. In 1997, Class HP became NYSDOT’s standard concrete mix for bridge decks. By using a failure mode analysis to identify the primary causes for bridge deck deterioration, NYSDOT could use new materials technology to address those causes and significantly lengthen the design life of its bridge decks.
Maine DOT
Maine is a cold-weather state with soils that are susceptible to severe frost conditions during winter months. In cooperation with FWHA and its Transportation Engineering Approaches to Climate Resiliency (TEACR) effort, Maine DOT undertook a project to assess the impacts of changing climate on the performance of pavements and develop strategies to offset those changes. The study looked at anticipated changes in both temperature and precipitation over the course of the 21st century. The study followed the ADAP process as shown in figure 4.6. The study indicated that anticipated climatic changes will lead to moderate changes in pavement performance. The study identified both engineering and operational adjustments Maine DOT can adopt to address these changes. The full report can be found on FHWA’s website at: https://www.fhwa.dot.gov/environment/sustainability/resilience/ongoing_and_current_research/teacr/me_freeze_thaw/
Life Cycle Management Approaches
Different types of assets require different management approaches to operate effectively and provide the expected level of service. This section introduces common management approaches used by transportation agencies to appropriately manage asset service life at both a network and asset level.
Virtually all transportation infrastructure assets are designed to have long service lives, lasting years or even decades. This means life cycle management must include long-term predictions that come with inherent uncertainty. Further complicating matters, the condition or performance of some assets may be difficult, expensive, or impossible to discern. This is most common with geotechnical assets or hidden elements on complex structures. Addressing this uncertainty requires integration with the agency’s risk management practices, and consultation with technical experts, such as hydraulics and geotechnical engineers. Risk management practices are discussed in more detail in Chapter 5. This section highlights how uncertainty should be considered when selecting a management strategy to maximize service life and address risk.
Condition-Based Management
A condition-based management approach is the life cycle management approach that is the most commonly associated with asset management at U.S. transportation agencies. In condition-based management the condition of an asset is measured, and used to forecast and identify the onset of failure. Maintenance and preservation activities are identified to address the failure and restore or extend service life. While the objective of asset management is to support the reliable performance of the asset, the performance measures most commonly used for physical assets are condition-based. Agencies that are very advanced in their asset management practices may be able to apply the condition-based management approach to other aspects of asset performance.
Condition-based management relies on the collection and analysis of asset condition and defect data. This data is then used to understand the current state of individual assets and when aggregated is used to predict the future condition state of similar asset types. When linked with intervention data and condition threshold information, the future impact of potential actions can be assessed, all with the view of optimizing an asset’s service life cost-effectively. Accordingly, a condition-based management approach combines condition monitoring with performance predictions and knowledge of preventive or restorative actions, to establish a cost-effective life cycle plan. The condition-based management approach can be applied to simple and complex assets, groups of single assets or a whole network. In a network perspective, components could be individual assets such as pavement segments and bridges and at a project level, components could be elements of individual assets.
Indiana DOT
Overhead sign structures are critical to safe and effective highway performance since they support signs, cameras, sensors and other equipment in support of routine and emergency operations. These structures typically have long service lives, but failure risk exists if they are not maintained. Indiana DOT found that failure to their overhead sign structures could be effectively mitigated through routine, real time condition monitoring and condition forecasting for predicting failure. Therefore, the Indiana DOT uses a condition-based approach for maintaining its overhead sign structures.
Indiana DOT’s condition-based maintenance approach involves the steps listed below to ensure the overhead sign is installed corrected, material specifications are met, and the connection to the ground is secure:
- Professional engineers perform inspections
- An asset inspection report is developed
- The asset inspection reports are submitted to the districts
- The districts review the reports and prioritize work activities
- Work orders are developed to address the highest-priority needs
- In-house crews or local contractors perform the work
As a result of the DOT’s condition-based maintenance approach, the department realized an increase in the amount of collaboration between districts and an improvement in how overhead sign structure repairs and replacements are monitored and prioritized.
Source: FHWA (2019). Handbook for Including Ancillary Asses in Transportation Asset Management Programs (pending publication in 2019).
Interval-Based Management (Age Based)
Interval-based Management is most commonly applied to operations assets (striping, signs, guardrail), where just an inventory is maintained. Condition assessments may not be financially feasible or practical. Additionally, these assets are often related to compliance, meaning their condition state either meets a specific standard, or does not. With interval-based management, asset performance data or manufacturer’s suggested life estimates are used to establish a time interval representative of the service life beyond which the cost of asset failure outweighs the cost of replacement. The service life being the average life that all assets or components of a type are expected to last. Cyclically applied interventions can also be classed as interval-based management strategies, as there is a fixed period between a set of predefined actions that have to be taken. An interval-based approach is most commonly applied to manufactured assets with highly uniform performance levels. It is less applicable to assets constructed on site or long-lived complex assets where there is a greater level of uncertainty surrounding the expected life of the asset. Examples of the types of assets that are often maintained on an interval-based approach are signals, ITS equipment, and other mechanical and electrical related items.
Reactive Management
Reactive management unlike condition or interval maintenance does not use forecasting to understand the likely timing of an intervention. Accordingly, reactive management excludes all or most actions to address asset condition or performance, until the asset reaches an unacceptable condition state. The condition state may be influenced by accumulated deterioration or a specific event, like a crash or intense storm. Reactive-management is commonly applied to low-value or less critical assets, redundant assets, or assets for which failure represents an acceptable risk. To create a reactive-based management strategy, minimum acceptable condition thresholds must be defined. Reactive management strategies often require an agency to have a mechanism to deliver required work within a specified time frame, to avoid unacceptable levels of risk. This may include properly staffed and equipped in-house maintenance forces or “stand-by” contracts, so work can be dispatched and delivered quickly. Examples of assets managed using a reactive-based approach include fences, brush, lighting, raised pavement markers, impact attenuators, and rockfall.
Selecting the Right Management Approach
The selection of a management approach considers the mechanisms that lead assets to fail to provide their required or desired service, the consequences of failure, available intervention options and related costs.
Factors for Comparing Life Cycle Management Approaches
Failing to achieve a service level target requires an intervention, or reassessment of the reasonableness of the target. If improvement is required, selecting a management strategy is a function of where performance is insufficient. Safety improvements can reduce crash rates, additional lane capacity can improve travel time reliability, operational enhancements can improve emergency response rates and road availability during inclement weather. Where condition is below target, at a network or corridor level, interventions may be required in multiple areas.
Selecting interventions to achieve condition targets for an asset class or subclass is a data-driven, risk-based process. It evaluates what circumstances lead to asset failure, the subsequent consequences of failure, the options available to avoid failure and their costs. Costs should include the cost to monitor/analyze/ manage an asset in addition to the cost to repair. Based on an understanding of these factors, an agency can determine what strategy will be the most appropriate. The three management strategies introduced in the previous section are incorporated into Table 4.2 along with summaries of the various factors used to compare the approaches.
Table 4.2 - Comparison of Management Strategy Approaches.
Adapted from SAE International 2009
| Management Approach | Condition-Based | Interval-Based | Reactive-Based |
|---|---|---|---|
| Decision Making (intervention) Approach | Selects intervention based on a forecasted condition exceedance interval. | Asset is treated based on a time or usage basis whether it needs it or not. | Treatment is performed to fix a problem after it has occurred. |
| Data Needs | Inventory information (Asset / Component) Historical condition and expert data – deterioration curves Current condition and defect data Historical Intervention and cost data – intervention strategies. Asset / component type and material data Intervention thresholds for condition | Inventory information (Asset / Component) Asset / component age Remaining useful life of asset / component Timing and type of last action Interrelationships of different interventions, and how they affect the selection and timing of downstream actions | Inventory information (Asset / Component) Current Condition data Intervention thresholds for condition Historical cost data |
| Life Cycle Planning Expectations | Require the ability to understand the effects of different funding strategies. Wish to forecast the future condition state of the network or specific asset classes. Wish to minimize the life cycle cost. | Wish to gain an understanding of the typical average cost to manage the network or specific asset classes | General costs estimates based on experience. Limited need to actively manage the asset. |
| Considerations | Cost of collecting and analyzing condition information and developing forecasting models. | Diminished cost effectiveness / efficiency compared to condition modeling. Does not support knowledge development of asset behavior (inhibiting the move to more cost-effective regimes). | Often considered immature but is appropriate for assets if only minor consequences occur from a service disruption. |
| Typical Usage Cases | High risk / criticality assets or risk must be more actively managed. Large portfolios or high value assets of similar construction forms Scenario planning is required Long-lived assets that can have numerous management approaches applied to them. More advanced asset management planning is required Cost uncertainty over time must be assessed (stochastic modeling) | Moderate or low risk assets. Mandated manufactures management regimes or Short-lived assets Buried assets where condition data is hard to obtain. Assets where the cost to collect condition data is expensive relative to the maintenance activity that is required | Low risk or criticality assets. Assets where the effects of accumulated defects are not critical to their functionality. Assets that are likely to be subject to unforeseen events or impairment e.g. barriers or light poles. |
Reliability Centered Maintenance
Several of the principles described in this section are based on a Reliability Centered Maintenance (RCM) approach, a technique that is sometimes used by an agency to identify the most appropriate management method. Looking at an asset or asset class from an RCM perspective helps to select a management approach based on safety, operational and economic criteria. RCM is commonly applied to complicated assets that may require a range of management approaches for different components of the asset.
The RCM process has its roots in the aviation industry related to the mechanical components of aircrafts, but has been adopted across multiple industries for mechanical, electrical and infrastructure assets. Within the highways industry RCM has been considered for ITS assets. More information on the use of RCM for ITS assets has been published by Austroads (2016): Reliability-centered Maintenance Strategy and Framework for Management of Intelligent Transport System Assets.
RCM considers seven fundamental questions to select the most appropriate management approach for a set or type of assets (SAE International 2009). These questions can be applied to the selection of life cycle management approach. Based on the responses to these questions, an agency can determine what maintenance approach, for which parts of the asset, will maximize the likelihood of an asset performing its desired function for the lowest practicable cost. These questions are as follows:
- What is the item supposed to do and what are its associated performance standards?
- In what way can the asset fail to provide the required functions?
- What are the events that cause each failure?
- What happens when each failure occurs?
- In what way does each failure matter?
- What systematic task can be performed proactively to prevent or diminish to a satisfactory degree the consequences of the failure?
- What must be done if a suitable preventive task cannot be found?
RCM can be presented in a decision tree to aid agencies in selecting the best management approach. Agencies can also customize the questions and decision tree to meet their specific need. Figure 4.7 represents a portion of a decision tree customized to select the appropriate management approach for ancillary highway assets. By applying these questions to an asset class, an agency can prioritize asset classes for monitoring and active management. An agency can also determine which assets present limited risks to system performance and can be managed through less expensive means.
Figure 4.7 Maintenance Approach Decision Tree
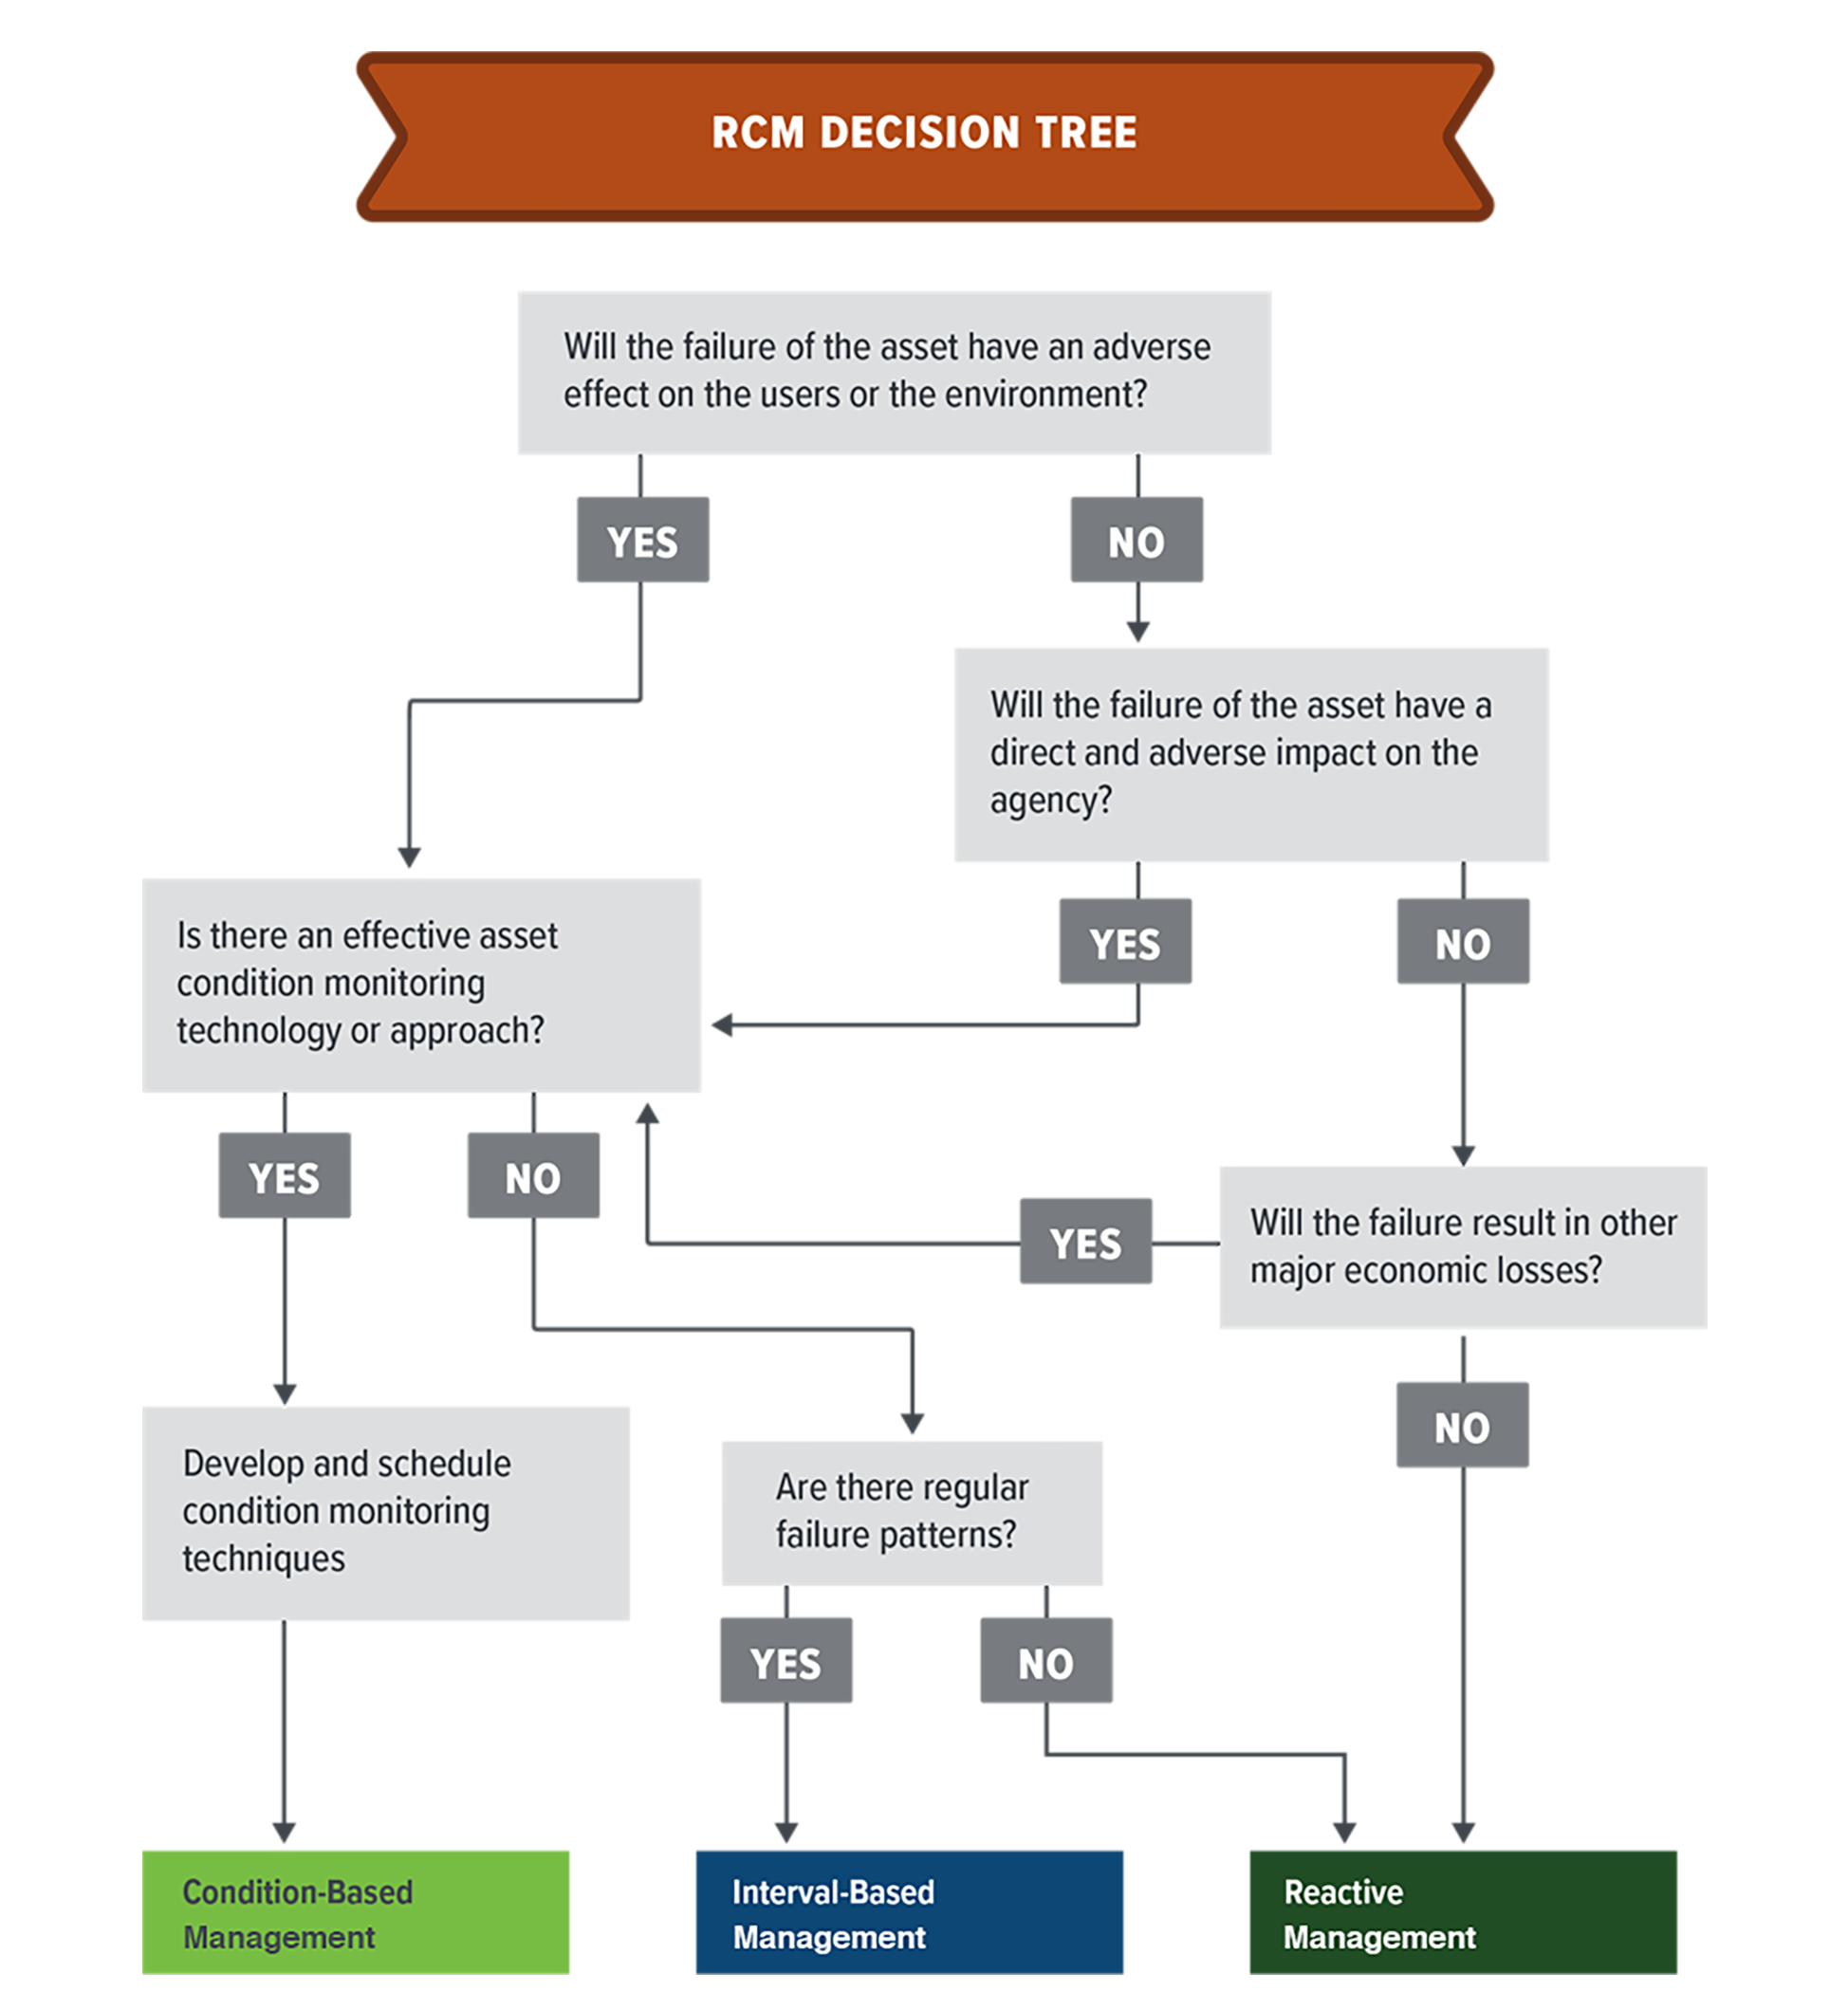
Source: FHWA. Expected 2019. Prioritizing Assets for Inclusion in Transportation Asset Management (TAM) Programs.
Managing Assets Using Condition Based Management
The condition-based management is the most complex of the approaches introduced in Section 4.2 and requires a commitment to the collection of reliable inventory and condition information over an extended period and the of condition models to predict future deterioration to evaluate the type and timing of various treatment actions in terms of risk and performance.
Using Computerized Management Systems to Optimize Life Cycle Management
For condition-based analysis, computerized management systems are valuable tools for evaluating life cycle strategies. Computerized systems support the larger life cycle management process by providing relevant, reliable information and analysis results to decision makers at the right time.
Condition-based management is common for pavement and bridge assets. Often pavement and bridge decision making is supported by a computerized system that is used to support optimized life cycle management. The results from this analysis provide insights into optimal life cycle strategies for all network assets or for a specific group of assets. These models can be configured to include the effects, maintenance, preservation, rehabilitation, and reconstruction actions. Depending on the type of condition-based modeling approach, uncertainty can also be included.
Various life cycle scenarios can be generated by modifying one or more variables in the analysis. By running multiple network-level scenarios and comparing the results, pavement and bridge management systems can identify viable life cycle strategies and help an agency select the strategy that best achieves the stated objectives.
More information on the use of pavement and bridge management systems is available in the FHWA document, Using a Life Cycle Planning Process to Support Asset Management: A Handbook on Putting the Federal Guidance into Practice. Life cycle planning is a required component of risk-based TAMPs developed by state DOTs (23 CFR 515), that uses computerized asset management systems to establish long-term life cycle strategies for pavements, bridges and other highway assets. NCHRP Report 866, Return on Investment in Transportation Asset Management Systems and Practices, provides an assessment of how state DOTs have implemented asset management systems, including practice examples. The end of this section includes a how-to guide for using a pavement management system for life cycle planning, a requirement for risk-based TAMPs developed by state DOT’s for pavements and bridges on the National Highway System (23 CFR 515).
These computerized systems are designed to develop network-level scenarios for analyzing the impacts of different program variables over long periods of time. Typical pavement management scenarios will cover 10 to 40 years, while bridge management scenarios may need to cover 100 years or more to ensure inclusion of multiple life cycles within the scenario.
Various life cycle scenarios can be generated by modifying one or more variables in the analysis. By running multiple network-level scenarios and comparing results, pavement and bridge management systems can identify viable life cycle strategies and help an agency select a strategy that best achieves the stated objectives.
Ohio DOT
As required under MAP-21, Ohio DOT conducted a risk assessment to identify the most significant threats and opportunities to its pavements and bridges. The analysis revealed that anticipated flat revenues, combined with the annual increases in cost to pave roads and replace bridges, would lead to significant reduction in conditions without changes to existing practice. The potential deterioration in pavement and bridge conditions were expected to significantly increase future investment needs due to the increase in substantial repairs that would be required.
Following the risk assessment, a life cycle analysis was conducted. The analysis found that by focusing on the increased use of chip seals and other preventive maintenance treatments on portions of the pavement network, the annual cost of maintaining the network could be reduced. A life cycle analysis for bridges showed similar results. The bridge analysis found that with just 5 percent of the NHS bridges receiving a preservation treatment annually, the DOT could reallocate $50 million each year to other priorities. The investment strategies outlined in the TAMP and the changes made to the DOT’s existing business processes enabled the agency to offset the potential negative impact of the anticipated flattened revenue projections.
The differences in the adopted life cycle strategies are compared to the past strategies in the Figure. Although the total number of treatments applied over the analysis period increases, the annual life cycle cost decreases because of the reduction in the number of rehabilitation strategies needed.
Ohio DOT’s Pavement Preservation Strategy Comparisons
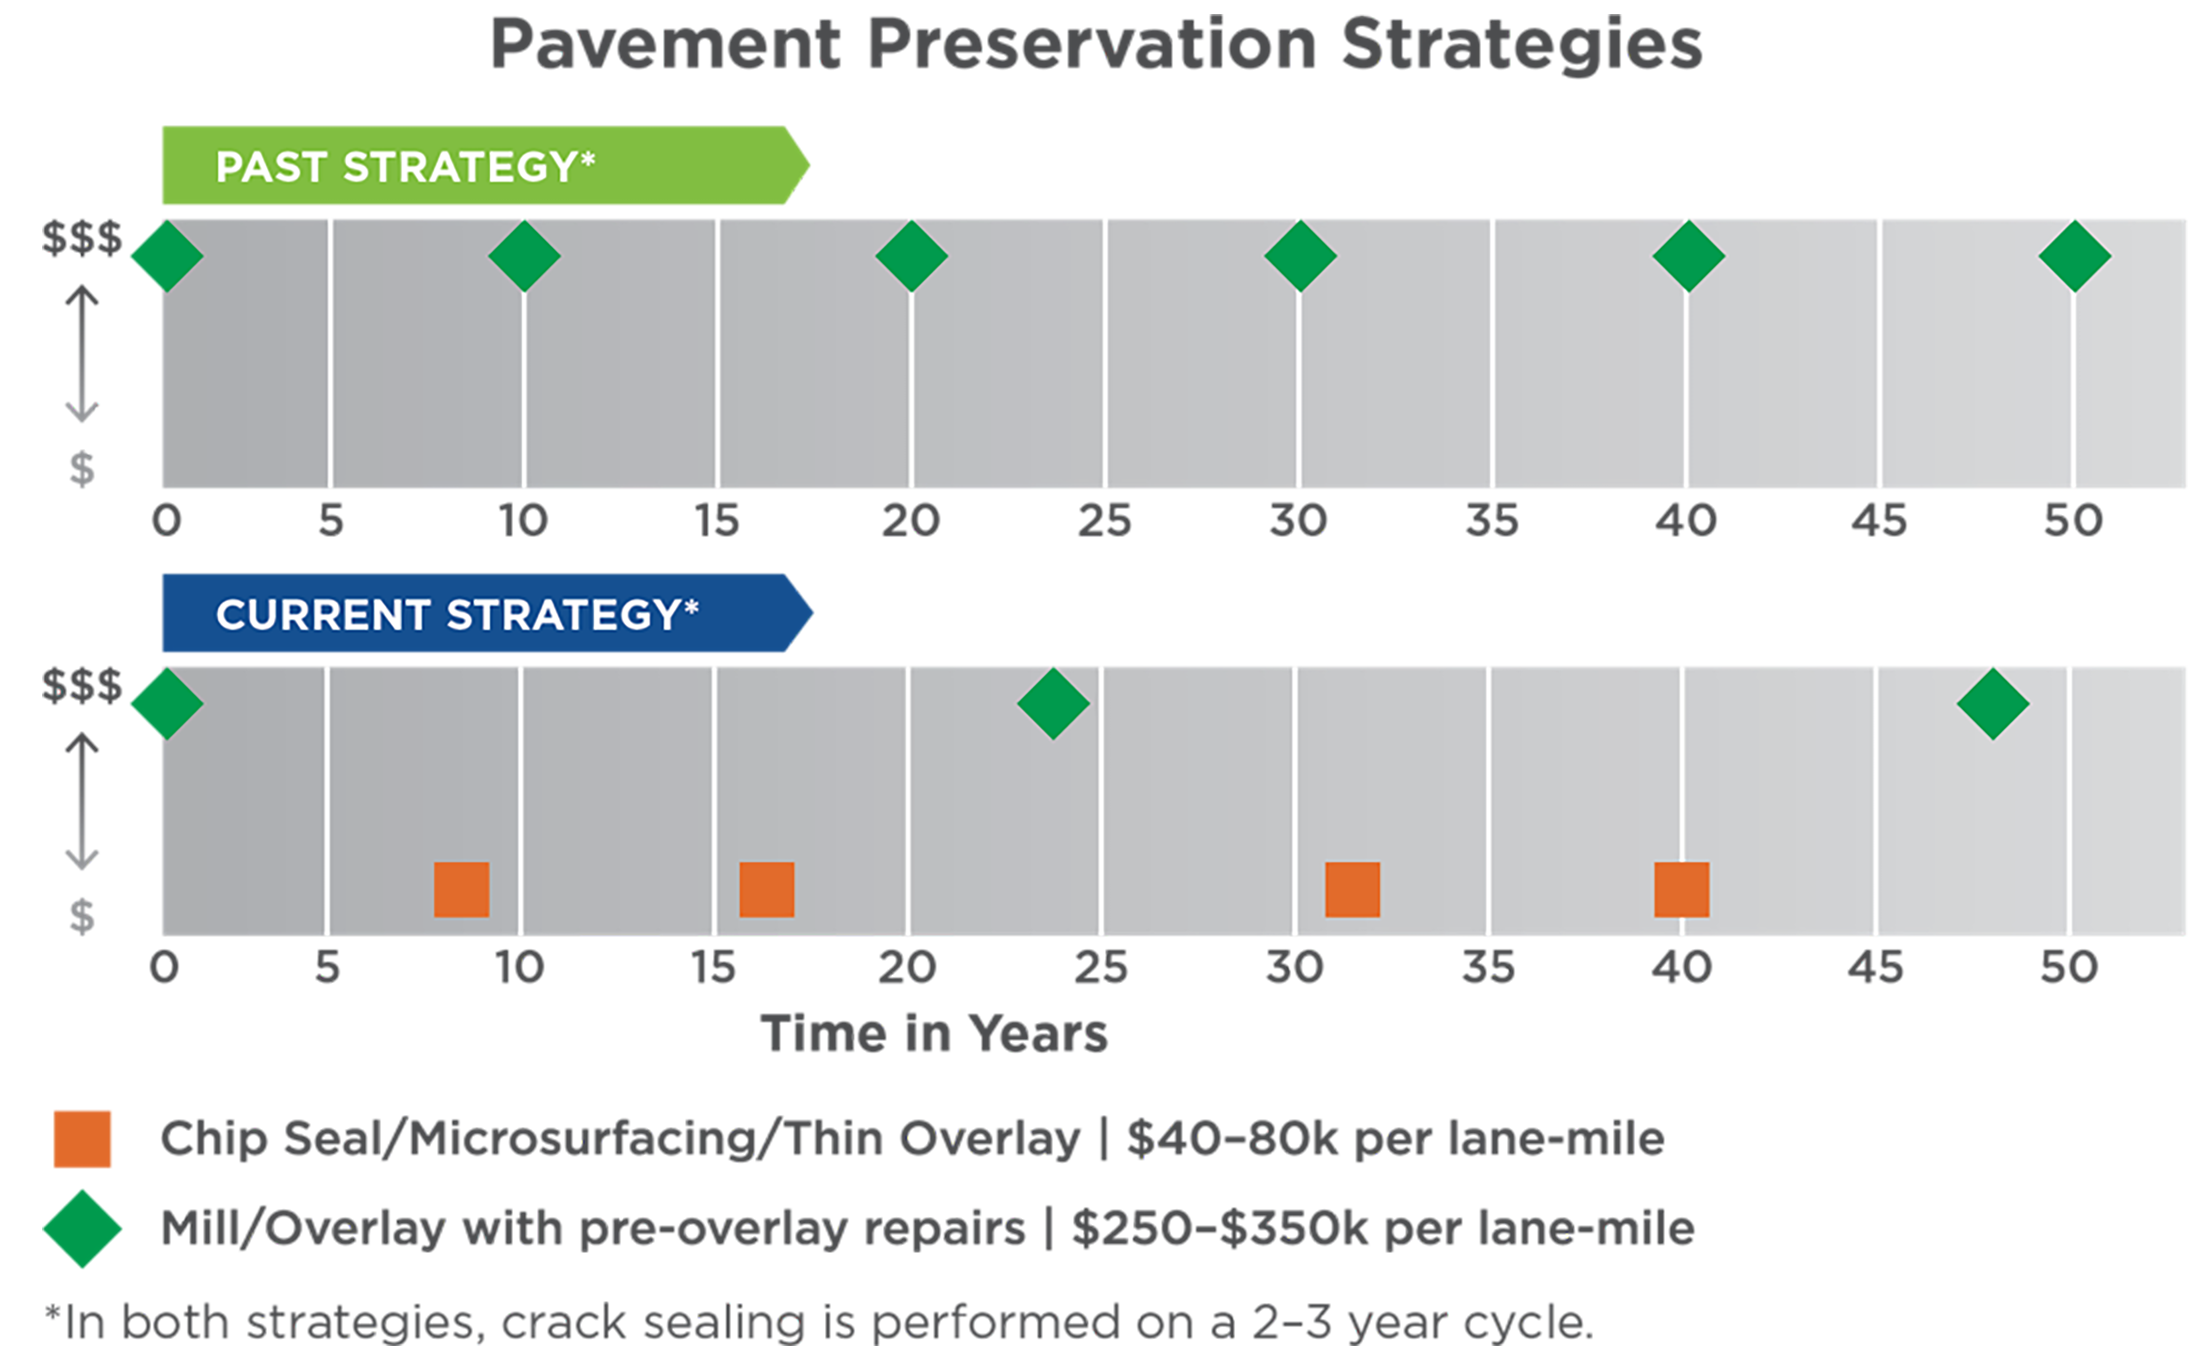
Source: Ohio DOT Transportation Asset Management Plan. 2018. http://www.dot.state.oh.us/AssetManagement/Documents/ODOT_TAMP.pdf
Predicting Asset Performance
A life cycle strategy is enhanced by the availability of models and analysis tools that facilitate the evaluation of different combinations of treatment type and timing across the asset class. For this analysis a model that predicts future asset deterioration and response to treatments is required.
For condition-based approaches to managing assets, historical performance is typically used as a baseline for developing models to predict future performance. The predicted conditions are used to determine the type of treatments that may be needed over an asset’s service life, so the ability to accurately predict asset conditions in the future, with and without treatment, is an essential component of asset management. Models are developed by comparing performance, typically measured as asset condition, over time with actions or treatments performed on specific assets. This means that performance is associated to the last action or treatment that impacted performance in a positive way. However, assets may also receive treatments that delay the onset or advancement of distress. As a result, most models assume assets receive some level of preventive or routine maintenance between more significant treatments. If agency practices change to delay or cease maintenance activities, assets may not perform as models predict.
Several methods can be used to estimate future asset performance, the two most
common of which, deterministic and probabilistic, are described below. Additional information has been published by NCHRP (Report 713, 2012): Estimating Life Expectancies of Highway Assets. This report also contains guidance on selecting the most appropriate modeling approach for various highway asset classes.
Deterministic Modeling
Deterministic modeling is a common and relatively simple approach for using historic data to predict future asset performance. Deterministic models apply regression analysis to one or more independent variables, typically condition over time, and develop a “best-fit” equation to determine the rate at which asset conditions change. The independent variables are used to predict a single dependent variable, most commonly represented as the predicted condition at some point in time in asset management applications. Developing deterministic models is relatively easy but relies on quality data collected consistently over several years to produce dependable results. Deterministic models are more easily implemented as they are more readily paired with linear program solving. They also provide consistent outputs. The downside of deterministic models is the limited insight that they provide into the cost uncertainty surrounding a strategy.
Probabilistic Modeling
Unlike deterministic models, which provide a single repeatable outcome, probabilistic models provide a distribution of possible strategies that provides insight into the cost uncertainty of plans. Probabilistic models can also more readily accept uncertainty in other variables, as represented by the shading in Figure 4.8. Given that condition changes are probabilistic, no two strategies that the model will provide are the same. This means that multiple iterations of the model with the same inputs can provide different results. Accordingly, probabilistic models are useful for setting funding limit expectations, while deterministic models help to provide insights into which projects are best to apply to specific assets.
Common approaches to developing probabilistic models are the Markov, Semi-Markov and Weibull models. Markov modeling works well for assets with condition ratings based on regular inspections. There are several ways of establishing a Markov model, but the simplest is to calculate the proportion of assets that change from one condition state to the next in any given year. These proportions are then used to develop what is known as the transition matrix. At the start of the model run, an asset “knows” its condition state. Once this is known there is then a probability it will change from its current condition state to the next in any given year. While these types of Markov approaches have been widely used, they do not necessarily model deterioration effectively, as the rate of change of condition increases with time. To address this, Semi-Markov models are used. Like Markov, Semi-Markov models have a condition transition matrix, but this is also augmented with a time selection matrix. In these models the probability of a condition jump is calculated, then the length of time an asset will remain in that condition state is also selected. Using more advanced mathematical techniques, the Semi-Markov approach can be expressed similarly to the Markov approach, but for Semi-Markov, the transition matrix changes with time. This reflects the increasing likelihood the asset will transition (deteriorate faster as its ages). Such models are typically used on long-lived assets.
A Weibull model offers another approach for modeling asset deterioration. A Weibull distribution predicts the likelihood of asset failure or deterioration as a function of age. Weibull models are particularly useful for addressing assets rated on a pass/fail basis during inspection. The Weibull model provides an additional factor meant to address the increasing or decreasing likelihood of an asset moving from an acceptable to an unacceptable state between inspection cycles. Reliability is the inverse of the probability of failure (i.e. 1 -p(f)). Reliability, like Weibull can thus be used to assess the likelihood an asset will provide the required service. The relationship between time and reliability is assessed by analyzing asset behavior to understand potential modes of failure. This analysis is a core aspect of reliability-centered maintenance, and is more typically used on short lived assets.
Figure 4.8 Example of a Probabilistic Model
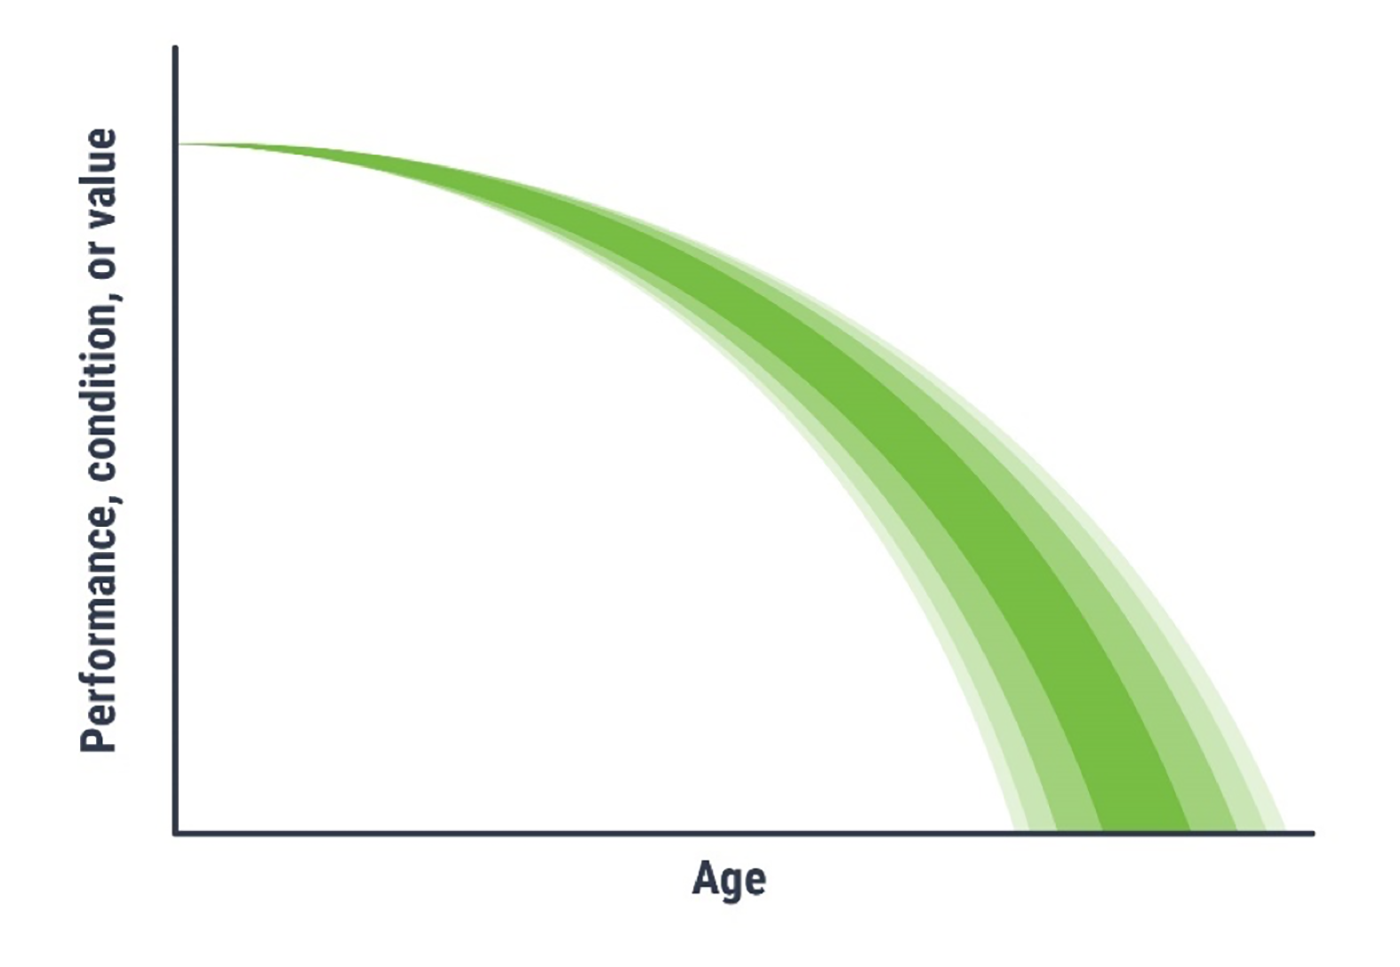
Source: Adapted from Transportation Research Board. 2012. Estimating Life Expectancies of Highway Assets, Volume 1: Guidebook. https://doi.org/10.17226/22782.
Accounting for Uncertainty in Asset Performance
Performance modeling uses historic data to estimate future performance; however, not all future events are predictable nor is past performance necessarily a predictor of future performance. This section considers how uncertainty can be introduced into the analysis.
The unpredictability of future events introduces uncertainty into prediction models. Additionally, the amount of uncertainty tends to increase with time so their affects are compounded. As outlined in the previous section, probabilistic modeling is one approach that can be used for accounting for uncertainty, but what level of uncertainty is acceptable?
To minimize uncertainty, an agency must first understand the source of the uncertainty. A common type of uncertainty related to asset management is the behavior of the assets themselves. Due to the advancement of technology and knowledge and differences in materials and construction practices, there can be significant differences in performance between otherwise similar assets. The change in behavior can be positive, such as the introduction of epoxy-coated reinforced steel in bridge decks to delay the onset of corrosion from road salt intrusion or the introduction of Superpave and performance graded asphalt binders to reduce pavement cracking and rutting. Other changes in behavior are less easy to predict, such as the impact of salt intrusion on prestressed, post-tensioned concrete box-beam bridges. Other sources of uncertainty include:
- Weather events, e.g. flooding, drought, or freeze-thaw
- Earthquakes
- Climate change
- Traffic accidents
- Data inaccuracies
- Inaccurate models
- Poor assumptions
Uncertainty caused by variability in the data can often be addressed through the development of quality assurance plans that describe the actions an agency has established to ensure data quality, whether the data is collected in-house or by a contractor. Common quality assurance techniques include documented policies and procedures to establish data quality tolerance limits, independent reviews of collected data, and training of data collection crews. Data management strategies are discussed in more detail in Chapter 7.
To evaluate the accuracy of models and assumptions, agencies can include multiple scenarios in their life cycle planning analysis to test the impact of different decisions. This type of sensitivity analysis can be helpful in identifying areas in need of further research or developing contingency plans if the initial assumptions turn out to be inaccurate.
To understand whether time and effort should be invested in minimizing uncertainty, a risk-based approach can be used. Assuming the consequence arising from a defined issue or event remains the same, the cost in terms of data collection of reducing uncertainty can be investigated. As an example, the condition state of an asset, as determined using a visual approach, may not provide the required level of insight, which results in poor or unknowable treatment decisions. To minimize the uncertainty, extra testing can be carried out. The level of testing would be defined by the risk-cost reduction ratio. Similarly, with climate change, how much would have to be invested in studies to understand the effects on asset longevity? Thus, through risk management, an agency determines which risks are tolerable and which must be actively managed through investigations, studies, and other research. The risks are identified, prioritized, and tracked using a risk register (see Chapter 2). For those risks that should be managed, plans are developed to outline actions that will be taken to mitigate threats or take advantage of opportunities, as discussed in Chapter 6.
Halifax Regional Water Commission
Halifax Regional Water Commission (Halifax Water) has employed a deterministic modelling approach to create a plan for their storm water assets. The management system was used for long-term planning their culvert portfolio (approximately 1744 cross culverts on 3700 lane km of regional roads). The software uses deterioration curves, a temporal model periodic simulation model and has integrated Geographic Information System (GIS) capabilities.
Initially the analytical objective of the model was to maximize the average condition of all the culverts and minimize the investment. Several constraints were embedded within the initial model analysis including:
- Non-Increasing percentage of culverts in critical condition
- Replace all culverts that exceed expected useful life
- Budget not to exceed scenario
The scenario analysis allowed Halifax Water to establish a minimum investment level required to bring the portfolio to an acceptable average condition state, have a reliable forecast of future condition trends, and quantify an estimate of accepted risk of failures. The figure below shows the agency’s forecasted risk of failure over time based on the selected strategy and projected funding.
NBDTI forecasted culvert conditions using a deterministic model.
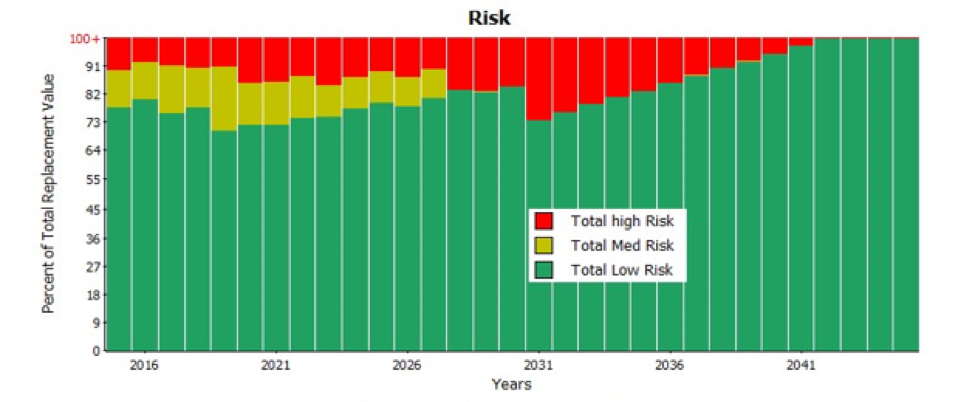
Applying Other Life Cycle Management Approaches
Assets that are managed using an interval-based or reactive management strategy require different approaches for planning and optimizing work than assets managed using condition. The life-cycle plans for these assets range in terms of sophistication depending on the available data.
When to Use Approaches Other than Condition-Based Management
Condition-based management requires a commitment to reliable asset condition information. The necessary level of effort is not likely to be appropriate for some assets. Some assets do not lend themselves to management using a traditional condition-based management approach. The five most common reasons assets do not fit a condition-based approach are as follows:
- The assets do not have a typical life cycle – This group of asset classes includes rock slopes or other perpetual features that do not have predictable deterioration patterns.
- The assessment of condition or performance may not be feasible – The most common type of assets in this second group are geotechnical or utility assets for which many elements may be buried or otherwise inaccessible. The absence of a rating methodology may also drive the management of assets using something other than a condition-based approach.
- The life cycle is driven by factors other than condition – There are many assets that are replaced when they are worn out or obsolete. Technology assets, which are susceptible to obsolescence at a frequency similar to their functional service lives, are examples of assets that fall into this category.
- The assets have long service lives and the failure of individual assets presents limited risks to safety or system performance – Examples of these asset classes include guardrail, gravity retaining walls, or highway lighting.
- The performance expectations require the asset to remain in near-new condition. For safety-critical assets, replacement may be necessary before signs of deterioration are evident. This is most common in risk-averse industries such as aviation. However, contractual arrangements, such as in public-private partnerships (P3), may require condition or performance targets that warrant a life cycle management approach other than condition-based.
As discussed earlier, assets that fall in these categories are typically managed using an interval-based approach or a reactive approach. Some agencies also use a risk-based approach for certain types of assets, such as rockfall management. These three different approaches are briefly explained, and examples are provided for each approach.
Alternative Life Cycle Management Approaches
Three alternative life cycle management approaches are discussed in this section. These are interval- or age-based strategies, reactive strategies, and risk-based strategies.
Interval- or Age-Based Management
Interval- or age-based strategies can be utilized for failure-critical assets, assets subject to obsolescence or assets with no or limited maintenance actions. Age-based strategies replace assets after a given time in service without regard to the asset’s condition at that time. This approach can also be used for very short-lived assets, such as paint markings. Advantages include proactive minimization of failure and reduction of uncertainty in funding needs. An agency that replaces signs on a 7-year cycle or replaces pavement lane markings annually is using an interval- or age-based approach to manage its assets.
Interval-based strategies are also useful for assets that do not show physical wear, but are safety- or operations-critical.
Reactive Management
Reactive strategies can be used for assets that have long service lives and limited maintenance options. Reactive strategies can be based on the results of an on-going monitoring program or on event reporting. Examples of assets that may be monitored periodically to check that they are working as intended includes retaining walls and overhead sign structures. Assets that may be more likely to be maintained based on a report that the asset is damaged or no longer working include light bulbs and guardrail.
Risk-Based Management
While all management strategies are risk-based, there are times when risk assessments are used directly as the measure to establish objectives, set targets, drive decision making, or assess progress. This approach is used when the condition of the asset does not directly represent the level of asset performance, and the potential impact of an asset’s condition on system performance must be considered. This approach is commonly used for managing slopes and other geotechnical assets.
Nevada DOT
Nevada DOT recognized that the level of investment in ITS equipment (e.g., closed-circuit cameras, dynamic message signs, flow detectors, highway advisory radios, environmental sensor stations, and ramp meters) was increasing significantly and the importance of this equipment to network operations was growing. As a result, the DOT chose to establish a method of managing its ITS assets that would minimize the risk of failure and provide information to support budgeting activities. However, since the DOT had limited data on its ITS components, a process was developed that relied on the following factors to establish maintenance cycles:
- Historical performance
- The typical timeframe before the software became outdated
- Manufacturer recommended service life
- To determine the condition of ITS traffic cameras, Nevada DOT developed a transition probability matrix with four condition criteria based on the device manufacturers’ recommended service life as follows:
- Good – device age is less than 80 percent of the manufacturer’s recommended service life
- Low risk – device age is between 80 to 100 percent of the manufacturer’s recommended service life
- Medium risk – device age is between 100 to 125 percent of the manufacturer’s recommended service life
- High risk – device age is greater than 125 percent of the manufacturer’s recommended service life
The transition probability matrix was used to model ITS asset deterioration and program maintenance actions over a 10-year analysis period via the use of a simple spreadsheet tool. The results of this analysis showed an interval-based approach to managing ITS assets would result in an estimated savings of $1.1 million over a 20-year period.
Source: Nevada DOT TAMP (2018)
Colorado DOT
Colorado DOT responds to between 50 and 70 geotechnical emergencies a year. The traditional approach to managing rockfalls was based on the size and frequency of rockfalls. This approach did not consider the criticality of the facilities that could be impacted by a geohazard event. Since 2013, the Colorado DOT has used a risk-based approach to evaluate and prioritize geohazard mitigation activities based on the size of the geohazard areas and the frequency of falls. Colorado DOT’s approach includes a measure of Risk Exposure (RE), which is based on three components:
- Average Annual Daily Traffic (AADT).
- Likelihood of a Vehicle Being Affected by a Geohazard Event. This metric considers site-distance, the number of previous rock-fall accidents, and a measure of how frequently a vehicle is below the hazard on a daily basis.
- Reduction Factor. This considers the effectiveness of prior mitigation actions, to reduce the RE score.
Colorado DOT’s geohazards program uses the RE to allocate an annual budget of about $10 million to manage geohazards. Due to the inherent uncertainty of geohazard management, in addition to the geohazard management program, maintenance staff regularly patrol highways known to have geohazards. If a hazard requiring immediate action is identified, maintenance crews respond promptly. Using the RE for prioritization allows Colorado DOT to focus its efforts on reducing the impact of geohazards on users of the highway system.
Implementing Life Cycle Management
Implementation of life cycle management often requires agencies to review existing data sets, processes, and policies to ensure that the recommended scenarios are reflected in the projects and treatments that are programmed and constructed. Within transportation agencies, this often requires improved coordination between business units such as planning, programming, engineering, maintenance and operations. Information about strengthening organizational communication and coordination was discussed in Chapter 3.
This section focuses on the aspects of implementation that are most directly related to using life cycle management results to maximize the service lives of infrastructure assets as cost-effectively as possible. It highlights the need to evaluate agency policy, data issues, and work processes to support life cycle management.
Linking Life Cycle Strategies to Asset Management Policy
Agency policies influence the types of decisions that are made within an agency and the priority with which activities are funded. The life cycle management approach selected for each asset class will impact the type of policies, procedures, and data required to support investment decisions to ensure alignment between planned and actual work activities.
Aligning the organization to support the implementation of life cycle management strategies involves many of the same types of organizational change processes discussed in Chapter 2. As part of this alignment, an agency must ensure that it has in place the processes and resources needed to deliver the work activities required for executing the selected life cycle strategies.
Chapter 2 introduced the importance of establishing Asset Management policies to help integrate asset management at all levels of an organization. An Asset Management policy can support life cycle management by establishing processes for setting realistic performance objectives and treatment strategies that focus on a commitment to sound, long-term investments. The following examples demonstrate how agencies can select a life cycle approach that supports the agency’s higher-level policies.
The following hypothetical examples show how policy and management strategy work together to deliver transportation services and manage risks.
Reactive Strategy Example – Agency A has determined its guardrail inventory is generally in good condition and typically replaced as part of pavement rehabilitation projects. On average, replacements occur at least every 30 years, which is more frequent than the expected service life ranging from 40 years for cable to 75 years for concrete barrier. As a result, the agency can accept a life cycle strategy of maintaining a complete inventory and annual inspection of a random two-percent sample.
This life cycle strategy introduces the risk of a rail being damaged by collisions or other events and left in service, presenting a danger to highway users. To manage this risk, the agency implements a policy of repairing all damaged guardrail within 3 weeks of becoming aware of damage. Additionally, internal procedures are put in place to notify area maintenance managers of incidents reported through the state police accident reporting system, and standby maintenance contracts are established for guardrail repair to ensure adequate resources are available in compliance with the new policy.
Condition-Based Maintenance Example – Agency B has determined it can provide significant, long-term performance improvement in average bridge condition and service life if it can increase its investments in bridge maintenance activities like sealing concrete, repairing joints and spot painting steel. To fund this initiative, however, the agency must replace three fewer bridges on average each year. The short-term impact of this new life cycle strategy is an increase in the risk of unsafe conditions occurring on bridges that would have been replaced under the previous strategy. To overcome this risk, the agency increases the frequency of inspections on bridges exceeding the level of acceptable risk according to analysis from its bridge management system, and a series of standby contracts are established to provide rapid response of specific structural repairs to extend the service lives of poor bridges by addressing only critical structural deficiencies or risks.
Data Required for Implementation
All life cycle management approaches need inventory and performance information, but the extent, detail, accuracy, and precision of the required information varies greatly given the chosen approach.
Assets that are managed using a condition-based approach rely on detailed inventory and performance information so that current and future conditions can be estimated, and the benefits and costs associated with each viable strategy can be evaluated. Interval-, time-based, and reactive approaches can be performed with less detailed information about the assets. Agencies using these approaches may estimate the size and age of the inventory at early levels of maturity. Over time, the type of information available and the level of detail associated with it may improve, allowing the agency to mature in terms of its analysis capabilities.
Table 4.3 provides examples of typical management strategies for common highway asset classes and the types of information used to support each one. The information in table 4.3 reflects general trends in transportation agencies. In practice, each agency must identify the specific elements and data requirements needed to support their needs within resource constraints. Chapter 7 addresses methods of collecting information efficiently (see table 7-3) and Chapter 6 stresses the importance of keeping inventory and performance data current. Establishing data governance structures to manage asset data is also an important consideration, as discussed in Chapter 7.
Table 4.3 - Typical Maintenance Strategies and Supporting Data
| Asset Type | Typical Maintenance Strategy | Typical Information Collected and Used |
|---|---|---|
| Pavements | Predictive, condition-based maintenance |
|
| Bridges | Predictive, condition-based maintenance |
|
| Overhead Sign Structures | Monitoring-based or Interval-based maintenance |
|
| ITS Assets | Interval-based maintenance |
|
| Guardrails | Reactive maintenance |
|
Incorporating Life Cycle Management into Work Planning and Delivery
Life cycle management approaches and corresponding life cycle strategies are the means by which agencies identify the work necessary to meet their asset management goals within funding constraints. However, for those asset management goals to be met, the necessary work must actually be delivered. This requires the recommendations from life cycle analyses to be incorporated into the business processes by which the agency identifies, prioritizes, programs, designs, and delivers work. In most agencies this includes multiple business processes and funding streams. The following subsections describe how life cycle management can be incorporated into common processes within transportation agencies.
Planning and Programming
The planning process seeks to identify the set of investments that will effectively and efficiently achieve an agency’s goals and objectives. As an agency alters its approach to managing assets, this may change assumptions previously influencing the planning process. Significant changes in an agency’s approach to managing its assets can require updates to long-range or strategic plans. Similarly, changes in long-term objectives or plans can prompt a change in life cycle strategy or approach.
Coordination is needed between long range transportation planning, performance-based plans such as the TAMP, and programs of work, such as TIPS and STIPs (see chapter 2). In particular there is a need for alignment between the financial planning procedures and documentation between these different efforts and products. Although programs tend to be relatively short term, often 1 to 4 years in length, agencies must identify investment needs several years in advance to ensure projects can be delivered when required. Complex reconstruction or modernization projects can take 10 years or more to deliver from scoping to construction. Thus, it is important to keep planners informed of changes in selected life cycle strategies. Changing new life cycle strategies may lead to significant differences in the projects selected.
Project Engineering
Life cycle management is a framework for identifying the appropriate treatments throughout an asset’s service life to maximize performance. Project engineering includes the processes for packaging work into contracts for delivery. Thus, project engineering is responsible for ensuring the right treatment is delivered at the right time and within the anticipated cost. Additional details on work packaging to support asset management are provided in chapter 5.
Maintaining strong internal controls ties project decisions to their impacts on anticipated asset performance. Project schedule changes may cause inappropriate treatments to be applied to assets, resulting in unnecessarily high costs or poor performance. Scope changes often lead to cost changes, and while cost changes may be addressed for a specific project, the funds added to that project would not be available to address other system needs.
Use of Agency Maintenance Forces
Effective delivery requires adequate labor capacity with appropriate training, proper equipment, and necessary materials. Changes in an agency’s management approach can alter the requirements for any of these aspects of maintenance management. The necessary treatments cannot be delivered if a properly sized and equipped crew cannot be assembled. Maintenance staff cannot administer treatments for which they are not properly trained or correctly supplied. Therefore, it may be important to have maintenance management staff actively engaged in the process of identifying preferred life cycle management approaches.
Fredericton, New Brunswick
The City of Fredericton has, over the last 15 years, implemented several life cycle management strategies that have significantly changed how they deliver municipal services with their infrastructure. Three examples are briefly summarized below:
- Long term life cycle planning: Infrastructure accounting policy changes led to the city establishing long term replacement forecasts for each asset class to estimate the sustainable level of funding required for investment for capital budgeting. This required a complete inventory of their assets, changes in how future replacement costs were estimated, as well as changes to the analysis period used for long term planning. At least one life cycle for all assets had to be captured in the forecast horizon.
- The City implemented a Lean Six Sigma strategy to assess processes and how services were delivered. This methodology helped identify efficiency opportunities, but also identified intervention strategies that previously were not considered in project scoping previously.
- The City evaluated its labor and outsourcing policies as a consequence of the lean approach, and in some circumstances, shifted resources to have dual roles for service delivery, or used external service providers to be responsible for infrastructure, or service delivery.
What is Resource Allocation?
In the context of TAM, resource allocation is the process of assigning scarce resources to investments in transportation assets. The assigned resources can be money, staff time, contractor capacity, equipment, or anything else that an organization requires for its assets. The investments can be capital projects, maintenance efforts, or other projects and activities that require the use of an organization’s resources through various delivery methods.
To the extent an organization is focused on preserving its existing transportation assets, ideally it will make investments consistent with the life cycle management approach for its assets as described in Chapter 4. However, organizations often lack the funding, staff, or other resources needed to achieve all of their goals and objectives, and must make hard decisions about how to divide resources while considering competing needs. If resources for existing assets are systematically constrained such that the life cycle management approach is simply not achievable, the resource allocation process may need to revise life cycle strategies or the overall life cycle management approach.
The approaches used for resource allocation vary. For instance, in considering how to allocate capital funding over multiple years, an organization may need to either prioritize projects or establish an overall budget for certain types of investment, depending on the specific context. In day-to-day allocation of operations and maintenance resources, the challenge is more tactical, as a manager assesses what staff, materials and equipment are immediately available, considers both internal forces and contract capacity, and puts these to the best possible use considering current conditions and challenges.
The output of the resource allocation process could be a specific assignment of resources or a plan for what capital projects to fund. In addition, the results of the resource allocation process may impact other plans and decisions related to TAM. To the extent the process involves allocating money, a financial plan may serve both as an input to the process (by specifying what funds are available) and an output of the process that details how funds will be spent. TAM financial planning is discussed further in Section 5.3.
Once an initial set of resource allocation decisions has been made, an organization may need to reconsider the best delivery option for planned work. Issues related to work planning and delivery are discussed further in Section 5.4.
All organizations practice resource allocation in some manner, whether formally or informally. By using a structured and repeatable approach for resource allocation, an organization improves its own resilience and ensures that it will continue to succeed even as new challenges arise and personnel changes over time. This chapter outlines an idealized approach to resource allocation an organization can use to help assess how it allocates resources, and how best to improve its process.
It also describes various processes closely related to resource allocation, such as risk management, financial planning and work planning and delivery.
Transportation Agency Context
For U.S. transportation agencies, the resource allocation process is influenced by the set of legislative and regulatory requirements related to transportation planning and programming.
Since the early 1970s, U.S. Metropolitan Planning Organizations (MPOs) and state Departments of Transportation (DOTs) have been required to develop long-range transportation plans (LRTPs). These plans establish the goals and objectives of an agency and detail its high-level investment plan (not necessarily listing specific projects) over a period of at least 20 years.
Requirements initiated by MAP-21 further specify that an LRTP should be performance-based, detailing forecasted performance using a set of federally specified performance measures, and additional “locally significant performance measures” if desired. These measures include summaries of good/fair/poor condition for National Highway System (NHS) pavements and bridges. MPOs include performance measures and targets in their LRTPs. State DOTs have additional requirements to report shorter-term performance targets in different areas, including two- and four- year targets for NHS pavement and bridge condition.
In addition to developing LRTPs, MPOs and state DOTs are required to develop investment plans: each MPO develops a Transportation Improvement Program (TIP), while each state DOT develops a Statewide TIP (STIP). A TIP or STIP is a four-year (or more), fiscally constrained program of projects, including those that use federal funds (with some exceptions), additional “regionally significant” projects, and other projects the agency wishes to include. Because TIPs and STIPs are fiscally constrained, an agency must project its available revenue for the investments (typically capital) covered by the program over a period of at least four years, and many agencies have developed revenue projection models extending further into the future to support longer-range planning.
Beginning in 2018, again as a result of MAP-21, state DOTs are required to prepare TAMPs addressing pavements and bridges on the NHS at a minimum, while potentially including other asset classes and road systems. An agency’s TAMP describes the asset inventory and its conditions, how assets are managed over their life cycles, and a 10-year financial plan for how to best maintain assets in a “desired state of good repair.”
The various plans and programs cover different time periods and are intended to comply with different requirements. However, all of them may impact the resource allocation process, particularly with respect to allocation of funding for capital projects.
TIP
Information gathered and data analyzed in the TAM process should inform resource allocation decisions that agencies document primarily in their LRTPs, TIPs, or STIPs. This is where integration and collaboration with planning and programming groups within the agency is essential.
While these requirements are specific to the U.S., other countries have established their own planning and programming requirements, resulting in different—though frequently analogous—impacts to their resource allocation processes. Lessons learned from asset management experience in the U.S. and abroad include:
- In some cases organizations have implemented asset management programs and prepared asset management plans in response to legal requirements, while in others efforts to implement asset management concepts have been motivated by a desire to improve decision-making. While it is difficult to generalize, it appears that jurisdictions that adopt asset management planning by choice tend to realize the benefits much more quickly, improve service delivery, and allocate resources more effectively.
- Alignment of resource allocation to achieve goals and objectives is very important to ensure an agency advances from a traditional maintenance management approach, in which targets for asset conditions result from the available budget, to a performance-based approach in which an organization’s goals and objectives help define the required level of service (LOS) for its assets, which in turn drives resource allocation decisions.
- Organizational goals ideally should not focus on assets, or their condition, but the outcomes that are desired, such as improved mobility, safety and infrastructure resilience. Changing technology (CAV, communications), social (graying populations, work from home patterns, ridesharing), economic (integrated transportation modes), may be very relevant to how resource allocation should be conducted. Agencies that make resource allocations based largely on the condition and life cycle strategies of only the existing portfolio, may face greater challenges achieving their goals, and adapting to the changing needs of their economies.
- International and US DOT agencies that have focused resource allocation on their goals and objectives, rather than on the existing assets they are responsible for, tend to be more readily able to leverage alternative service delivery models that may present service enhancement or cost saving opportunities. These agencies agree that “We don’t need to build it or own it or maintain it, to deliver mobility.”
Washington State DOT
Washington State DOT has worked closely with its legislature to adopt asset management based resource allocation policies.
The following is an excerpt from state legislation that was last updated in 2002:
”deficiencies on the state highway system shall be based on a policy of priority programming having as it’s basis the rational selection of projects and services according to factual need and an evaluation of life cycle costs...”
– RCW 47.05.010
This legislation along with good business practices has made Washington State DOT have one of the most mature asset management practices and an integrated set of tools, business processes, and organizational culture to support good asset management.
Prototypical Resource Allocation Process
The basic resource allocation approach includes seven basic steps. Specific approaches to resource allocation differ depending on where resources are being allocated and the organizational context.
This section describes a basic resource allocation process. The resource allocation process can be used to answer three key questions:
- What resources are required and how should they be distributed over time to best meet the long-term goals and objectives?
- What performance targets are achievable given available resources?
- How should resources be used in the short term to best support the goals and objectives?
The details of the process differ depending on what resources are being allocated to what investments, the timeframe and the particular circumstances faced by the organization.
A generic process is presented here as a framework for assessing the different allocation processes used by different organizations, as well as to help structure the discussion of issues related to resource allocation presented in subsequent sections of this chapter. The process is iterative; it is frequently necessary to walk through the process in order to establish a proposed allocation, review the proposed solution, and then revisit the assumptions made earlier, altogether resulting in a revised outcome.
TIP
Almost all agencies already have structured resource allocation processes; introducing TAM or improving TAM practice should begin with assessing existing processes to identify areas where asset-related data and TAM process analysis outputs (e.g. life cycle planning outputs) can be incorporated.
In applying the prototypical process, it is important to consider that organizations typically have different resource allocation processes for allocating different resources over different time periods. The basic steps in the process are the same regardless of the specific context, but the details of how each step is performed may vary.
For example, in considering how to allocate resources over a period of 10 years or more, an organization might consider what funding is needed and how best to allocate funds across multiple investment categories while setting aside decisions about specific projects. In this case, the key resource being allocated is money, and the emphasis of the process will be on Step 1 – Establish Goals and Objectives and 3 – Quantify Targets. Further, in this case there may be less emphasis on Step 2 – Determine Constraints, and the prioritization performed in Step 5 may yield identification of high-level priorities rather than a prioritization of specific projects.
On the other hand, when considering how best to use staff resources and materials to perform maintenance work in the short term (less than one year), the organization would apply the process differently. In this case, the resources being allocated would include time and materials. The emphasis on the process will be on Step 2 – Determine Constraints, Step 5 – Prioritize Investments, and Step 7 – Finalize Allocation and Plans. In this case the specific allocation may not have a significant impact on the goals and objectives established in Step 1, and the prediction of future performance in Step 6 is less relevant than in the case of a longer-term allocation.
The practice examples in this section show how agencies have implemented this basic process to address different resource allocation challenges.
TIP
Although a generic framework for resource allocation is presented, agency context and other factors (e.g. legal requirements) will create the need for agencies to allocate resources in different ways.
Michigan DOT
Michigan DOT recently introduced principles of performance-based contracting to their routine highway maintenance delivery. The focus of this initiative was on developing a better understanding of performance, providing more consistency of service, encouraging innovation adoption and identifying efficiency opportunities.
To achieve this MDOT developed performance measures for 23 non-winter maintenance activities. They then examined how these activities contributed to the objectives and community outcomes MDOT wanted to achieve (e.g. safety, reliability, economic benefit, and quality of life) and used that analysis to select six initial key measures for which targets were set to focus the effort. The performance monitoring system helped one MDOT region identify unsealed shoulders (ensuring they are even and traversable) as an area requiring improvement. They invested in additional shoulder maintenance in 2015 and from this realized a performance increase of more than 30%.
MDOT is using this performance monitoring approach to better understand the cost of improving its maintenance level of service. The agency is also identifying specific resources to focus in areas where it can achieve a more consistent and safer outcome.
New Zealand Southland District Council
Southland District Council (SDC) manages one of the largest road networks in New Zealand. Dairy farming is critical to the economy of the local area and more broadly to the Country (SDC generates 10% of New Zealand’s dairy exports). In the period 2000-2010 there had been significant expansion of the dairy farming industry and further expansion was likely. Maintenance and renewal costs were estimated to increase significantly and SDC’s road rates were already among the highest in the country. SDC recognized that a new approach was necessary and they could not keep doing things the same way.
SDC developed the Economic Network Plan as an asset management approach that allowed SDC to determine where investment in the network would provide the greatest financial return to the community. The Economic Network Plan considered the following services provided by the network:
- Safety
- Road Condition (Levels of Service)
- Enable Exports
- Service Delivery
- Customer Quality
Consideration of the resources required to maintain the network led SDC to the decision that its highest volume roads would be maintained to its then-current LOS standard. These roads represented 20% of the road network but carried nearly 70% of the traffic. The remaining 80% of the network would have a reduction in standard over time. The Economic Network Plan provided the basis for this change.
Like many agencies, the SDC was forced to take a different approach when financial constraints required change. It enabled all parties to focus on:
- Shifting from ‘Engineering’ to ‘Customer Service Network Management’ (why the service is provided)
- Managing customer expectations proactively rather than reacting to them
- Making safety a priority
- Investing in technology and information to understand, manage and integrate with HCV operators
Source: https://www.nzta.govt.nz/assets/Road-Efficiency-Group-2/docs/southlandnetworkplan.pdf
Note: For more information on this example, see the case study on the SDC’s experience in the International Infrastructure Management Manual (IIMM).
South Dakota DOT
SDDOT’s agency mission is “to efficiently provide a safe and effective public transportation system.” To support this high-level goal the agency sets ten-year objectives for its pavements and bridges, as well as a minimum acceptable condition for pavements. For pavements SDDOT summarizes conditions using Surface Condition Index (SCI), a composite measure represented on a scale from 0 (worst condition) to 5 (best conditions) that incorporates measures of roughness, rutting, faulting and distress indices. For bridges, SDDOT summarizes conditions based on the percentage of structures in good or fair condition, using the FHWA good/fair/poor measure for classifying the condition of a bridge.
To determine how to allocate capital funds for state-owned pavements and bridges SDDOT relies heavily on its pavement and bridge management systems. The agency predicts conditions for a 10-year period for a range of different budget levels, and then compares the predicted performance to the agency’s goals and objectives. The figures, reproduced from SDDOT’s 2018 TAMP, show results in terms of predicted SCI over time for five budget scenarios generated using SDDOT’s Pavement Management System (PMS), and results in terms of percent of bridges in good or fair condition for two budget scenarios generated using the agency’s Bridge Management System (BMS).
Given the projections as well as additional projections of pavement condition for six functional systems, the agency uses its Trade-Off Tool to evaluate the impact of different funding scenarios and recommends the funding distribution that will produce the greatest benefit. The final result of the analysis is a distribution of funding between asset type and functional system, as well as the distribution of funds between four types of work:
- Construction and Reconstruction
- Resurfacing and Asphalt Surface Treatment
- Rehabilitation and
- Safety
Decisions about what capital projects to perform are then made given the funding level established in the trade-off analysis.
Source: SDDOT Transportation Asset Management Plan. 2018.http://www.sddot.com/resources/reports/SDDOT2018TAMPFHWASubmittal.pdf
State Network Investment Strategies
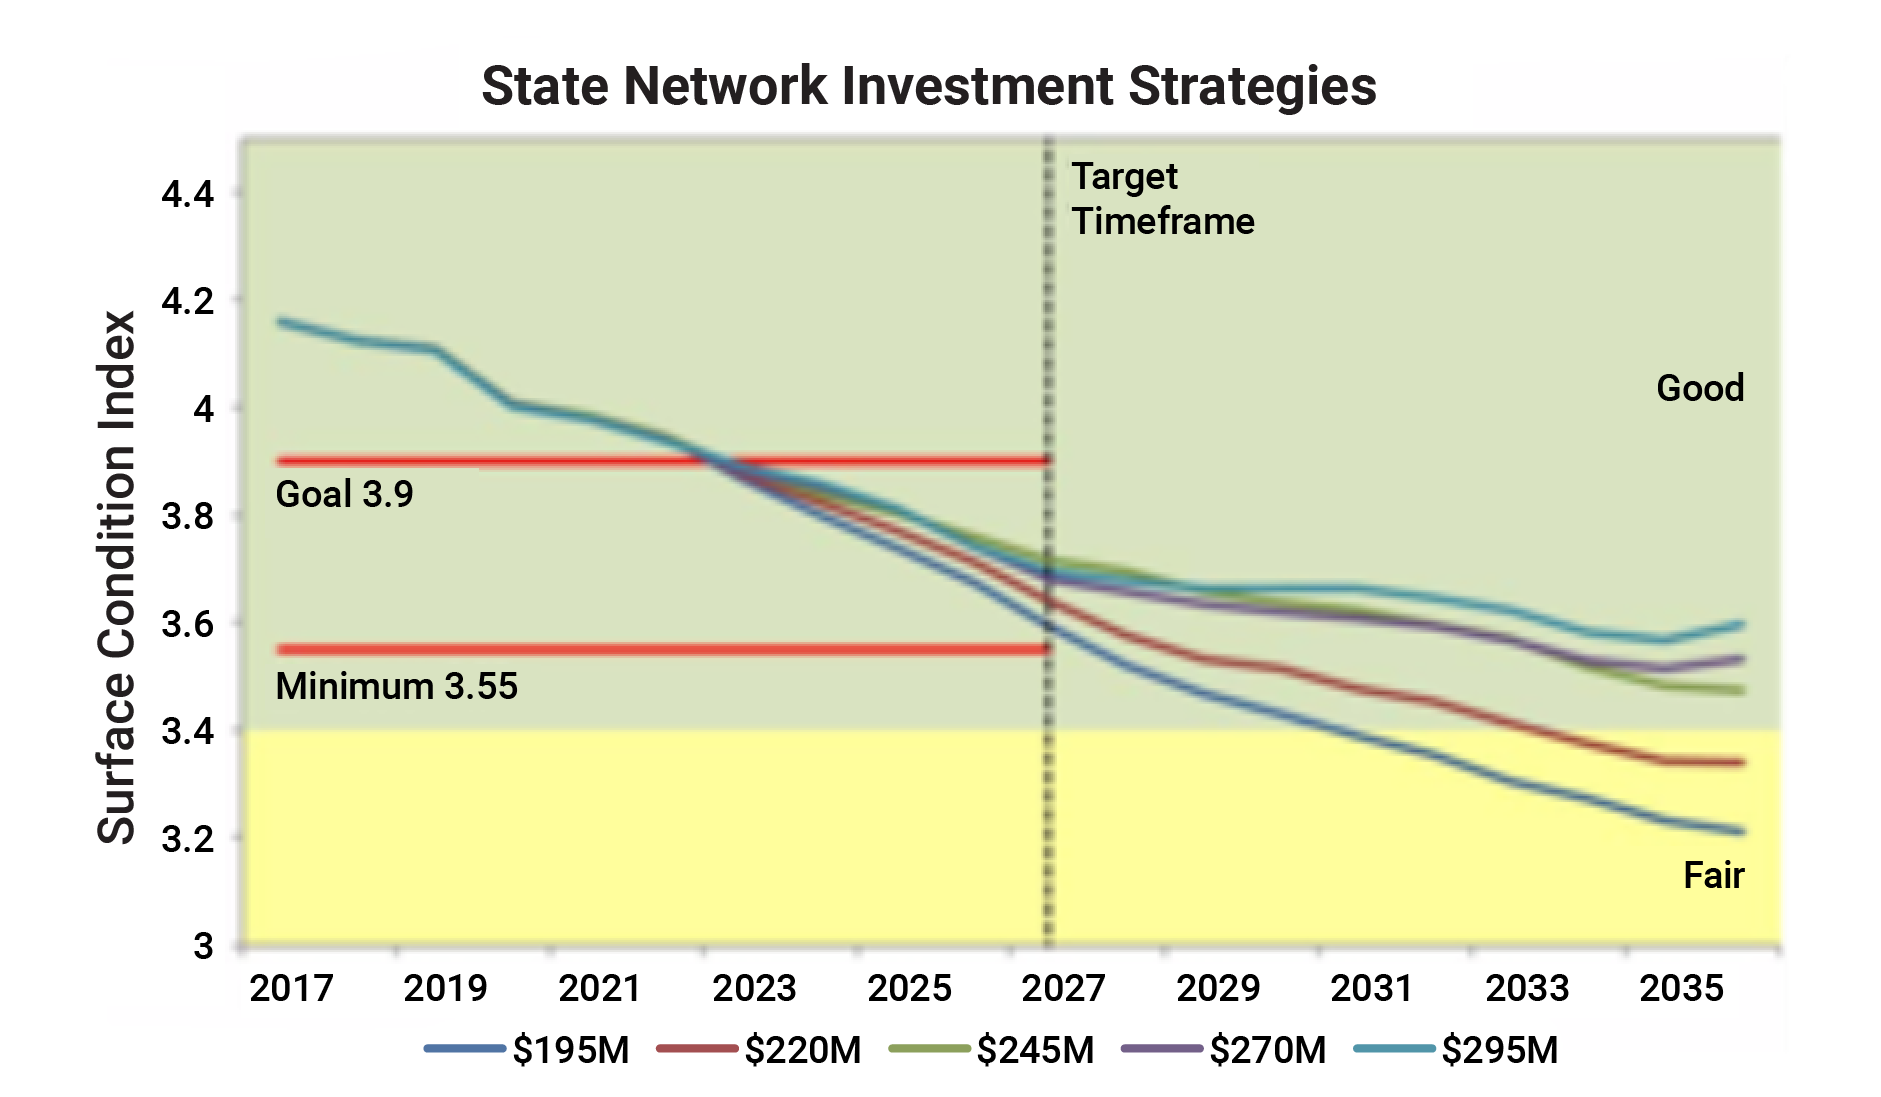
State Network Structure Investment Strategies
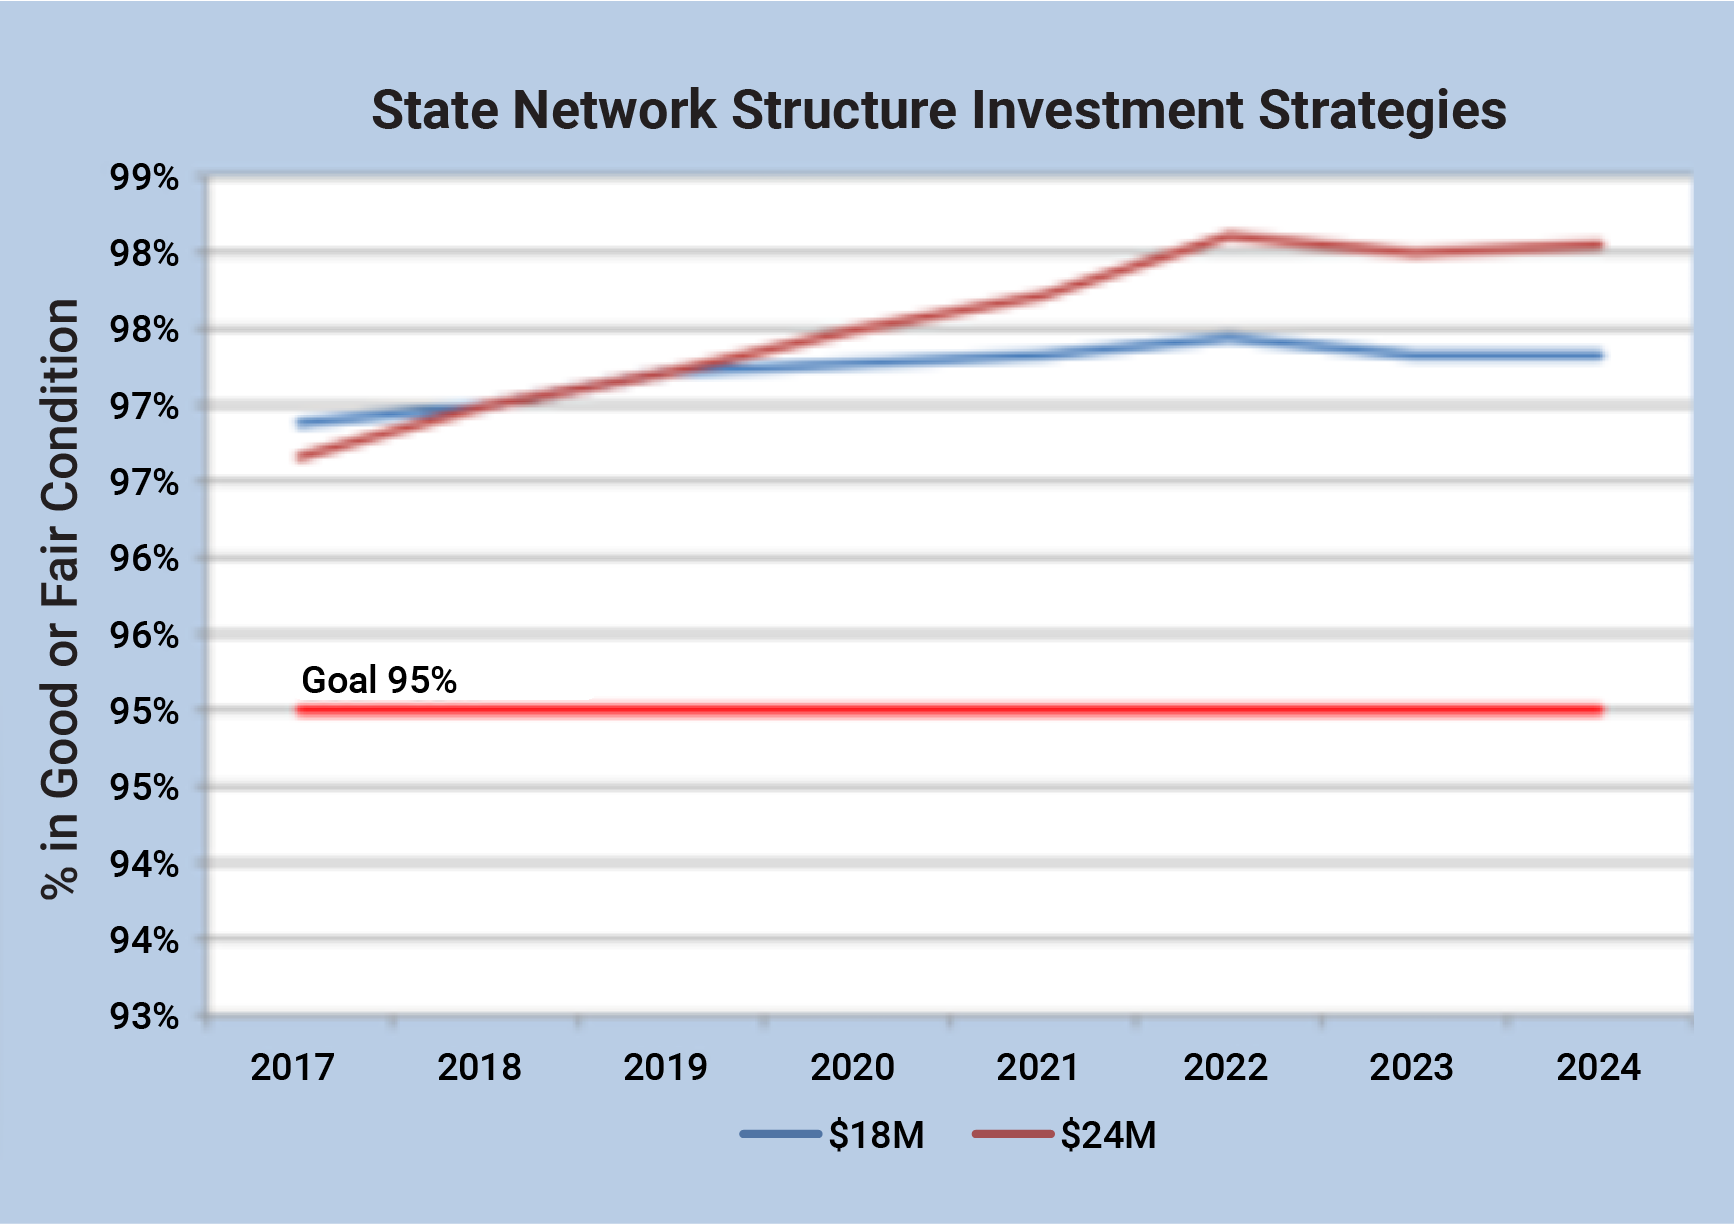
There are Seven Basic Steps in the Resource Allocation Process
- Establish Goals and Objectives. The mission, vision and broad agency goals are meant to guide decision-making across an organization. Goals and objectives may be articulated in an organization’s LRTP and/or TAMP. Ideally, the resource allocation process should support achieving these.
- Determine Constraints. Establish what resources must be allocated, and what the constraints on them are. Typically this will include constraints on available funds, but may include constraints on staff, contractor capacity, equipment, materials, or other resources. Further, there may be other constraints relevant to the process, such as constraints to distribute funds equitably between different regions or areas, or constraints on exactly how certain resources can be used.
- Quantify Targets. Translate goals and objectives into specific criteria for supporting allocation decisions. Where feasible, define performance measures that quantify the level of achievement. Set target values for key measures and establish a target level of service as discussed in Section 5.4.
- Allocate Resources. Split the budget and other resources to the set of program categories or types of work. The allocation specifies the distribution of resources between different categories or work types. The details of how this step is performed are dependent on the details of the resources being allocated, assets being analyzed, and types of investments under consideration.
- Prioritize Investments. Determine what specific investments to make given the overall allocation of resources. This determination may be made within an asset class, across asset classes or across asset management and other investment objectives (e.g. safety or mobility) depending on how the process is structured. The prioritization should maximize achievement of the organization’s goals and objectives as quantified using the measures and targets set in Step 3 subject to the constraints established in Step 4.
- Project Performance. Predict future performance given the assumed allocation and priorities, and compare the predicted performance to previously established targets. This may result in revisions to the constraints, targets or outcomes of other steps described above. To the extent that the targets are set for asset conditions, use the life cycle analysis methods described in Chapter 4 to predict future asset condition.
- Finalize Allocation and Plans. Once allocation is complete, document the resulting targets, projections and investment priorities and communicate these to stakeholders. Further work may be required following completion of the formal process, such as developing maintenance plans based on the set of approved projects.
Figure 5.1 The Resource Allocation Process
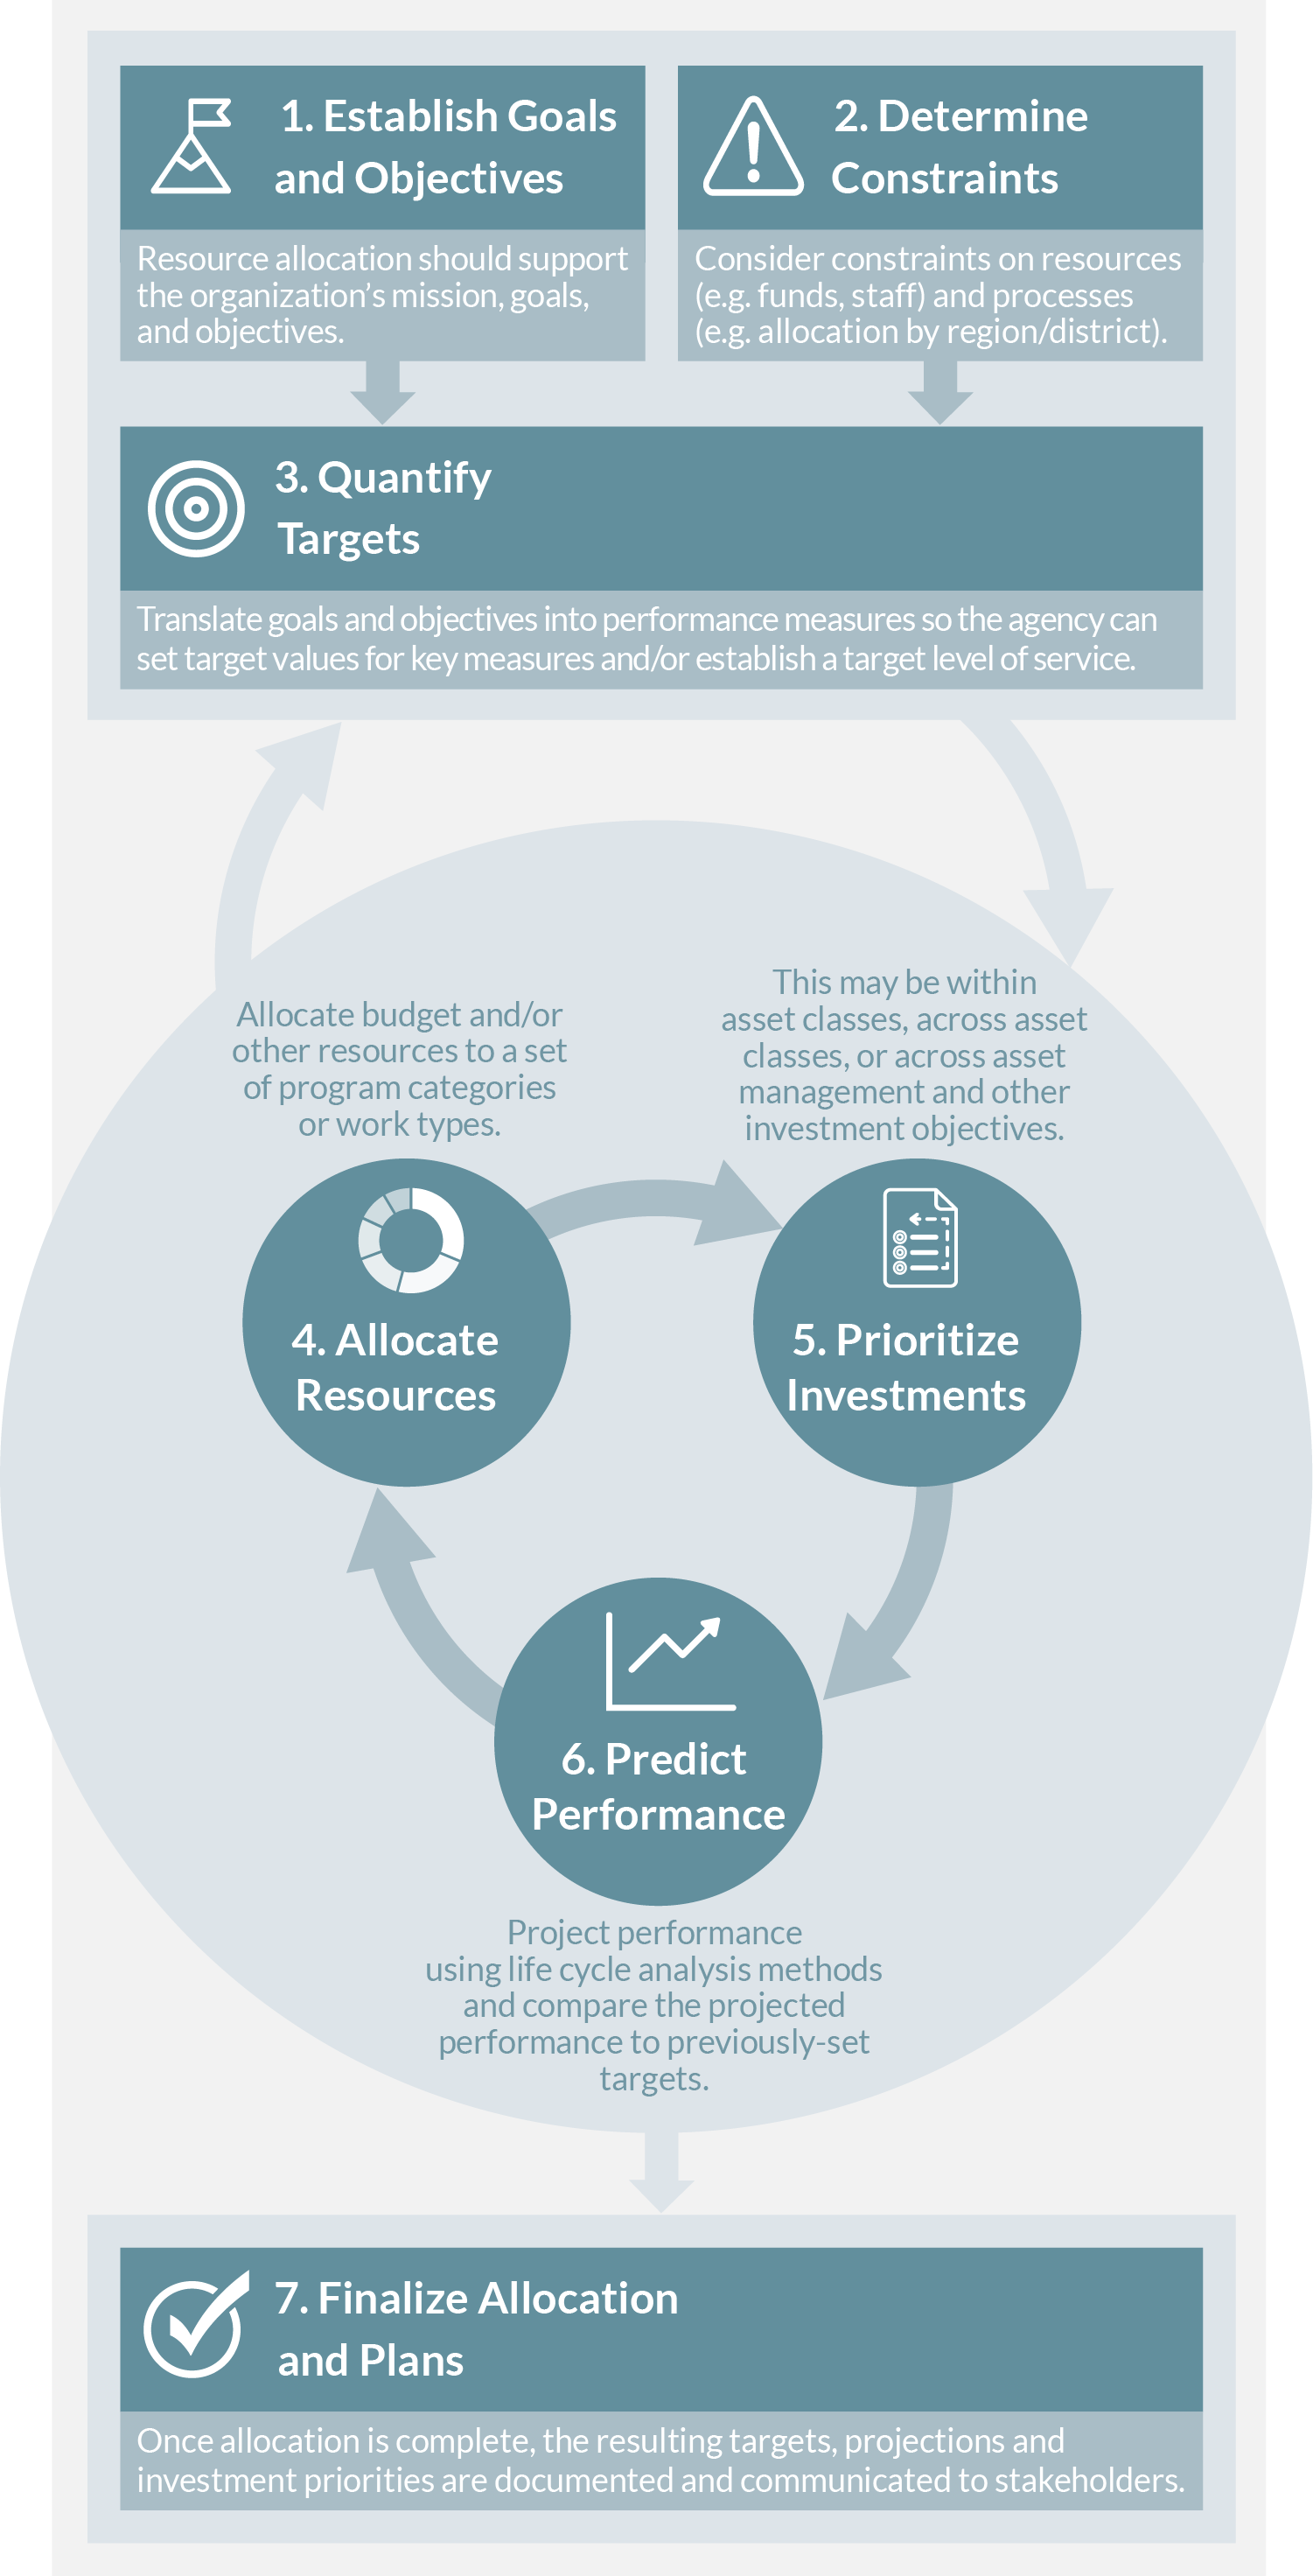
Factors Impacting the Resource Allocation Process
The specifics of how an organization can and should approach resource allocation depend upon a number of different factors. Understanding these factors is key in developing a successful approach to resource allocation.
Figure 5.2 Factors Impacting the Resource Allocation Process
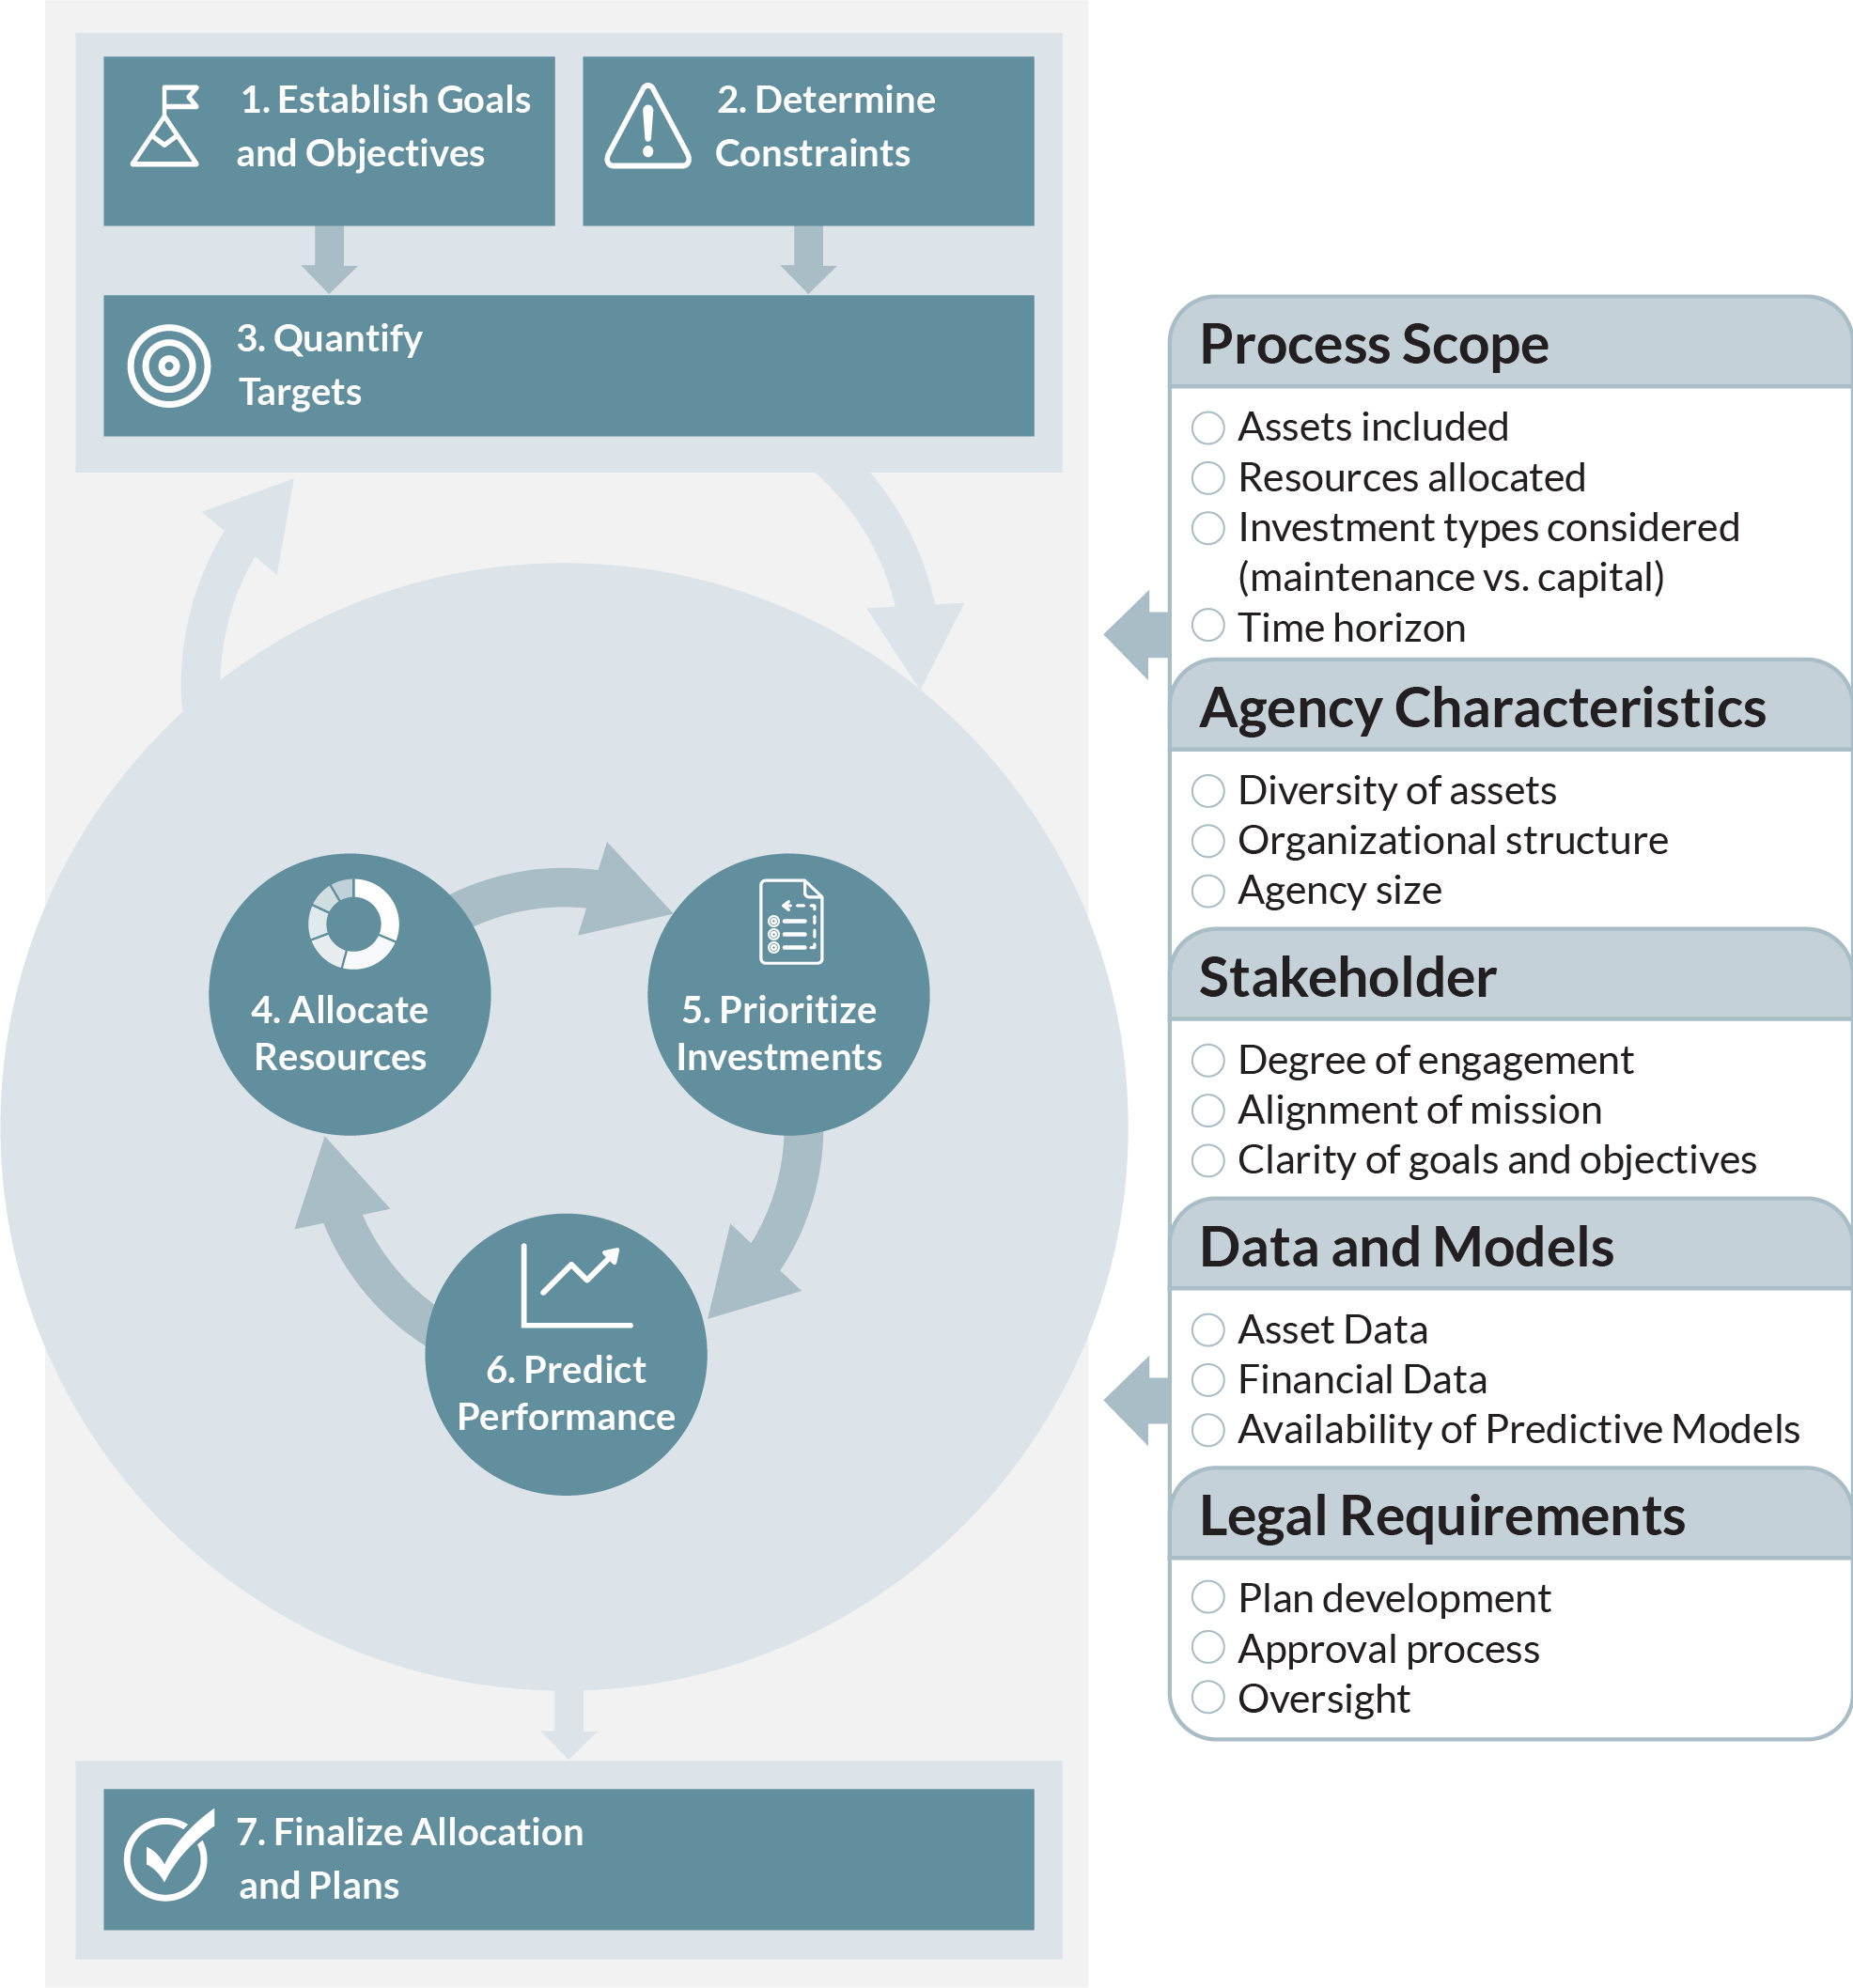
Consideration of Risk in Resource Allocation
Uncertainty and risk complicate the resource allocation decision-making process. Risk management activities, including developing a risk register, are helpful in understanding and mitigating uncertainty, which in turn has implications for resource allocation.
Overview
All transportation decision-makers must contend with uncertainty. In regards to resource allocation, uncertainty is inherent in variables such as data on asset conditions and performance, future funding levels and costs, how a transportation system and specific assets will perform, and what external events or other factors may require reallocating resources. This uncertainty complicates efforts to make decisions about the future and forces agencies to be nimble so as to effectively respond to unpredictable events and evolving conditions.
In recent years, transportation and other industries have made significant progress developing improved approaches for managing uncertainty to minimize negative and leverage positive impacts. An area of focus in transportation has been in managing the risk of project cost and schedule overruns; a number of agencies have established enterprise risk management programs in order to address risk and uncertainty across their organizations. Likewise in TAM, there is increased interest in identifying and assessing risk so as to comply with both the best practices and the FHWA requirement for state DOTs to consider risk in developing their NHS TAMP.
The word ‘risk’ can be very context specific, meaning very different things depending on the industry and application. For instance, a financial analyst is primarily concerned with uncertainty in financial returns and the risk of incurring a significant financial loss. In the nuclear power industry, however, the focus of managing risk is on minimizing the potential for catastrophic loss that might occur from damage to a nuclear facility. As discussed in Chapter 2, in this guide risk is defined as the “effect of uncertainty on objectives” consistent with the ISO definition. This definition captures the full range of applications of risk management, and acknowledges the possibility for both positive and negative consequences of uncertainty.
The term ‘risk management’ is used to capture the set of business processes associated with identifying and managing uncertainty and risk. The overall risk management process is described in Chapter 2. The remainder of this section describes how this process relates to resource allocation.
Implications for Resource Allocation
While the scope of risk management may be very broad, an organization’s approach to risk management and the outcomes resulting from a risk assessment may nonetheless have important implications for TAM resource allocation. Consequently, it is important to establish a risk management approach and integrate consideration of risk with the resource allocation process.
TIP
Multi-objective decision making is a concept in operations research that is implemented in several different forms, from simple consensus-building approaches (e.g. Delphi processes) to more complex software tools. In all cases, it allows consideration of more than one factor or criteria in making a decision.
Specific possible implications of risk management on resource allocation may include, but are not limited to:
- An organization may identify through its risk management approach areas where better data or improved processes are needed to best address a given risk, in turn impacting the resource allocation process. For instance, if uncertainty concerning future asset conditions is found to be a significant risk, this may result in efforts to improve the deterioration models in an agency’s asset management systems and/or motivate data collection improvements to reduce uncertainty.
- An organization may identify specific investments of staff time and/or agency funds required to mitigate negative or leverage positive risk. Once specific investments are identified, they can be assessed along with investments in other asset/investment categories. For example, Caltrans defined a separate program for seismic retrofits as described in the Practice Example.
- If an agency’s allocation of resources hinges on uncertain future values for one or more parameters, it may be necessary to incorporate consideration of uncertainty formally in the decision-making process. This can be accomplished using Monte Carlo simulation or other quantitative approaches to establish the predicted distribution of outcomes. For instance, in performing a life cycle cost analysis to select between project alternatives for a given facility, Monte Carlo simulation can calculate the range of life cycle costs predicted depending on future values for cost escalation, deterioration, or other parameters.
- In approaching formal accounting for uncertainty, an organization may define different scenarios representing the possible range of outcomes and then determine how best to allocate resources in each scenario before establishing a preferred resource allocation approach. For example, if an agency’s future capital budget is unknown, a decision-maker may wish to define a high, medium and low budget scenario and determine what investments would be made in each scenario in order to most effectively prioritize given uncertainty. Likewise, a scenario analysis approach can be useful in assessing how to allocate resources for improving infrastructure resilience given uncertainty concerning future sea level rise. Typically, the decision maker will review results for different scenarios and make a subjective determination of how to allocate resources considering the relevant factors. The Practice Example describing the analysis of harbor-wide barrier systems for the City of Boston shows one such approach. Recent research in the area of Robust Decision Making (RDM) has focused on developing quantitative approaches to select optimal investments between different scenarios.
Caltrans
Caltrans initiated its Seismic Safety Retrofit Program in the wake of bridge failures experienced in the 1989 Loma Prieta Earthquake. Through this program Caltrans evaluated the retrofit needs for all of the over 12,400 bridges on the State Highway System (SHS). Retrofit needs were prioritized using a multi-attribute procedure that calculated a score for each bridge considering the likelihood of an earthquake at the bridge site, the vulnerability of the bridge to collapse in the event of an earthquake, and the impact of a collapse considering the traffic using the bridge and detour distance in the event of a collapse. Through 2014 the program resulted in retrofit of 2,202 state highway bridges at a cost of over $12.2 billion.
Sources:
2018 Caltrans TAMP
Practical Lessons from the Loma Prieta Earthquake (1994), p. 174-180 https://www.nap.edu/catalog/2269/ practical-lessons-from-the-loma-prieta-earthquake
University of Massachusetts
The Sustainable Solutions Lab at the University of Massachusetts Boston used a scenario-based approach to analyze the feasibility and potential risk reduction of Boston Harbor barrier systems to protect the Boston area from future flooding due to sea level rise. The report included an economic analysis in which costs and benefits were predicted for 32 scenarios considering:
- Two barrier system alternatives
- Two construction time scenarios
- Two scenarios for effectiveness of “shore-based solutions”
- Low and high construction cost estimates
- Discount rates of 3% and 7%
The analysis indicated that the benefits of the proposed barrier system would exceed their cost for both systems evaluated, but only in the case that one assumed a low discount rate, accelerated construction schedule, and failure of other shore-based solutions for mitigating sea level rise. Also, the analysis indicated that beyond a certain point sea level rise would be such that a barrier system would no longer prove effective (since the barrier would have to be closed at all times rather than only during flood events). The report further predicted costs and benefits for two alternative scenarios involving incremental adoption of a variety of shore-based mitigation approaches, and recommended an initial focus on shore-based adaptation as the most promising strategy for the City of Boston to address sea level rise.
Regional Municipality of Peel
The Region of Peel is the second largest municipality in Ontario, just west of Toronto and supports two cities and a town. Peel assesses needs and priorities across a diverse portfolio of Infrastructure that supports a variety of programs and services including an arterial roads network, solid waste management, water and wastewater treatment distribution and a variety of social, health and emergency services. The Region integrated a number of inputs to enable an optimized investment methodology including a Risk Management, Level of Service, and Life cycle Management Strategies and prioritize needs across diverse infrastructure, as illustrated in the figure. The integration of these three strategies was possible through three enablers and working with all of the programs and services to model their infrastructure:
- Establishing a consistent approach to quantifying risk – The Region evaluates the degree of risk that is currently being accepted associated with delivering service levels. Inherent risk (similar to asset criticality) and residual risk (the Region’s risk objective) are established and the current level of risk that an asset presents to service delivery is also determined. The gap between current and residual risk represents the unmet funding and asset needs.
- Establishing a normalized method to determine current level of service to assist the cross-asset funding allocation task. The adopted normalized indicator was determined to be: LOS=% of Assets Meeting LOS + (% of Assets Not meeting LOS x Average Condition of Assets not meeting).
- Adopting a direct relationship between LOS and risk that allows for an analysis of alternative investment scenarios, and modeling techniques to optimize investment allocation. It also allows annual infrastructure evaluation based on the most current condition information and annual Asset Management Reporting.
Peel’s risk-based approach to asset management is integrated with the Region’s Strategic Plan and the Long-Term Financial Planning Strategy, and supports the desired service outcomes by evaluating risk against the Council approved asset levels of service. This approach provides senior decision-makers an objective way to consider resource allocation alternatives and communicate in a common language when evaluating between service areas and different asset portfolios.
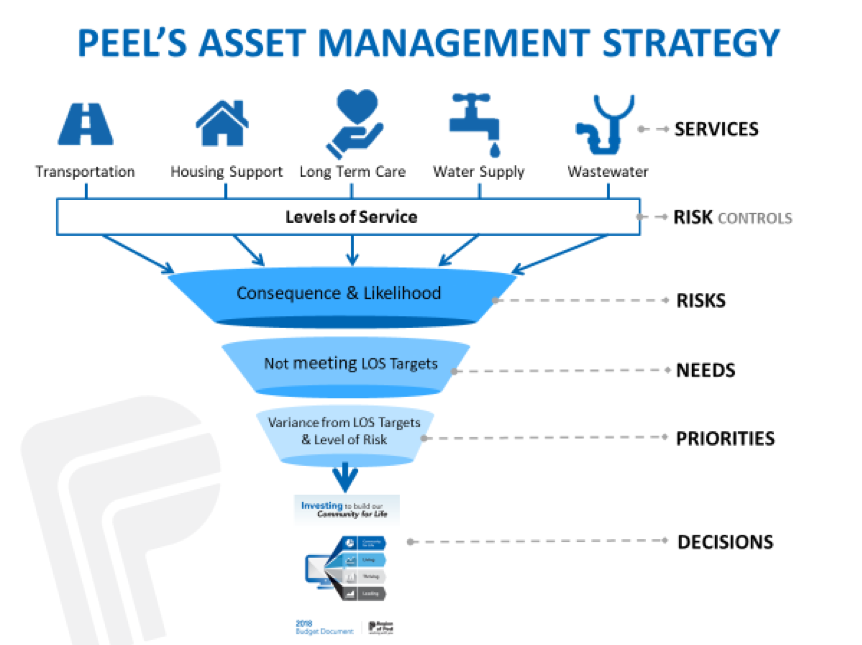
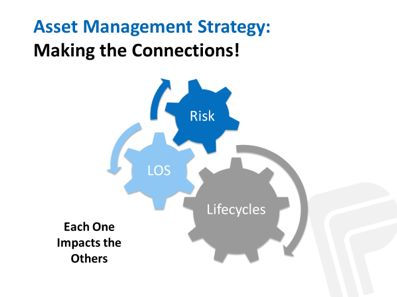
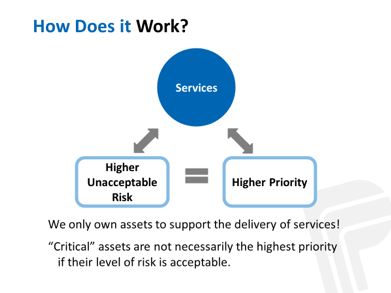
Peel Enterprise Asset Management Plan. 2019. http://www.peelregion.ca/council/agendas/2016/2016-04-07-arc-agenda.pdf. http://www.peelregion.ca/finance/_media/2019-enterprise-asset-management-plan.pdf
Challenges in Cross-Asset Resource Allocation
Resource allocation decisions considering multiple objectives are difficult due to a variety of factors. Competing objectives, data limitations, and uncertainty complicate the resource allocation process.
In determining what work to perform across all assets, an agency is faced with the basic problem of multi-objective, cross-asset decision-making. Typically an agency must, either implicitly or explicitly, determine how to divide scarce resources between different asset types, and in so doing try to accomplish a variety of different objectives.
The basic process described in Section 5.1 is applicable whether the resource allocation process concerns a single asset or multiple assets. However, there are extra challenges inherent when dividing resources among multiple types of assets or types of investments. Making resource allocation decisions considering multiple objectives is made more difficult by a variety of challenges, including but not limited to:
Competing Objectives. Fundamentally, a transportation agency seeks to improve mobility while maximizing the safety of the transportation system, minimizing negative impacts to the environment and society, and making best use of limited funds and other resources. It is difficult to quantify these as well as other competing objectives and often hard to reach consensus on what achievements should be prioritized when determining how an agency measures the progress of different areas to support a decision.
Data Limitations. A structured approach to resource allocation requires data. Ideally, an agency has detailed, quantitative data on existing conditions, the scope of a proposed investment, and what the effects of an investment are likely to be. However, obtaining data and projecting future conditions can be costly, and the decision to proceed with an investment must sometimes be made before detailed data is available. Often it is necessary to use qualitative data or estimates in lieu of quantitative data.
Uncertainty. Transportation investments are intended to make improvements in the future, but there is always uncertainty concerning future asset and system conditions as well as how assets will perform and what external risks may impact the system.
Structuring the resource allocation process to address multiple types of assets or investments requires particular focus on two of the steps illustrated in Figure 5-1: Step 3 - Quantify Targets and Step 5 – Prioritize Investments. Different approaches to cross-asset resource allocation tend to focus on one or the other of these steps.
For instance, a process focused on defining targets is premised on the fact that most asset management systems model different asset classes separately, using different deterioration models, treatment rules and benefit calculations. Different systems and approaches are also used to analyze different types of investments. It is possible to perform separate analyses for each asset or investment type that consider what results will be obtained depending on the overall investment level or other variations in resource allocation. Decision makers can then review the results of the different analyses to determine how to allocate resources at a high level. Once an overall allocation is established, different approaches can be used for prioritizing investments by asset or investment type.
In contrast, with a process emphasizing prioritization, the focus is on identifying and prioritizing specific candidate investments. The prioritization approach helps determine which investment is most desirable considering the organization’s goals and objectives, and the predicted outcomes of the investment. In this case it is not necessary to perform asset-specific analyses, and it is possible to define projects that address multiple types of assets and investments that cut across predefined types. For example, a corridor project could include work on existing pavement and bridges, as well as intersection improvements that improve safety and mobility. However, an organization implementing a cross-asset prioritization approach must consider how to quantify its different goals and objectives, and explicitly weigh progress in one area versus another.
In practice, most agencies use an approach that involves both setting performance targets and prioritizing specific investments. The following subsections provide additional details on use of performance targets and multi-objective approaches, and provide examples illustrating emphasis on each of these areas.
Use of Performance Targets to Support Cross-Asset Resource Allocation
A basic approach allocating resources across multiple types of assets is to define a set of performance targets by asset type. Development of TAM performance targets should be supported by data and the life cycle management approach described in Chapter 4. A resource allocation process that includes multiple types of investments, such as safety and mobility, may incorporate other targets, as well.
Target-setting is the process of setting specific values that an organization expects to achieve for a set of performance measures. Target-setting is important within the broader area of performance management, introduced in Chapter 2. Setting performance targets is consistent with best practice in asset and performance management. In its Transportation Performance Management (TPM) Toolbox, FHWA describes the benefits of setting performance targets:
- Driving a conversation about current conditions and how to achieve future outcomes
- Creating a method for evaluating processes currently in place, particularly data quality and measurement definitions used by the agency
- Guiding the prioritization and allocation of resources
- Enabling assessment of strategy effectiveness by focusing on linking goals, objectives, and measures to policy and investment decisions
- Forming a powerful argument for additional or alternative investments
- Managing expectations by clarifying what outcomes are desired
It is important to note that an organization may set targets at a strategic, tactical or operational level to support different applications:
- A strategic target is one which an organization expects to meet at some future time and reflects the agency’s overall goals and objectives. For instance, an agency’s long-term target for overall pavement condition is an example of a strategic target.
- A tactical target is a value an organization needs to meet to help support its strategic targets. For instance, to support a high-level target for pavement condition, an agency might set a tactical target to perform a specific amount of repaving work per year in each district.
- An operational target is one that helps track the day-to-day performance of an organization, such as the average time to respond to an incident. Operational targets are often used to support continuous improvement in standard operating procedures and process improvement tracking and monitoring.
The TPM regulations initiated by MAP-21 have specific requirements for state DOTs and MPOs to set performance targets for NHS pavement and bridge conditions, as well as for other areas outside of TAM, such as mobility and safety. In these regulations, a target is defined as the value for a performance measure the agency expects to achieve given available funding, rather than a desired or aspirational value. The benefits of target-setting are equally applicable regardless of whether an agency is setting targets specifically to comply with FHWA requirements or for other purposes.
There is a strong tie between target-setting and resource allocation. A target can both inform what investments an agency needs to make and help communicate the expected results of an investment strategy.
When an agency sets strategic targets to support allocating resources, the process is typically iterative. For instance, an agency might first determine the desired level of performance that best supports its goals and objectives, such as the overall performance that would result from maintaining all assets in good repair or the desired level of service for a set of assets. It would then be necessary to determine the level of investment (or allocation of other scarce resources) required to support this level of performance. At least one—and potentially many—iterations are required for an agency to determine a target performance that is not only consistent with its goals and objectives but also attainable given available resources. At each step, it can be helpful to use predicted performance given a certain allocation of resources to help communicate investment trade-offs and guide decision making.
Once an agency sets its strategic targets, it can then set tactical and operational targets. Developing and tracking such targets allows for better assessment of the actions to be performed at different levels of the organization to support strategic targets, and whether the agency is on track to meet its strategic targets – also termed “line-of-sight integration of decision making.”
Key points in setting performance targets to support TAM resource allocation include:
- Targets should be consistent with agency goals and objectives. Absent a specific constraint on resources, an organization should allocate resources as required to support its goals and objectives. For investments in existing assets, this should follow the life cycle plans developed as described in Chapter 4. If resources are constrained, it may be necessary to revise the life cycle strategy followed for one or more asset classes to focus investment on specific areas, although this may result in higher costs or worse performance in other areas over time.
- Use management systems to support target development. Pavement, bridge, and other asset management systems provide robust tools for summarizing current conditions and predicting future conditions and performance. In setting performance targets, it is important an agency use the analytical capabilities these systems offer in order to develop targets supported by data using a documented, repeatable process. Management systems are useful tools to help the decision-making process, but should support the process, not define it. Establish the allocation process the agency wants, and find tools that help implement it.
- An agency may have different targets for different subsets of a network. Particularly with strategic targets set at a network level, it will generally be the case for some subsets of the network or different geographic areas that performance will exceed the overall target, while others will lag behind the target.
- Factors not considered in management systems can impact performance. While management systems can help determine realistic targets, a decision maker should note the simplifying assumptions these systems make and thus remain aware of additional factors that may impact performance. For instance, management systems typically assume treatment on an asset can be performed in a single decision period, and the resulting impact on performance is immediately observed. In reality, projects often require multiple years to complete and there may be significant lag between when funds are committed and a resulting change in performance is observed. Factors outside the scope of management systems may also impact performance, such as diversions for emergency events or variability in condition assessment data and deterioration rates.
TIP
In many ways, resource allocation is the culmination of other TAM processes. These next pages describe how outputs from other processes should inform resource allocation for data-driven decision making.
Colorado DOT
The budget-setting process used by CDOT and described in its 2018 TAMP is an example of a resource allocation process emphasizing use of performance targets to support cross-asset resource allocation. CDOT organizes its asset inventory into 11 different asset classes. Different management systems and approaches are used for each asset class to calculate current conditions and predict future performance given a specified budget and other data. The figure illustrates the asset classes and systems used to support analysis of each asset class as of 2018.
The measures used summarize conditions that vary by asset class. For instance, for pavement CDOT predicts percent of pavement with high, moderate, and low drivability life. For bridges, CDOT predicts percent of bridges in good/fair/poor condition based on the FHWA bridge condition measure. For maintenance and buildings CDOT predicts a level of service on a letter grade (A to F) scale.
On an annual basis CDOT performs a separate analysis for each asset class of existing conditions and predicted conditions for different budget scenarios. The manager for each asset class then presents a budget request and business case for the asset class in a workshop setting. Workshop participants, including the asset class managers and representatives from each CDOT region, then vote on the allocation of budget by asset class. The allocation serves as a recommendation to CDOT’s Transportation Commission, which is charged with adopting CDOT’s budget. Separate processes are used in each asset area to prioritize work once the budget is established.
Sources:
TAM Peer Exchange Presentation
CDOT Asset Classes and Analysis Systems
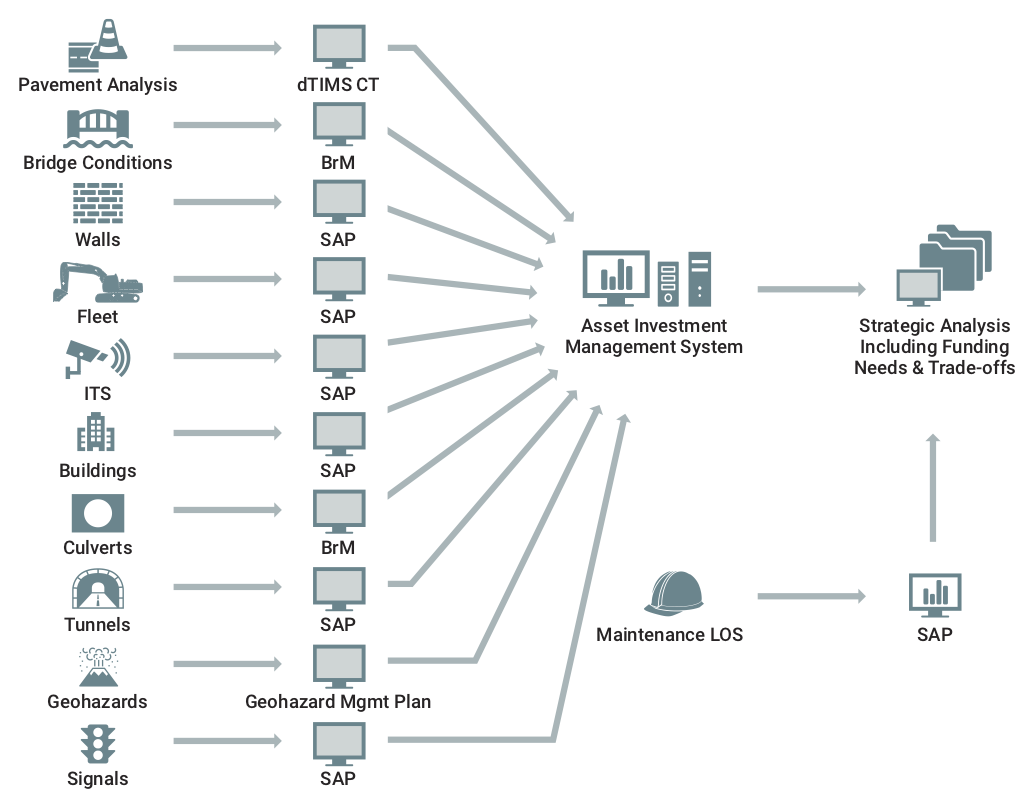
Source: William Johnson, 2018 FHWA TAM Peer Exchange
Use of Multi-Objective Decision Analysis for Resource Allocation
Multi-Objective Decision Analysis (MODA) can be used to prioritize specific candidate investments considering multiple, potentially competing objectives. Though this approach is data-intensive, it provides the means for evaluating investments that combine multiple types of assets or investments that help achieve multiple objectives.
In recent years, interest has increased in using MODA to improve approaches for prioritizing investments across asset classes and investment categories. The basic benefit of this approach is that it provides a structure for prioritizing investments outside the scope of any one management system, such as projects combining pavement, bridge and safety improvements. It also provides a means to compare asset management investments with other investments to improve mobility and achieve other objectives outside the scope of a typical asset management system.
This approach is, however, more data intensive and may result in simplification of the asset-specific modeling performed in a pavement or bridge management system. MODA tools and approaches are typically intended for application in analyzing specific candidate projects, and used for prioritizing investments for a single decision period. However, it is possible to adapt a MODA approach for cases where data are sparse or where groups of investments are analyzed rather than specific investments, or where longer decision periods are considered.
NCHRP Report 806: Guide to Cross Asset Resource Allocation and the Impact on Transportation System Performance presents a framework and prototype tool for implementing a MODA-based approach. Additional research through NCHRP Project 08-103 extended the framework and updated the tool. A checklist based on this work is included in this section; it outlines key issues for an agency considering improvements to its resource allocation approach to better account for multiple objectives across asset classes or investment categories.
North Carolina DOT
Since 2009, North Carolina DOT has used a structured approach to help prioritize capital investments across modes and asset classes. The initial version of the approach (Version 1.0) focused on prioritizing mobility and highway modernization projects supported by data on congestion, crashes and pavement condition. Over time the process evolved to include additional investment types and data. North Carolina’s Strategic Transportation Investments Law adopted in 2013 helped formalize the process, requiring that NCDOT allocate 40% of its available funds for mobility to Statewide Mobility projects that address congestion and bottlenecks, 30% of funds to projects with Regional Impact that improve connectivity within Regions, and 30% of funds to projects that address local needs. Different approaches are used for prioritizing investments in each mode (highways, aviation, bicycle-pedestrian, public transportation, ferry and rail) within each of these three groups. In Version 5.0 of the process, implemented in 2018, 24 different types of improvements are considered for highways. Candidate projects are scored in 10 areas, including pavement condition, considering a mix of existing conditions and predicted conditions as a result of the proposed project, as illustrated in the figure.
Highway Scoring - Eligible Criteria with P5.0 Measures
| Criteria | Measure | Existing Conditions | Project Benefits (Future Conditions) |
| Congestion | Volume/Capacity + Volume | ||
| Benefit/Cost | (Travel Time Savings + Safety Benefits)/Cost to NCDOT | ||
| Safety/Score | Critical Crash Rate, Density, Severity, Safety Benefits | ||
| Economic Competitiveness | % Change in Jobs + % Change in County Economy | ||
| Accessibility/Connectivity | County Economic Indicator, Improve Mobility | ||
| Freight | Truck Volume, Truck %, Future Interstate Completion | ||
| Multimodal | Multimodal Benefits | ||
| Lane Width | Existing Width vs. Standard Width | ||
| Shoulder Width | Existing Width vs. Standard Width | ||
| Pavement Score | Pavement Condition Rating |
Source: NCDOT. 2019. https://connect.ncdot.gov/projects/planning/MPORPODocuments/P5.0%20Master%20Presentation%20-%20July%202018.pdf
Caltrans
The approach for allocating funding within the Caltrans State Highway Operation and Protection Program (SHOPP) is an example of a “bottom-up” multi-objective, cross-asset resource allocation approach. The SHOPP funds repair, preservation, and safety improvements on the California State Highway System (SHS). The SHS is comprised of approximately 50,000 lane miles and the 2018 SHOPP will implement $17.96 billion in projects over four years. The SHOPP programming cycle results in a four-year program of capital projects that achieve the performance targets specified in the TAMP, consider the fiscal constraints, and address the needs identified in the State Highway System Management Plan.
In an effort to make the process more data-driven, Caltrans piloted a MODA approach to prioritize projects for inclusion in the SHOPP. The agency used the goal areas identified in their Strategic Plan (Safety and Health; Stewardship and Efficiency; Sustainability, Livability, and Economy; System Performance; and Organizational Excellence) and established criteria to evaluate projects across the five goals. In the initial pilot, Caltrans focused on obtaining the technical data necessary to evaluate how well each project progressed towards its goals. The agency is in the process of refining the approach based on the results of the pilot. They revised the goal areas to best account for all the activities included in the project. In addition, they represent each project score through a monetized benefit value, which addresses challenges related to scaling and weighting. With the revised approach, projects are scored based on the annual benefit of performing the project relative to deferring work for one decision period (two years). Benefits predicted using the approach are analogous to monetized benefits predicted using benefit/cost analysis tools and approaches, such as the Cal-B/C tool Caltrans uses to evaluate potential highway improvements. This approach leverages prior work performed to quantify the benefits of a proposed investment, and helps address issues with scaling and weighting different measures of benefit encountered in the initial pilot.
Sources:
TAM Peer Exchange Presentation
2018 SHOPP http://www.dot.ca.gov/hq/transprog/SHOPP/2018_shopp/2018-shopp-adopted-by-ctc.pdf
NCHRP 08-103, Preliminary Draft Final Report
TAM Financial Plan
A financial plan describes the sources of an organization’s funds and how funds will be used over time. Fundamentally, an organization prepares financial plans because it is good business practice and because doing so is required to comply with various state and federal requirements and accounting standards.
MPOs are required to prepare financial plans as part of LRTP and TIP development. DOTs also have to prepare financial plans for their NHS TAMPs. The federal requirements help guide practice in many agencies. However, there are often additional state-level requirements for financial planning and reporting that may impact the preparation of financial plans.
The financial plan prepared for an MPO LRTP requires system-level estimation of costs and revenue sources with reasonably expected availability to adequately operate and maintain the federal-aid highways included in the plan. LRTPs have a planning horizon of 20 years or more, but beyond the first 10 years of the plan the costs may be specified using aggregate cost ranges. MPOs, transit operators and states are required to work together to develop the financial plan. Requirements for LRTP financial plans are listed in 23 CFR 450.324 (f)(11).
The financial plan for a MPO TIP serves a similar purpose as for an LRTP: to show that funding is reasonably expected to be available for projects within the plan. Funds must be estimated by year for over a period of at least four years. A TIP financial plan does not need to include funding for other activities outside of the projects included, but should include some form of system-level estimation of costs of operating and maintaining federal-aid highways, as well as confirmation that sufficient funds are available for implementing, operating and maintaining the system. As in the case of LRTP financial plans, MPOs, transit operators and states are required to work together to develop the plan. Requirements for TIP financial plans are listed in 23 CFR 450.326 (j).
For SLRTP and STIPs, the elements of a financial plan are similar to those for LRTPs and TIPs, respectively. However, the financial plan for these documents is an optional element. SLRTP requirements are described in 23 CFR 450.216 and STIP requirements are described in 23 CFR 450.218.
Separate requirements specify the contents of a financial plan prepared for a State’s NHS TAMP. 23 CFR 515 specifies that a TAMP financial plan is a “long-term plan spanning 10 years or longer, presenting a State DOT’s estimates of projected available financial resources and predicted expenditures in major asset categories...”
Regulations further stipulate that the process for preparing a financial plan must include:
- Estimating the cost of expected future work to implement the investment strategies in the TAMP by fiscal year and work type
- Estimating funding levels that are expected to be reasonably available by fiscal year
- Identifying anticipated funding sources
- Estimating the value of the agency’s NHS pavement and bridge assets
- Estimating the needed investment on an annual basis to maintain asset value
TIP
Risk can be incorporated into resource allocation informally (as general considerations) or more formally (e.g. through the life cycle management process or as a criteria in a multi-objective decision making process).
In addition to preparing financial plans in the documents described above, state DOTs and other organizations typically prepare annual financial statements. The U.S. Governmental Accounting Standards Board (GASB) establishes standards for state and local governments to use in following Generally Accepted Accounting Principles (GAAP). These standards describe how governments should perform their accounting and prepare financial statements. A financial statement prepared based on GAAP describes an organization’s financial position for a given reporting period, such as a fiscal year, and typically does not include detailed projections of future funding and work. A financial statement prepared to comply with GASB standards and a financial plan prepared to support an LRTP, TIP or TAMP are meant to serve different purposes, but the same underlying concepts inform the development of all these products.
Financial statements and Federally-compliant NHS TAMPs both include calculations of asset value. Reporting asset value in a TAM financial plan helps communicate what assets an organization manages in a common unit applicable to all assets: dollars. Estimates of asset value in a TAM financial plan are typically based on asset replacement cost. The value of an asset may be depreciated on remaining asset life or current asset condition. Where a depreciated asset value is calculated the cost to maintain asset value is equal to annual depreciation. This can provide a useful benchmark for the minimum spending required to maintain an inventory of assets.
The asset value reported in a financial statement is prepared in compliance with GASB requirements, and is often prepared differently than that in a TAMP. For financial statements agencies typically apply straight-line depreciation to historic capital costs to estimate the current book value of their assets. The historic cost of constructing an asset is different from the cost to replace an asset in today’s dollars, and the annual depreciation calculated using this approach is different from the cost of actually maintaining asset condition. GASB requirements allow for addressing this issue using a “modified approach” for calculating asset value. This alternative approach involves calculating a cost to maintain assets using an organization’s management systems in lieu of calculating straight-line depreciation. Where this approach is used it provides a calculation of asset value that can be used in both a TAM financial plan and an organization’s GASB-compliant financial statement.
Implications for Resource Allocation
In determining how to allocate financial resources, a decision-maker needs information on available funds. The output of the resource allocation process is an allocation of funds or other resources needed for the financial plan. Thus, financial planning both informs the resource allocation process and uses its results.
Development of a financial plan is separate from, but closely related to, the resource allocation process. Thus, there must be a high level of coordination between financial planning and resource allocation, particularly with respect to TIP and TAMP financial plans.
Although different financial plans are required for different applications, for practical purposes an organization should use consistent assumptions in developing its financial and strategic plans to the fullest extent possible, including the plans described above and other related documents.
Areas where integrated approaches and assumptions between different planning documents are most beneficial are:
- Revenue projections. Ideally, a single office or group should take responsibility for projecting future revenues incorporating the organizations best estimates of revenue sources, demographic trends and other factors.
- Inflation assumptions. To predict how much it will cost to perform work in current dollars it is necessary to apply an appropriate inflation assumption. Predicting future inflation is challenging and results of the resource allocation process may be highly sensitive to the assumed inflation rate. Thus, it is important for an organization to make a consistent set of assumptions concerning inflation in its different financial plans. Often, the same unit responsible for revenue projections also predicts future inflation.
- Operating and maintenance costs (O&M). Costs of operating and maintaining existing assets may be components of the different federally-required plans, but they typically are not a focal point of the planned use of capital funds. From an asset management perspective, it is important to accurately predict these costs and include them as part of any financial plan.
While integrating approaches is highly desirable, the varying scopes and requirements for different financial plans and statements may lead to different results even when approaches are integrated. Financial planners should still carefully document and communicate any areas where different financial plans and statements appear to diverge.
Such instances can result from:
- Timing of plan preparation. A transportation agency’s financial situation may change from year-to-year or even day-to-day. A financial plan captures an agency’s best estimates at a given point in time, and it is not uncommon that the financial assumptions made for a given plan will be different when revisited for another plan at a later time.
- Different planning horizons. Long-range plans, TIPS and TAMPs all have different planning horizons. The length of the planning horizon can impact how numbers are presented in a plan and how they are communicated. For instance, the average annual O&M cost for the Federal-aid system, stated in current dollars, will be different over a 20-year period than over a 10- or 4- year period due to the effects of inflation and changing system conditions.
- Different contexts. Although using consistent assumptions and approaches between different financial plans and statements is desirable, in some cases the varying contexts and requirements demand the use of different approaches. An example of this issue is in asset valuation described in the previous section.
TIP
Although closely linked, financial planning should not be confused with resource allocation.
Minnesota DOT
MnDOT forecasts future funding in its annual Transportation Funds Forecast. This document projects funding by source for a four-year period. The report includes the funding projection, as well as additional details supporting the projections. For instance, it details trends in key parameters that impact funding, such as fuel consumption and vehicle sales. For these and other parameters the report shows historic trends, prior projections, and revised projection. The graph below, reproduced from the 2018 report, shows data for historic and predicted fuel consumption. The report also documents reasons for any changes in the projections, and risks that may impact future revenue. MnDOT uses its revenue projections to support development of the STIP, as well as to inform the funding projections in other reports, such as the TAMP and LRTP.
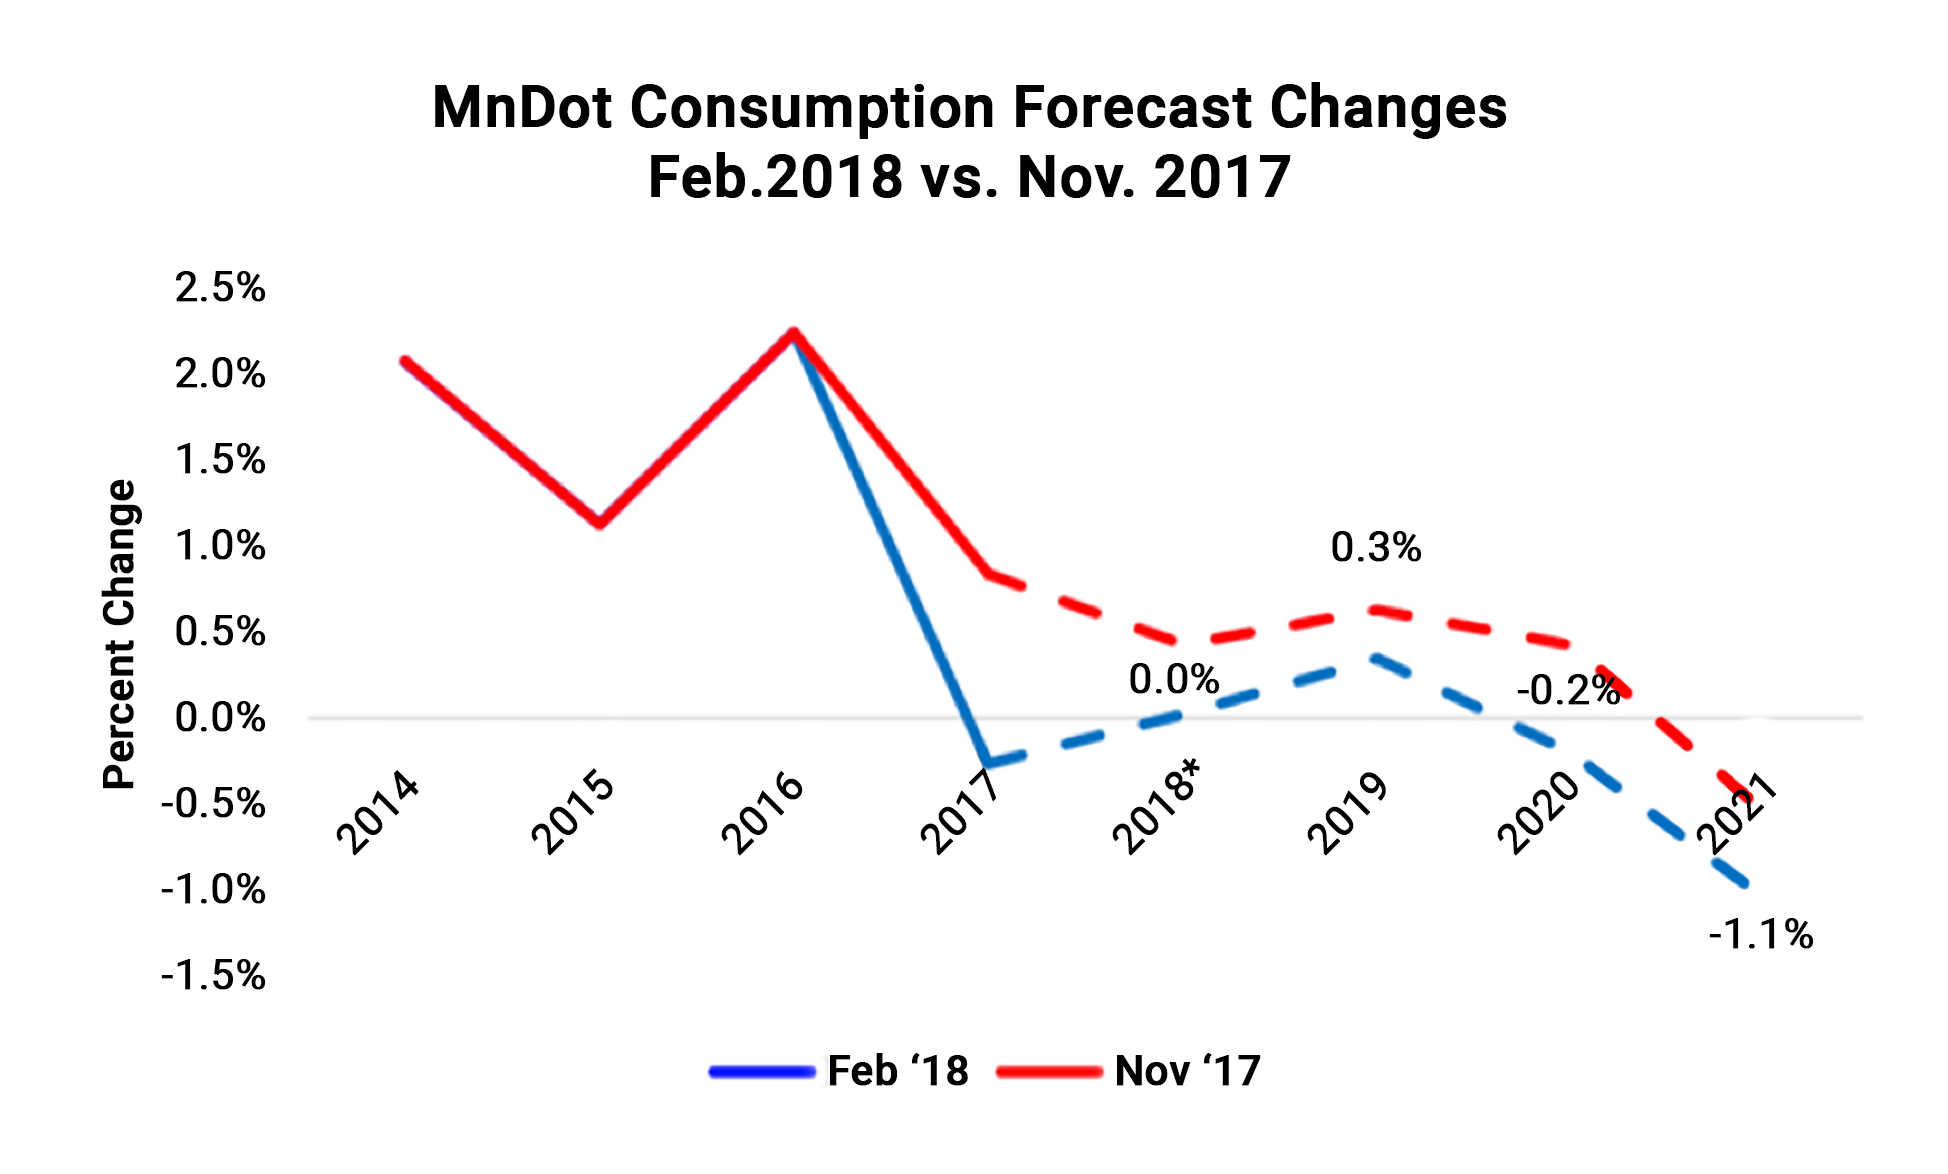
Source: MnDOT Transportation Fund Forecast. 2018. https://www.dot.state.mn.us/funding/documents/Transportation%20Forecast%20Feb%202018.pdf
City of Ottawa
The Province of Ontario was one of the first jurisdictions in Canada to pass legislation that required all municipalities within the province to prepare an asset management plan for all core municipal infrastructure. Municipalities have since been undertaking similar planning methods to all municipal infrastructure. Initial regulations required plans to have specific components including the Current State of the Infrastructure (a summary of replacement value, current condition, rate of depreciation and resulting residual value of the portfolio) as well as other components (Levels of Service, Asset Management Strategy, Financing Strategy and Improvement Plan). The State of Infrastructure reporting is a useful method to provide a snapshot of the current status of infrastructure and its ability to continue to deliver services. The City of Ottawa has been a leader in developing a comprehensive asset management program and making infrastructure investment based on a systematic approach. For example, State of the Infrastructure reporting is conducted for all asset types, and summarized in annual council reporting.
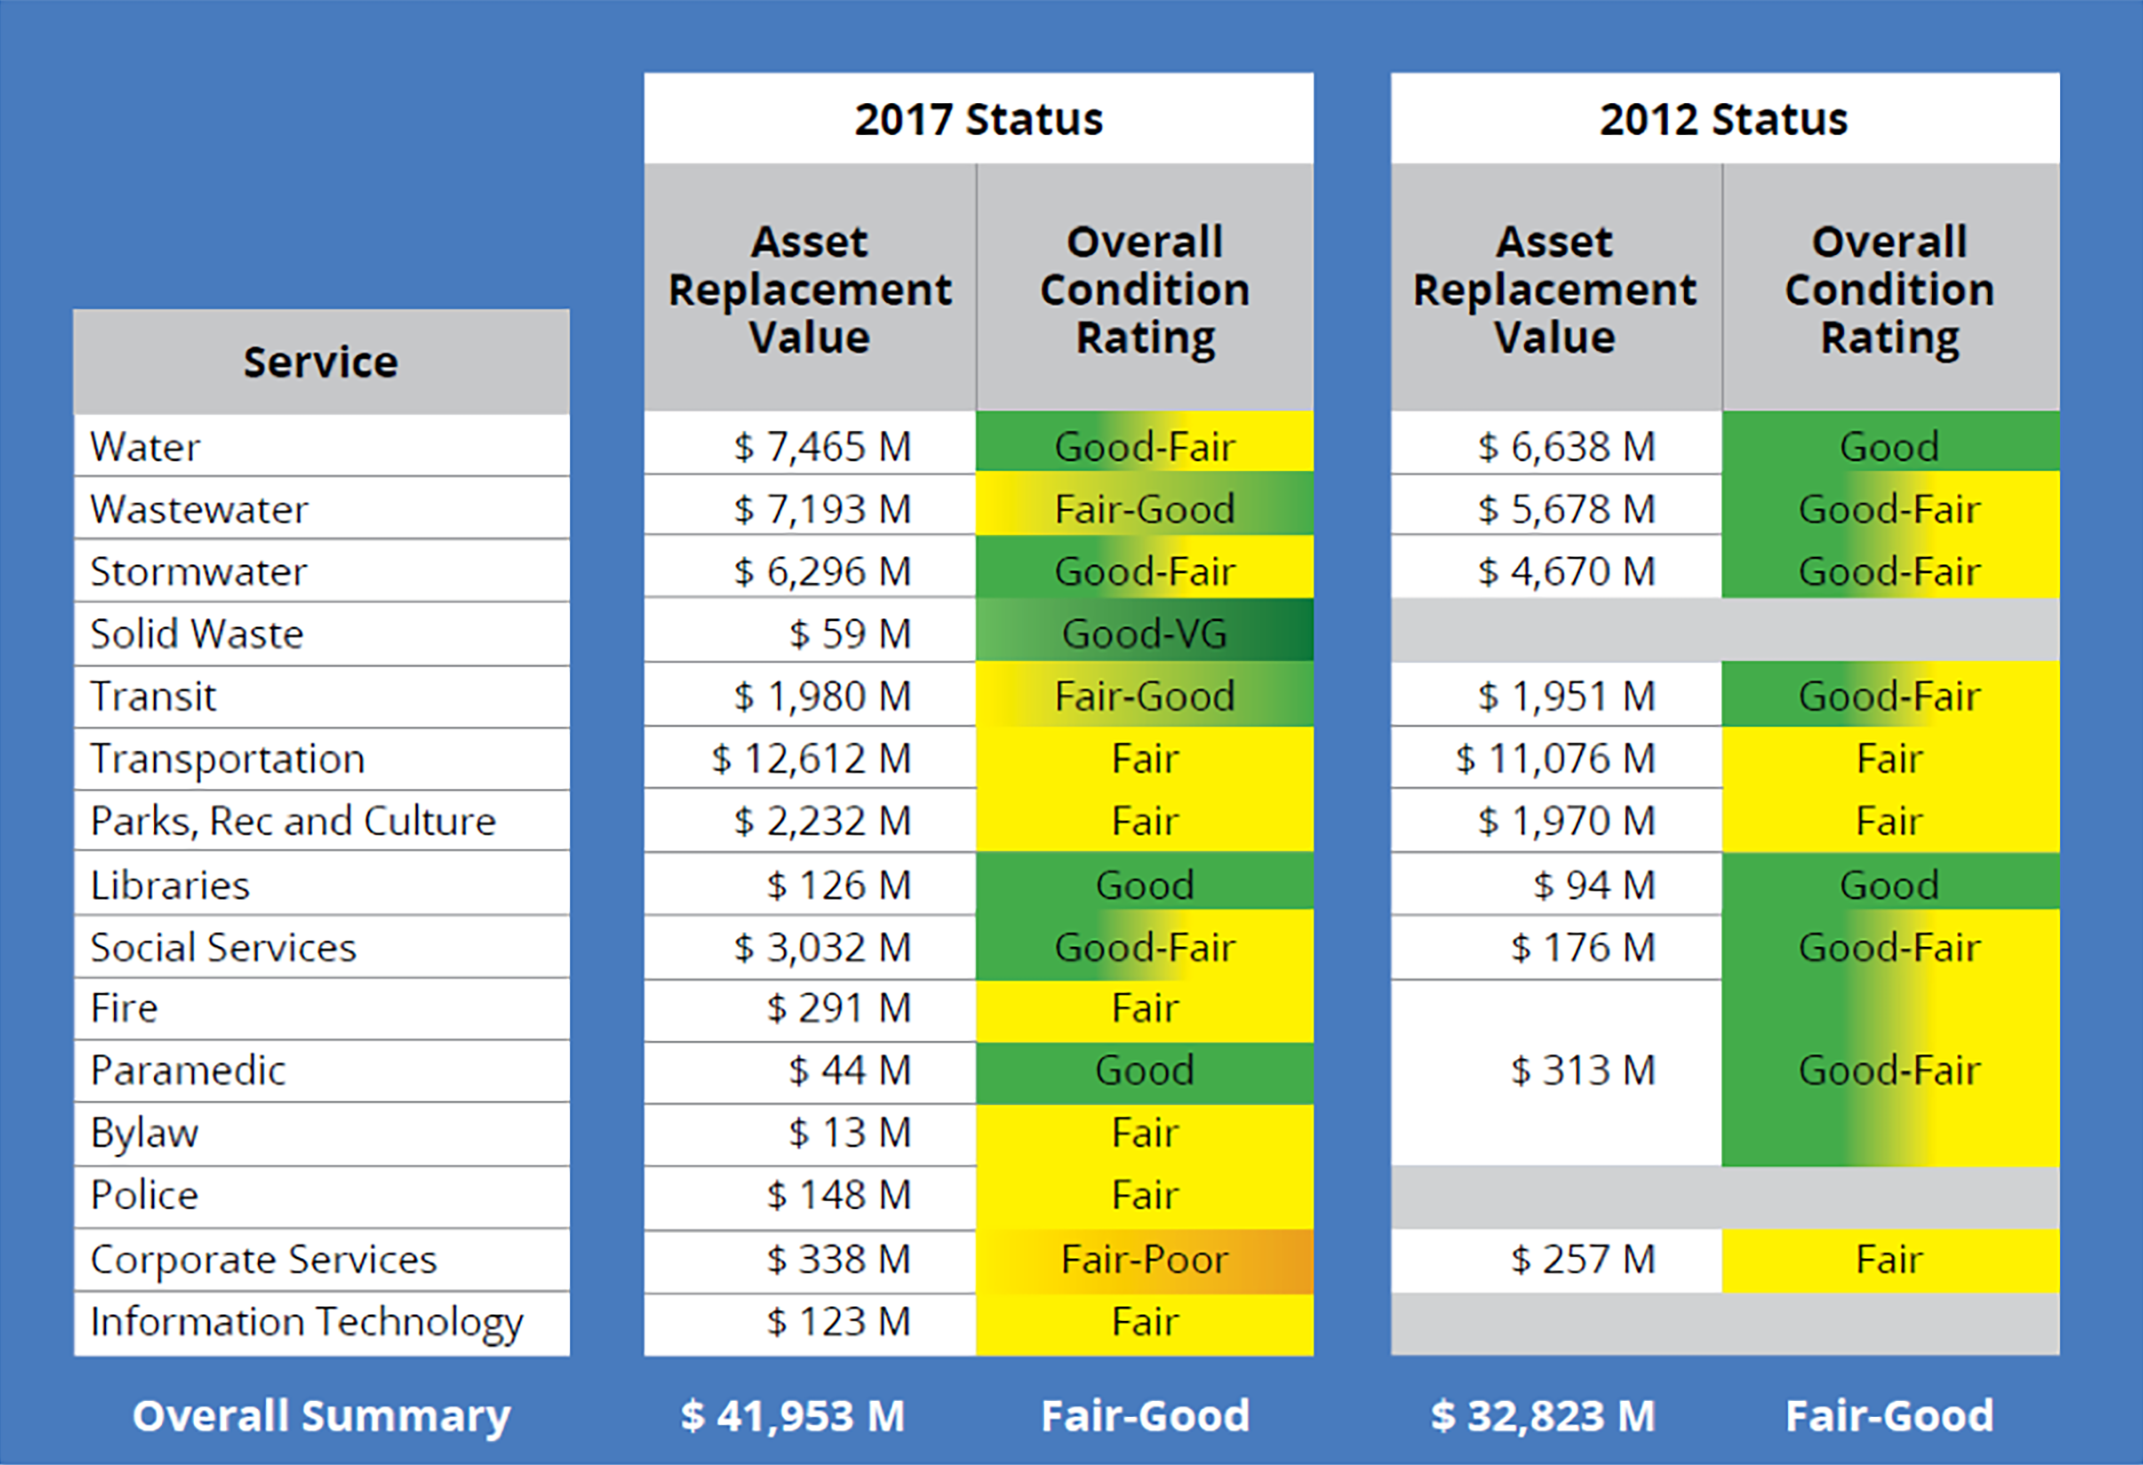
TAM Work Planning and Delivery
The approach used to deliver work can have a major impact on what investments an organization makes, the resources required to perform work, and work timing. Transportation agencies have many options for performing work, including using internal forces to perform work, and/or using a variety of different contracting approaches.
Typically, U.S. transportation agencies perform some or most of their maintenance work internally, and contract out a large portion – if not all – of their capital projects. The line between the types of work performed as maintenance and capital projects varies by organization and is often blurred. Agencies can often use maintenance forces in a flexible manner to perform a wide variety of activities, including preservation activities on pavements, bridges and other assets. However, in the near term, an organization’s maintenance resources – staff and equipment, in particular – are fixed. Consequently, the asset owner is challenged to optimize use of these resources to meet immediate needs, such as winter maintenance and incident response, while performing additional work to improve asset conditions wherever possible.
The ability to contract out maintenance work, such as through Indefinite Delivery/Indefinite Quantity (IDIQ) contracts, provides an agency with flexibility in meeting near-term needs. Other approaches for contracting out maintenance work include use of portfolio or program management contracts in which certain operations and maintenance responsibilities for some group of assets is delegated to a contractor over a specified period of time. Section 4.3.3 provides additional details on considerations involved in outsourcing asset maintenance.
Regarding contracting approaches for capital projects, in the U.S., most transportation agencies rely on Design-Bid-Build (DBB) model for delivering their capital programs. With this approach, the project owner designs a project (or contracts for a private sector firm to prepare a design) and solicits bids for project construction following completion of the design. This provides the project owner with control over the process, but can be time consuming and can result in cases where bids for project construction exceed the expected cost developed during design. In recent years, many transportation agencies in the U.S. and abroad have explored improved approaches to work planning and delivery to accelerate completion of needed work, leverage alternative financing approaches and transfer program and project risk.
All of these approaches are intended to reduce the time from initial conception of a project to its completion, and in many cases transfer risks associated with project completion from the public sector to the private sector. As these examples help illustrate, major trends in this area include:
- Group work together by geographic location or type of work to develop fewer, larger, and more easily contracted projects
- Use Design-Build (DB), Design-Build-Finance-Operate-Maintain (DBFOM) and other contracting strategies, wherein a single contract is awarded to design and complete a project, as opposed to separate contracts for design and construction
- Encourage development of Alternative Technical Concepts (ATCs), wherein a contractor proposes an alternative approach to meeting a contract requirement in the bidding phase
- Select contractors earlier in program/project development through use of Construction Manager-General Contractor (CM-GC) arrangements, where a contractor is selected as Construction Manager while design is still underway
- Use IDIQ contracts and other flexible contracts to provide a more efficient mechanism for performing smaller projects
- Incorporate performance-based specifications, time-based incentives and other specifications in contracts to improve project outcomes
- Outsource operations and maintenance of an asset using program or portfolio management contracts.
Both in the U.S. and abroad there are many examples of public agencies making extensive use of alternative contracting strategies, such as Public-Private Partnerships (P3s) and performance-based contracts to speed project delivery and transfer risk.
While alternate strategies for work planning and delivery hold great promise, all of the approaches described here have advantages and disadvantages and carry their own risks. Use of alternative approaches can save taxpayers money and provide improvements more quickly than a traditional model. Success stories typically result from improving the efficiency of the process and incentivizing the use of better technology and methods, but there are also many cautionary examples in which these strategies have failed to achieve cost savings, time savings or risk transfers as desired. Asset owners should consult the separate body of research in this area (referenced at the end of this section) when exploring the use of alternative approaches and carefully weigh the expected return, advantages and disadvantages of whatever delivery approaches they consider.
Implications for Resource Allocation
The different work delivery approaches that are available should be considered both at the outset of the resource allocation process, and as part of finalizing the resource allocation plan. Frequently it is necessary to consider multiple allocation scenarios using different delivery approaches.
The availability of alternative approaches for work delivery creates opportunities for organizations to improve asset conditions and address other needs in a more efficient manner, thereby performing needed work sooner, at a lower overall cost and/or with less risk to the organization. It is important to consider different work delivery strategies both early in the resource allocation process (as part of Step 2 – Determine Constraints) and at the end of the process (in Step 7 – Finalize Allocation and Plans).
Considering alternative delivery approaches early on as investment needs are identified helps identify options and determine approaches that an organization can use to achieve the best results. For instance, in determining how to allocate resources for asset maintenance an organization may wish to explore the potential for outsourcing additional maintenance work if there are specific constraints on staff or materials that could be relaxed using an alternative delivery approach. To properly assess the alternatives it may be necessary to define multiple scenarios, such as a scenario in which a “business as usual” approach is used for delivery, and a second scenario in which increased flexibility is assumed regarding use of different delivery methods.
Once an initial allocation of resources has been made, it is important to review options for delivery to revisit prior assumptions and identify opportunities to lower costs and improve outcomes. For instance, once overall budget levels have been established by asset and/or work type in a financial plan, an organization may need to revisit delivery options when scoping specific maintenance activities or capital projects.
The practice examples describe improved delivery approaches used in the U.S. and abroad, and discuss their impacts on resource allocation.
The Work Planning and Delivery checklist lists factors to consider during the resource allocation process for maintenance and capital projects to leverage opportunities for improved work planning and delivery.
Colorado DOT
In 2011 CDOT’s Innovative Contracting Advisory Committee (ICAC) began work to develop a structured approach for selecting the best delivery mechanism for a given transportation project. Through a set of workshops ICAC identified different factors that the agency should consider in selecting a delivery approach, including five primary factors (project complexity and innovation, delivery schedule, cost considerations, level of design, and risk assessment) and three secondary factors (staff experience and availability, level of oversight and control, and competition and contractor experience). ICAC then defined a three-stage approach for making the delivery decision. In Stage 1 CDOT identifies project goals, constraints and attributes. In Stage 2 CDOT assesses the primary factors, and in Stage 3 assesses the additional secondary factors. The approach is illustrated in the figure. As of 2018 CDOT has used the approach to assess 25 different projects, resulting in the selection of a mix of projects using DBB, DB and GM-GC.
Source: TR News 316 http://onlinepubs.trb.org/onlinepubs/trnews/trnews316.pdf)
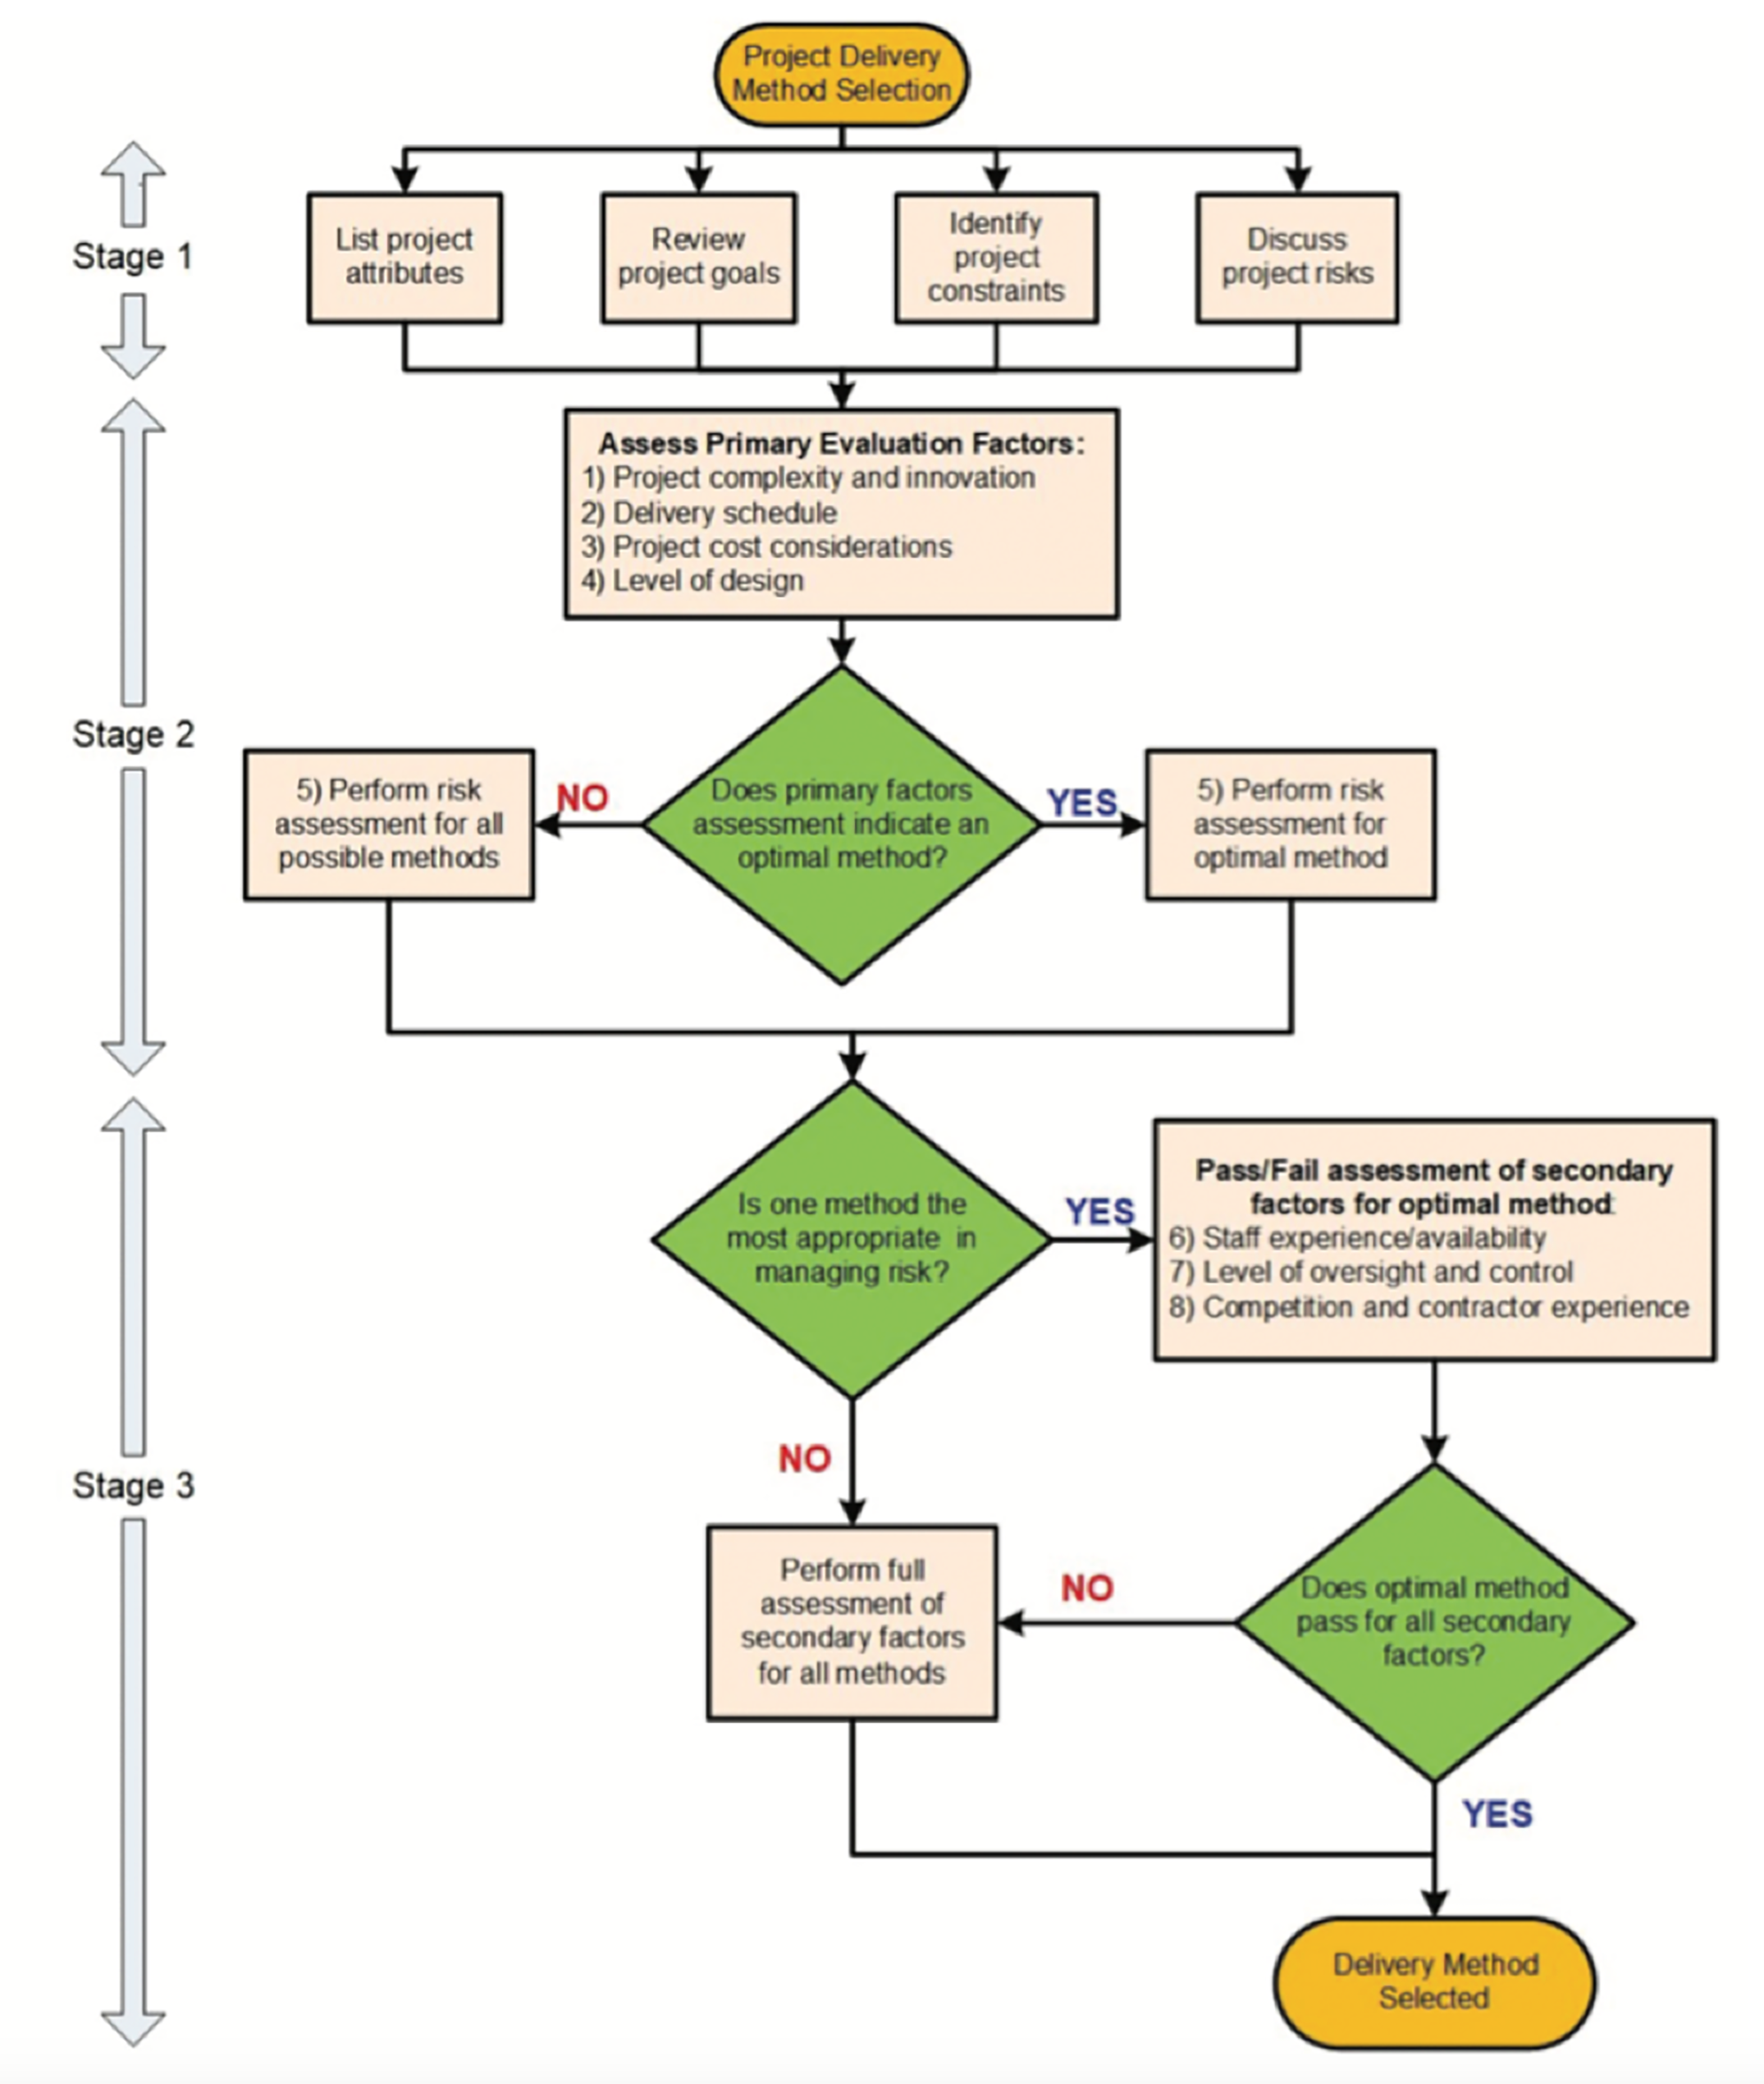
Western Australia
Main Roads Western Australia (MRWA) is responsible for Western Australia’s highway and main road network. MRWA represents one of the largest geographically spread road agencies in the world, covering an area of 1.55 million square miles. The agency is responsible for approximately 11,200 miles of Western Australia’s 93,000 mile network (12%) which carries 60% of the state’s traffic. MRWA has been a leader in trialing alternative procurement models to manage operations, maintenance and renewal on their road network.
Beginning in the mid 1990’s MRWA underwent major restructuring, and at that time shifted from performing highway asset management and maintenance activities using internal forces to outsourcing these activities through a set of 10-year contracts. As initial outsourced contracts came to an end, MRWA took the opportunity to capture lessons learned over the previous years and researched other national and international methods for delivery of maintenance activities. These investigations concluded that MRWA should pursue a new procurement strategy based on the use of Integrated Service Agreements (ISA). An ISA is a contracting arrangement in which the private sector and agency staff work together to deliver, in an integrated manner, a range of services including Operational Asset Management, Road Maintenance, Improvement Delivery and Network Operations. In essence the ISAs “in source” private sector partners to help deliver the range of integrated services that are core to the MRWA business. To do this the ISAs incorporate a performance specified outcome-based approach. The agreements integrated a number of services that were being delivered by a range of different methods and enabled MRWA to regain much more control and influence on when and how the services are delivered, particularly in regard to asset management decisions for maintenance. The shift to this contracting model was driven by:
- The need to rebuild capability and capacity within Main Roads and thereby assist Main Roads to remain an informed purchaser of asset management services. This was achieved by forming close, collaborative working relationships with industry where the best people and systems from each organization are used to deliver “needs based” asset management and “best for network” outcomes;
- The understanding gained from past models that risk needs to be appropriately allocated to the party best able to manage the risk; and the need for flexibility in the model to adapt to changes in network needs and broader Governance issues.
Post-ICA contract renewals further transitioned contract models to advance several agency objectives. These goals included centralizing strategic asset management work, retaining agency core capabilities, demonstrating value for money, continuous improvement and fit for purposes reporting framework and target setting. Recent contracts build in ICA learnings, and are a reflection of changing market factors and enhancing corporate capabilities.
Selecting and Using Performance Measures
This section discusses the importance of using performance data to make decisions. It highlights the role of performance measures and identifies how they are used to establish achievable performance targets. A more detailed discussion of Transportation Performance Management can be found in Chapter 2.
Performance Management Framework
As discussed in Chapter 2, transportation agencies have embraced the use of performance data to drive investment decisions. A performance-based management approach enables agencies to select and deliver the most effective set of projects for achieving strategic objectives, while also improving internal and external transparency and accountability.
A typical performance management framework includes:
- A clear idea of the agency’s strategic objectives.
- The use of performance measures to assess performance.
- Methods to evaluate and monitor performance results.
- The evaluation of factors with capacity to improve long-term performance.
- The allocation of funding to achieve agency objectives.
- Ongoing processes to monitor and report progress.
A fundamental component of the framework is the use of performance measures to evaluate system performance and the importance of establishing business processes to evaluate, monitor, and use the data to influence agency decisions. These are achieved by aligning decisions at all levels of the organization with the agency’s strategic objectives and ensuring that the right performance measures are being used to drive decisions. This alignment helps to ensure that resource allocation decisions and the day-to-day activities of agency personnel support the agency’s priorities and the interests of external stakeholders.
The existence of a regular, ongoing process to monitor and report results is critical to identifying and implementing improvements to system performance or to further the effectiveness of the performance management process. The continual monitoring and update of a performance management framework is reflected in Figure 6.1, which illustrates inputs to performance targets and how ongoing monitoring and adjustments are fed back into the framework to adjust future targets. The surveys conducted regularly to support a pavement, bridge or maintenance management system are examples of the types of performance monitoring activities fundamental to an effective performance management organization.
Agencies with a performance management framework in place have benefited from:
- Maintaining a clear and unified focus for making agency decisions based on agency priorities, public input and available resources.
- Using available funding more effectively to preserve or improve system performance while lowering life cycle costs.
- Allocating available resources based on analysis of past performance and expected conditions to address areas most in need of attention.
- Having the data to confidently defend funding requests or explain the impact of reduced budgets.
- Building a transparent and accountable organization by communicating the basis for making resource decisions.
- Meeting legislative requirements.
Figure 6.1 Monitoring and Adjustment in the TPM Process

TIP
It is important to select performance measures that are meaningful to the agency and that can directly inform decisions. This may vary depending on the agency context, culture, and TAM maturity.
Arizona DOT
In 2001, during the development of a long-range transportation plan (LRTP), the Arizona DOT took a strategic approach to how investments should be made. Under the new approach, Arizona DOT established the following three investment categories:
- Preservation, including activities that preserve existing transportation infrastructure.
- Modernization, including improvements that upgrade the efficiency, functionality, and safety without adding capacity.
- Expansion, including improvements that add transportation capacity by adding new facilities or services.
To implement the new initiative, the Arizona DOT developed a report titled “Linking the Long-Range Transportation Plan and Construction Program” or” P2P Link” that applied financial constraints to the long-term vision. Through a collaborative process that involved a consultant, local and regional governments, and transit agencies, the Arizona DOT published an implementation plan for putting the P2P Link into practice. The resulting process includes scoring projects based on both a technical and policy score that are added together to determine a project’s ranking. The technical score is generated by the asset owner based on an analysis of the data while the policy score is determined based on each project’s contribution to LRTP goals and performance measures. The process helps to ensure that projects are ranked in accordance with the agency’s strategic objectives using only the most meaningful criteria in a transparent and defensible way.
Arizona DOT’s Link Between Strategic Objectives and Investment Decisions

Source: ADOT. 2014. Linking the Long-Range Plan and Construction Program P2P Link Methodologies & Implementation Plan.
https://azdot.gov/sites/default/files/2019/08/p2p-methodologies-implementation.pdf
Performance Measures
Performance measures are used within a performance management framework to allocate resources and provide feedback on the effectiveness of the activities in achieving overall objectives. Performance measures are indicators used for evaluating strategies and tracking progress. A performance measure can be an indication of asset condition, such as a pavement condition rating, or an indication of an operational characteristic, such as the annual number of fatalities on a facility.
The most effective performance measures drive decisions that are important to the success of the program. For example, maintenance departments may use performance measures that track actual expenditures to planned expenditures to ensure that available funding is directed towards the highest-priority items, as shown in the Colorado DOT practice example.
It is also important that the measures drive the desired performance within an organization. For instance, a performance requirement that measures whether pavement or bridge designs are submitted on time might cause incomplete or incorrect submittals to meet a deadline, leading to an increase in construction modifications. A more effective measure might focus on a minimal number of design modifications during the construction phase of a project.
Effective performance measures should also primarily be outcome-based rather than output-based, meaning that they focus on the result or impact of an activity rather than the inputs that went into the activity. Several examples of outcome- and output-based measures are shown in the sidebar on Page 6-8. Outcome-based measures are generally preferred because they indicate the effect on the traveling public resulting from the actions taken, so they usually relate to user priorities such as the length of time for a road to be cleared after a snow event or the absence of litter and graffiti. They are developed based on a description of what an agency wants to achieve as a result of the actions undertaken. Outcome-based measures are commonly used for managing ancillary assets such as drainage assets and signs. For instance, the performance of drainage assets might be reported in terms of the percent of pipes/culverts greater than 50 percent filled or otherwise deficient and the performance of signs might be reported in terms of the percent of signs viewable at night.
Output-based measures, on the other hand, track the resources used to achieve the outcome, such as the number of hours of labor used or the number of light-bulbs changed in a month. While the data is important information for managing resources, it does not necessarily drive outcomes that would matter to the public. For instance, travelers on a highway are much more interested in knowing when the road will be cleared of snow than how much overtime went into the operation.
When possible, agencies should use performance measures that are leading measures rather than lagging measures to influence future decisions. A leading measure uses changes in performance to provide insights into potential changes that might influence a future decision one way or another. For example, knowledge that a ramp meter has exceeded the manufacturer’s suggested service life might drive a decision to replace that meter. Similarly, increases in equipment downtime might indicate risks due to an aging fleet are growing or that planned operational activities will not be performed as planned. A lagging measure, on the other hand, looks back on the results of past investment strategies after the decisions have been made. Because a lagging measure is recorded after the fact, there is a delay (lag) in the agency’s ability to adjust its practices and improve performance. Bridge and pavement condition measures are examples of lagging measures because the reported conditions reflect the impact of decisions made several years in the past. Lagging measures are commonly used to evaluate a program’s effectiveness or to verify that actual investments achieved projected results.
In transportation, an agency might have a lagging measure for tracking complaints responded to within a 48-hour window. The measure provides an indication of the public’s satisfaction with the road network and is easy to monitor and report. However, if an agency really wants to effect change, it might develop leading measures to track the percent of complaints not worked on within a two-hour window or the percent of complaints that can’t be resolved by the initial point of contact and must be passed to someone else. Focusing on these types of measures could drive agency decisions to ensure complaints are being worked on quickly and are being assigned to the right people. General characteristics of effective performance measures are presented in Table 6.1.
North Carolina DOT
The North Carolina DOT authorizes its divisions to determine how funding will be used for maintenance activities and uses performance data to assist with this activity. Each year, Division Engineers submit annual plans detailing what work will be accomplished; these plans are reviewed quarterly with the Chief Engineer to discuss actual versus planned work. Their accomplishments are also displayed in a dashboard for internal use, as shown in the following image. Public-facing dashboards are also available showing overall conditions and performance trends. The Division Engineers are also held accountable for their performance, since their planned and actual performance data are incorporated into their annual evaluations.
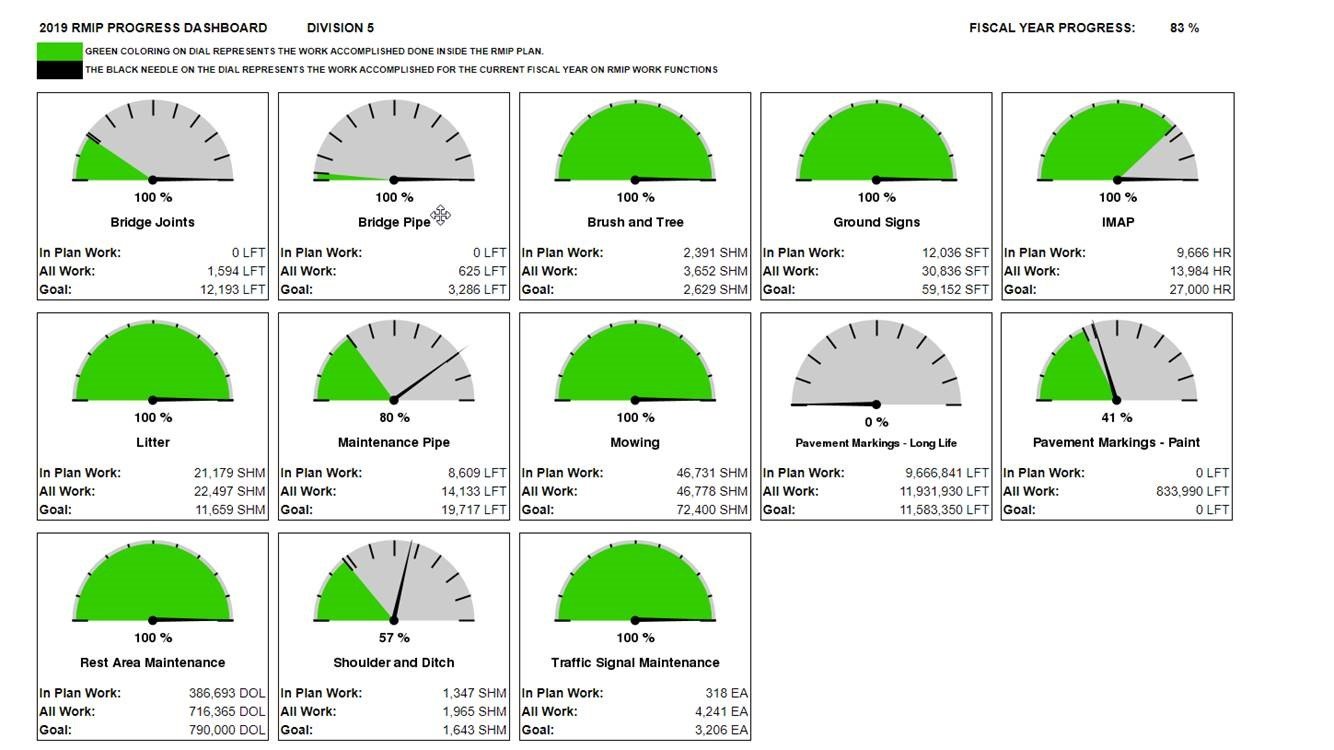
Source: Leading Management Practices in Determining Funding Levels for Maintenance and Preservation. Scan Team Report, NCHRP Project 20-68A, Scan 14-01, National Cooperative Highway Research Program, May 2016.
Use of Performance Measures
Performance measures are used to:
- Connect agency policies and objectives to investment decisions.
- Establish desired and targeted levels of service that consider past performance, current and future demand, stakeholder priorities, and anticipated funding.
- Align agency policies, investments, and day-to-day practices in a meaningful and easily understood manner.
- Prioritize investment needs.
- Monitor and report progress towards desired objectives to both internal and external stakeholders in a consistent, cost-effective, and transparent manner as illustrated in practice examples from the Washington State, North Carolina, and Virginia DOTs.
TIP
Outcome-based measures better relate to performance characteristics noticed by the public and other stakeholders than output-based measures.
Table 6.1 - Desired Performance Measure Characteristics
| Desired Characteristics | Rationale/Purpose |
|---|---|
| Measurable with available tools/data | May require no additional cost for data collection |
| Forecastable | Enables data-driven target setting based on future conditions |
| Clear to the public and lawmakers | Allows performance story-telling to customers and policymakers |
| Agency has influence over result | Measures agency activities rather than impact of external factors |
Washington DOT
The Washington DOT uses its Maintenance Accountability Process (MAP) to comprehensively manage maintenance budgets and to communicate the impacts of policy and budget to both internal and external stakeholders. Field condition surveys are conducted annually to assess the condition of 14 assets on the highway system such as signs and signals, ITS assets, tunnels, and highway lighting. For each asset, a level of service target is established, based on expected funding levels and importance of the asset to the agency’s strategic objectives. The targeted and actual performance is summarized on a statewide basis and presented to the legislature, media, internal stakeholders, and other DOTs in a format similar to what is shown in the figure (https://www.wsdot.wa.gov/NR/rdonlyres/8EC689DF-9894-43A8-AA0F-92F49AC374F5/0/MAPservicelevelreport.pdf). In 2018, Washington State DOT achieved 77 percent of its highway maintenance targets. Targets that were not achieved are shown as red bullseyes and areas where the targets were exceeded include a checkmark with the bullseye. The results illustrate where additional investment is needed on a statewide basis and provides a basis for setting maintenance priorities during the year.
Targeted and Actual Performance Results Used to Set Maintenance Priorities
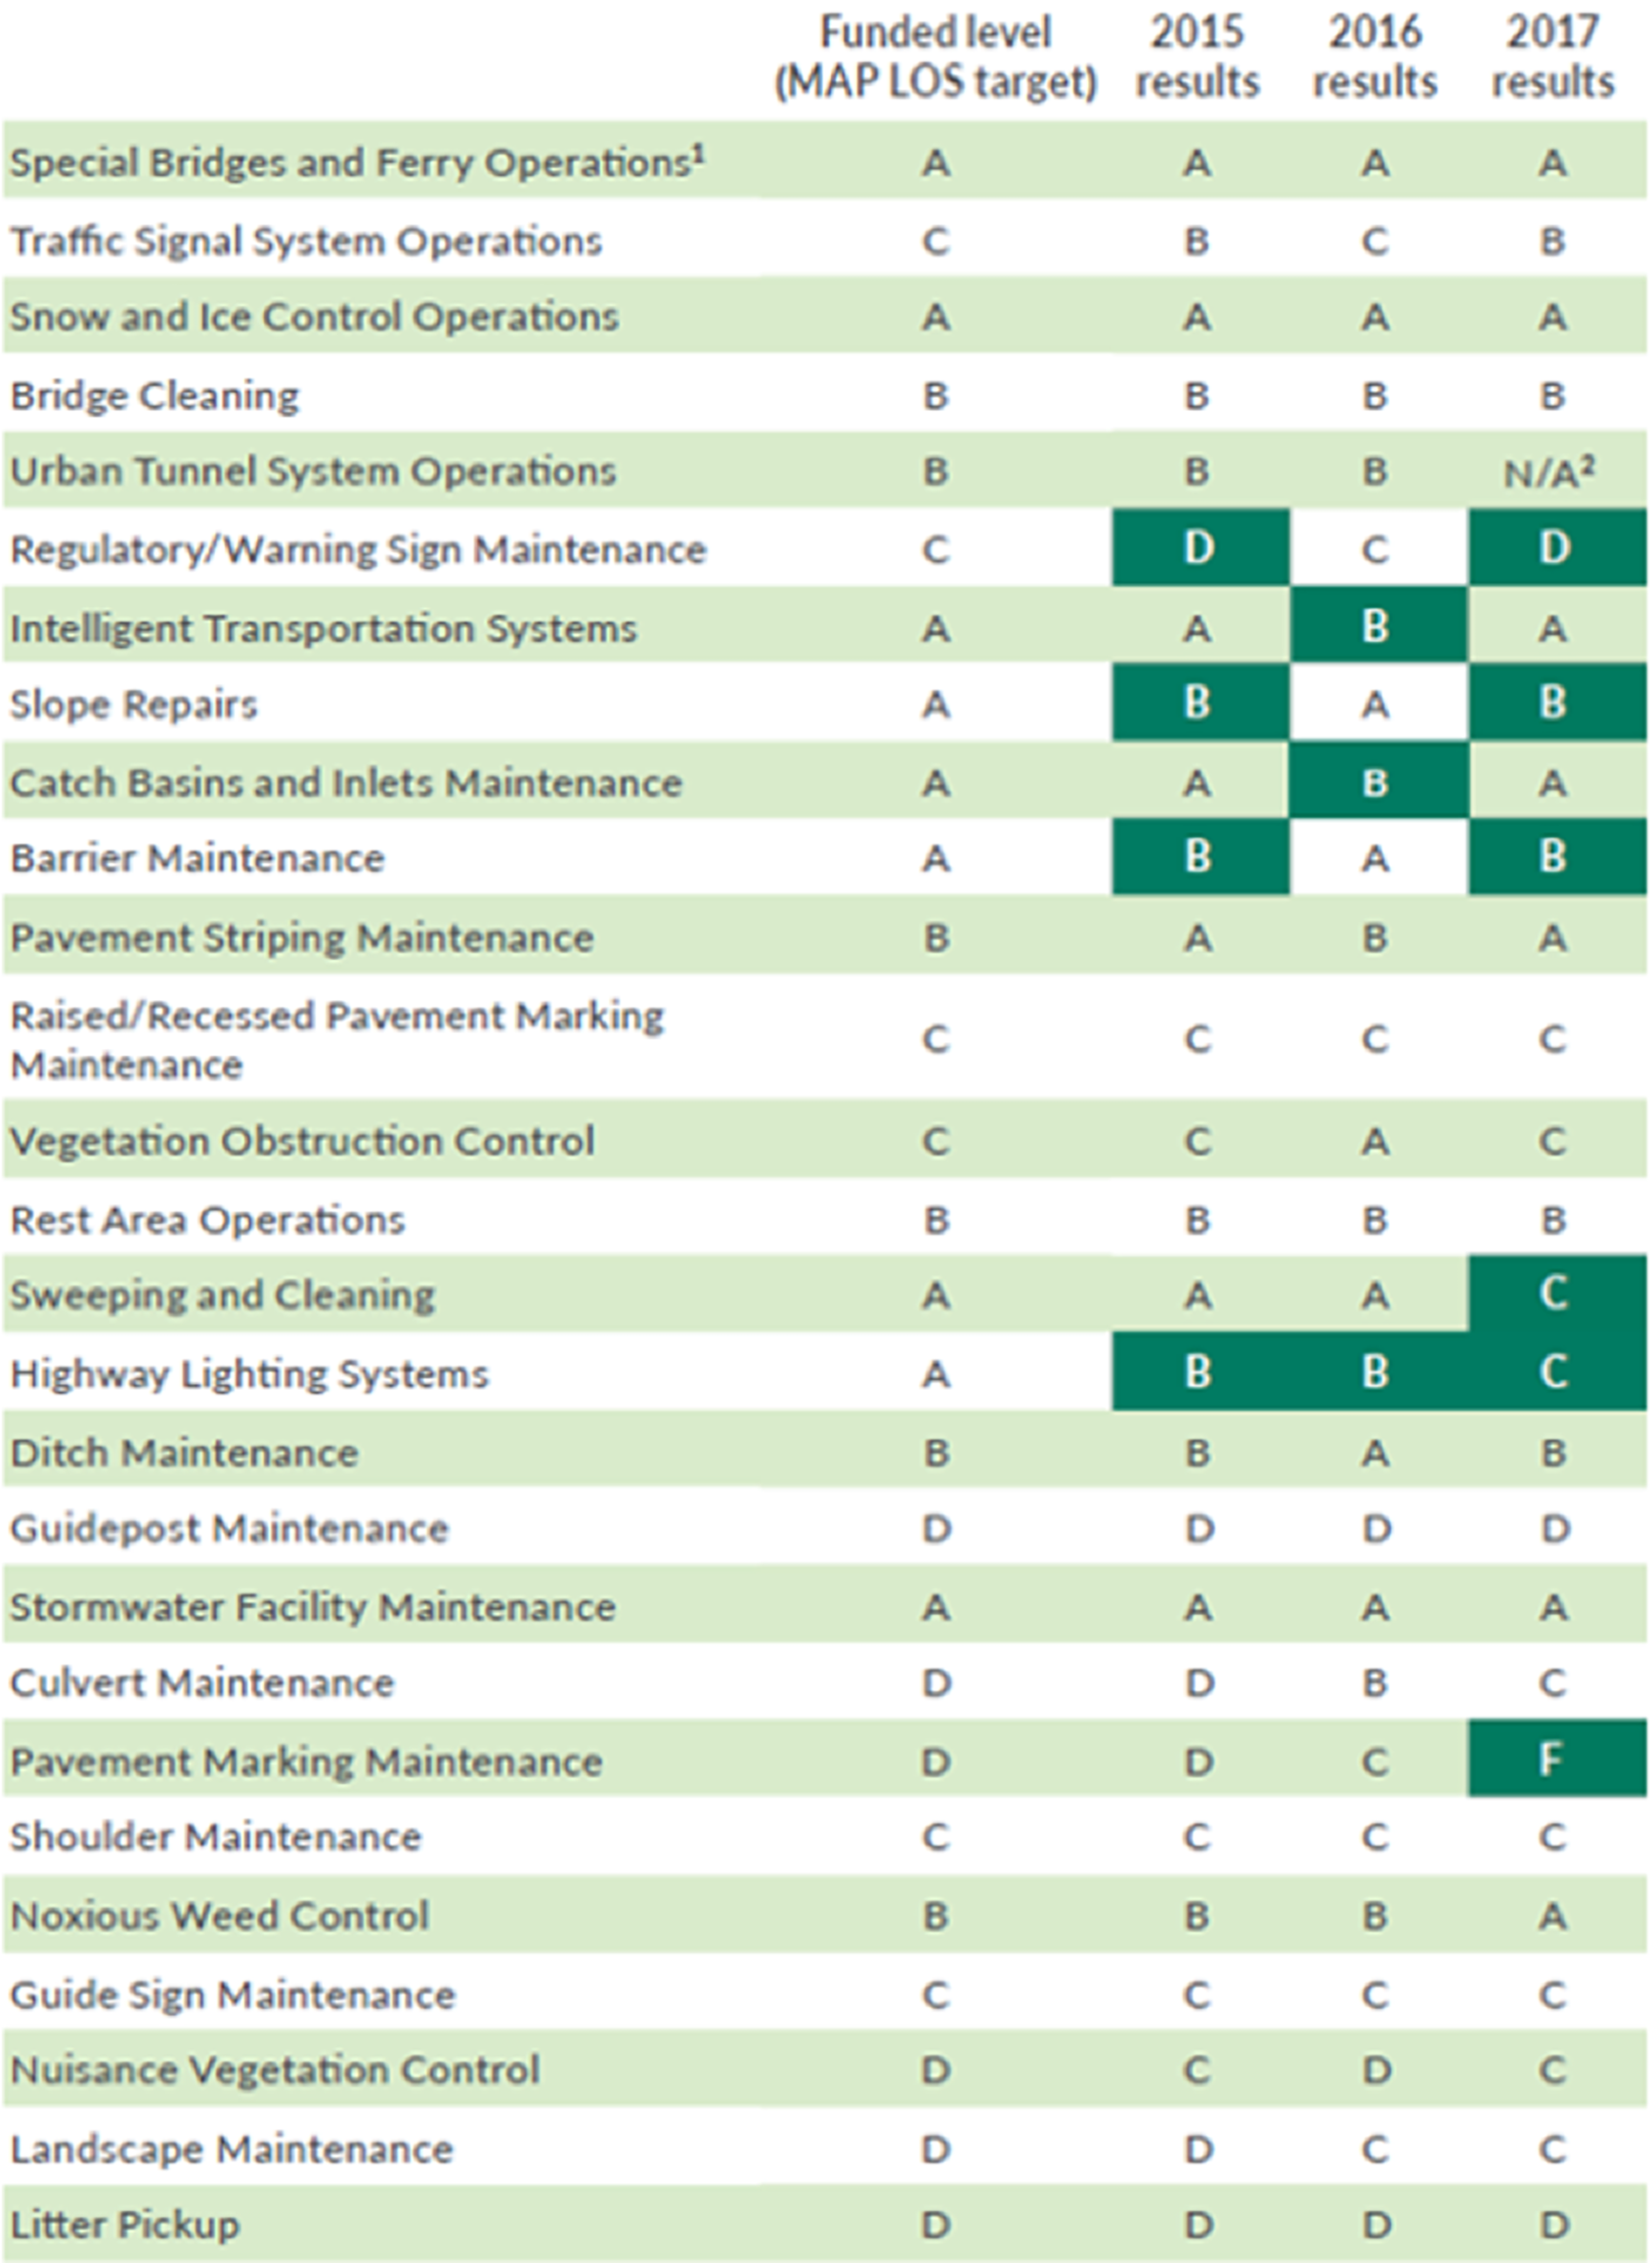
Source: WSDOT. 2017. Multimodal Asset Performance Report. Washington State DOT. https://wsdot.wa.gov/publications/fulltext/graynotebook/Multimodal/AssetPerformanceReport_2017.pdf
Washington DOT
To support accountability, credibility, and transparency, the Washington State DOT publishes its quarterly performance report, referred to as The Gray Notebook. Each edition of the Gray Notebook presents updates on multimodal systems' and programs' key functions and analysis of performance in strategic goal areas based on information reported to the Performance Management and Strategic Management offices of the Transportation Safety and Systems Analysis Division. Washington State DOT also publishes its Gray Notebook Lite, which highlights key metrics referenced in the Gray Notebook in a format for quick reading. Examples from each of these documents are presented in the figures.
The Gray Notebook and the Gray Notebook Lite

Source: WSDOT. 2019. https://www.wsdot.wa.gov/Accountability/GrayNotebook/
Virginia DOT
Performance dashboards are also a popular way to present progress, using color-coded indicators similar to those on the dash of an automobile. An example of the interactive dashboard available from the Virginia DOT is shown in the figure. The screen reports performance in seven areas (performance, safety, condition, finance, management, projects, and citizen survey results) and the needles indicate whether the performance is within targeted ranges. Hyperlinks are available in each area if a user wants to explore historical trends or explore performance objectives in more detail.
Virginia DOT's Performance Dashboard

Source: Virginia DOT. 2019. http://dashboard.virginiadot.org/
Future Directions in Performance Measures
As agencies advance the maturity of their practices and move towards investment decisions across assets and modes (as discussed in Chapter 5), there is increasing interest in the use of leading measures and asset performance measures other than asset condition.
Asset management plans document the processes and investment strategies developed by an agency to manage its infrastructure assets. These asset management plans support an agency’s performance-based planning and programming processes for making long-term investment decisions and feed shorter-term project and treatment selection activities. Together, these activities ensure the investment decisions of an agency are aligned with performance objectives and goals.
Examples of these types of measures include:
- Financial Measures – Internationally, financial performance measures have been used successfully to express whether the level of investment has been adequate to offset the rate of asset deterioration or depreciation. For example, the Queensland Department of Infrastructure and Planning uses an Asset Sustainability Ratio defined as the capital expenditure being made on asset renewals (e.g., improvements) divided by the depreciation expense (discussed further in Chapter 4). If the ratio is less than 100 percent, the level of investment is not adequately replacing the depreciation occurring each year. Queensland also uses an Asset Consumption Ratio comparing the current value of the depreciable assets to their replacement value in order to show the aged condition of the assets.
- Life Cycle Measures – A life cycle performance measure is a relatively new leading measure, promoting the selection of sound, long-term strategies best able to maximize performance at the lowest possible cost. There are several life cycle performance measures under consideration by the FHWA, including the Remaining Service Interval (RSI), which is being validated under a research project. The RSI is based on identifying a structured sequence of the type and timing of various repair and replacement actions needed to achieve a desired LOS over a long timeframe at the minimum practicable cost. The results of the RSI evaluation may be used to generate a Life Cycle Impact Factor, summarizing the difference in life cycle costs associated with the various strategies being considered.
- Sustainability Measures – With an increased focus on identifying long-term sustainable solutions to transportation system needs, agencies may seek to develop new sustainability performance measures in order to properly indicate the impact a proposed solution may have on environmental conditions. The use of a recycling measure for gauging the amount of recycled material used in road construction is an example of this type of measure, as are measures for monitoring carbon dioxide emissions.
TIP
Making performance measures publicly available through reports, scorecards, or dashboards increases transparency into agency operations, which can serve as motivation to improve staff’s desire to meet the standards established, thereby increasing the chance of success.
North Carolina DOT
The North Carolina DOT has an interactive Organizational Performance Scorecard that provides an online indicator of the Department’s success at meeting targets in the following six core goal areas:
- Make Transportation Safer.
- Provide Great Customer Service.
- Deliver and Maintain Infrastructure Effectively and Efficiently.
- Improve Reliability and Connectivity of Transportation Systems.
- Promote Economic Growth Through Better Use of Infrastructure.
- Make NCDOT a Great Place to Work.
An example of how the information is shown; it presents the target for an overall infrastructure health index and the most recent results. As shown by the red “x” in the box on the far right, NCDOT is not currently meeting its target of a health index of 80 percent or more.
North Carolina DOT’s Organizational Performance Scorecard Website – Excerpt
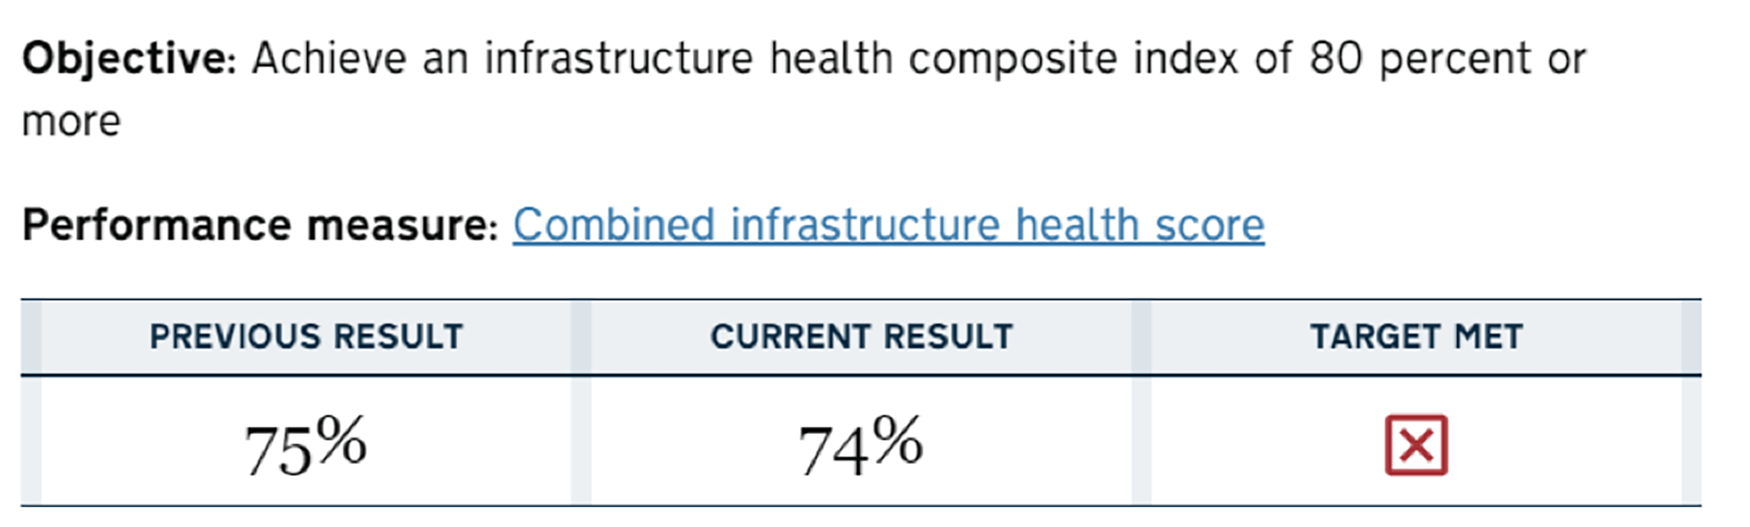
Source: NCDOT. 2019.https://www.ncdot.gov/about-us/our-mission/Performance/Pages/default.aspx
Evaluating the Effectiveness of Performance Measures
Because of the important role performance measures have in supporting performance-based decisions, agencies should use care in selecting measures that drive the right types of results. This section introduces several approaches to evaluate the effectiveness of an agency’s performance measures.
Assessment
In its handbook for agency executives, AASHTO suggests an assessment of performance measures should consider the following:
- Is the number of performance numbers reasonable? – An agency should retain performance measures addressing critical areas of importance that are maintainable with time. The Maryland and New Mexico DOTs have approximately 80 measures reviewed on a regular basis, but the Florida and Pennsylvania DOTs use approximately 15 to 20 measures to review strategic performance. Some agencies identify a small number (< 10) of KPIs selected from the pool of operational and tactical measures that best reflect an agency’s progress toward achieving its overall goals.
- Are the measures meaningful? – Some agencies choose only to use easily measured performance activities because the information is easy to obtain. However, other measures may do a better job of driving good decision making.
- Does the level of detail in data collection match the level of detail required to drive decisions? – Agencies should balance data availability with the analytic rigor used to make decisions. For instance, if pavement markings are replaced every year, it is not necessary to collect retro-reflectivity information annually. Similarly, collecting data on one lane of a two-lane highway may be enough for approximating the condition across the full width of the roadway.
- Do they support the right decisions? – The performance measures should drive decisions in support of strategic objectives. For example, a performance measure based on the amount of overtime incurred after a snow event is less effective than one able to monitor the number of hours until the roads are cleared.
- Are existing data sources reliable? – In most situations, existing data can provide the information needed for performance management, but it must be reliable and maintained regularly to be useful.
An assessment of performance measures can be important, since many organizations find that over time, the number of performance measures they are managing can become unwieldy.
Pennsylvania DOT
After using performance measures for years, the Pennsylvania DOT recognized that the number of measures being used had increased to a level that was difficult to manage. In 2011, the Pennsylvania DOT conducted an assessment of their performance measures using the following series of questions to guide their decisions as to which measures to keep, which to change, or which to delete:
- Who is using the measure?
- What exactly is being measured?
- Why is this particular measure needed?
- Whose performance is being measured?
- Is the performance goal defined?
- Does a similar measure already exist?
- Is the existing measure meeting the needs and intent or should it be modified?
If a measure was needed where no measure exists, the following additional questions were used:
- Does the measure affect continuous improvement?
- Is the data for the measure updated as frequently as needed? Should it be updated monthly, quarterly, or yearly?
- Is the measure easy to quantify?
- Is the measure easy to understand?
- Is it clear who owns the measure?
- Does the measure provide a means of comparison?
- Have unintended consequences been investigated?
- Can the unintended consequences be successfully mitigated?
The process has helped to ensure that the agency is focused on the right measures to drive desired results and behaviors. The analysis found several issues that could be addressed, including eliminating duplicate or overly complicated measures, modifying measures that were driving unintended consequences, and resolving data quality issues.
SMART Evaluation
As discussed earlier, performance measures are used to set desired or targeted levels of service. Targets may be short-term, such as the 2- and 4-year targets state DOTs are required to submit to FHWA, or they may be long-term targets, such as the desired State of Good Repair (SOGR) serving as the basis for an agency’s TAMP.
Performance targets are evaluated using the “SMART” method, which evaluates whether targets are:
- Specific. The performance is explicitly described.
- Measurable. Progress towards the target can be monitored in a consistent manner.
- Achievable. The target considers past performance, expected changes in demand, available resources and other considerations that make it realistic.
- Relevant (also referenced as results-oriented). The target should be meaningful to the agency and drive the right outcomes.
- Time-related (also referenced as timely or time-bound). There is a stated timeframe for achieving the target.
Nevada DOT
The Nevada DOT recognized that although performance measures were being reported regularly, they were not driving agency policies or decisions. The assessment evaluated the performance measures being used in each of the five key performance areas shown in the figure as well as the organizational culture to support performance management.
The study recommended improvements to emphasize the importance of messaging in order to advance the agency’s performance management culture, extend the performance culture beyond the headquarters office to field staff, and develop job performance plans emphasizing accountability at the division, office and unit levels. The study also recommended the periodic review of performance measures to ensure their continued relevance to agency business processes.
Nevada DOT’s five key performance areas and measures
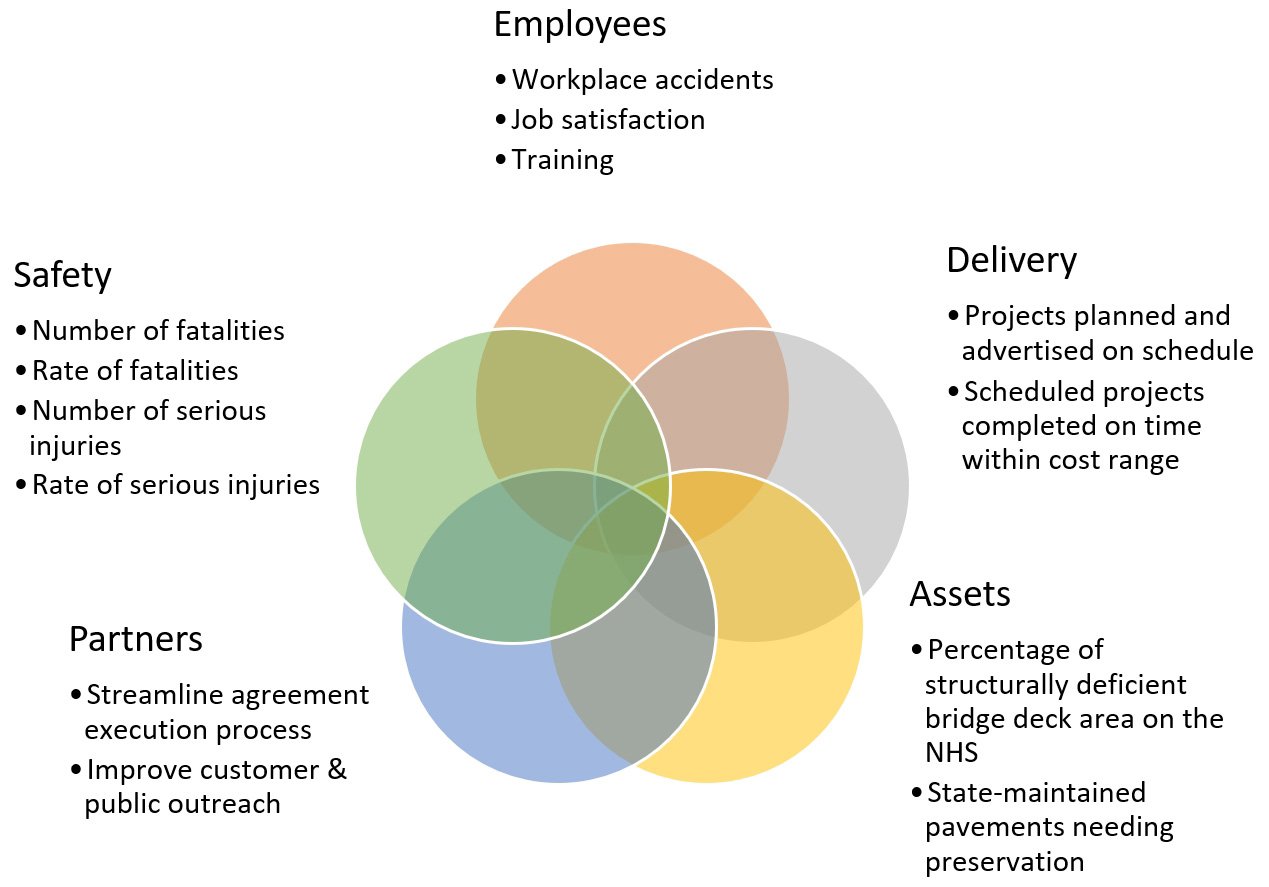
Source: Nevada DOT. 2017. Adapting a Culture for Performance Management at the Nevada Department of Transportation.
Benchmarking
In simple terms, benchmarking is a process of comparing performance and practice among similar organizations as part of an agency’s continuous improvement activities. Benchmarking provides an opportunity to learn about approaches used by high-performing organizations to uncover noteworthy practices, inform target-setting activities, or to foster innovation and improvement within an agency. Benchmarking should focus on improvement and lessons learned rather than as a way to penalize underperformers.
As mentioned in Chapter 1, AASHTO has developed a comparative benchmarking tool for enabling state DOTs to compare performance outcomes and practices with peer agencies as part of their continuous improvement activities (http://benchmarking.tpm-portal.com/). This includes a peer selection tool, so agencies can compare practices to peers with similar characteristics. It also features a performance comparison tool with a number of chart options enabling agencies to compare results. For instance, an agency may elect to compare pavement smoothness characteristics with a neighboring state. There is also a portal to facilitate the exchange of practices among registered DOT users through a Notable Practice Narrative.
An example from the AASHTO TPM Portal showing a comparison of bridge deck percentage determined to be structurally deficient is shown in Figure 6.2. Similar comparisons are available for safety, environmental, and non-motorized (bicycle and pedestrian) performance measures. For transit agencies, Transit Cooperative Research Program (TCRP) Report 141, A Methodology for Performance Measurement and Peer Comparison in the Public Transportation Agency, provides specific guidance for comparing performance with other agencies.
Figure 6.2 Example Performance Comparison from the AASHTO TPM Portal
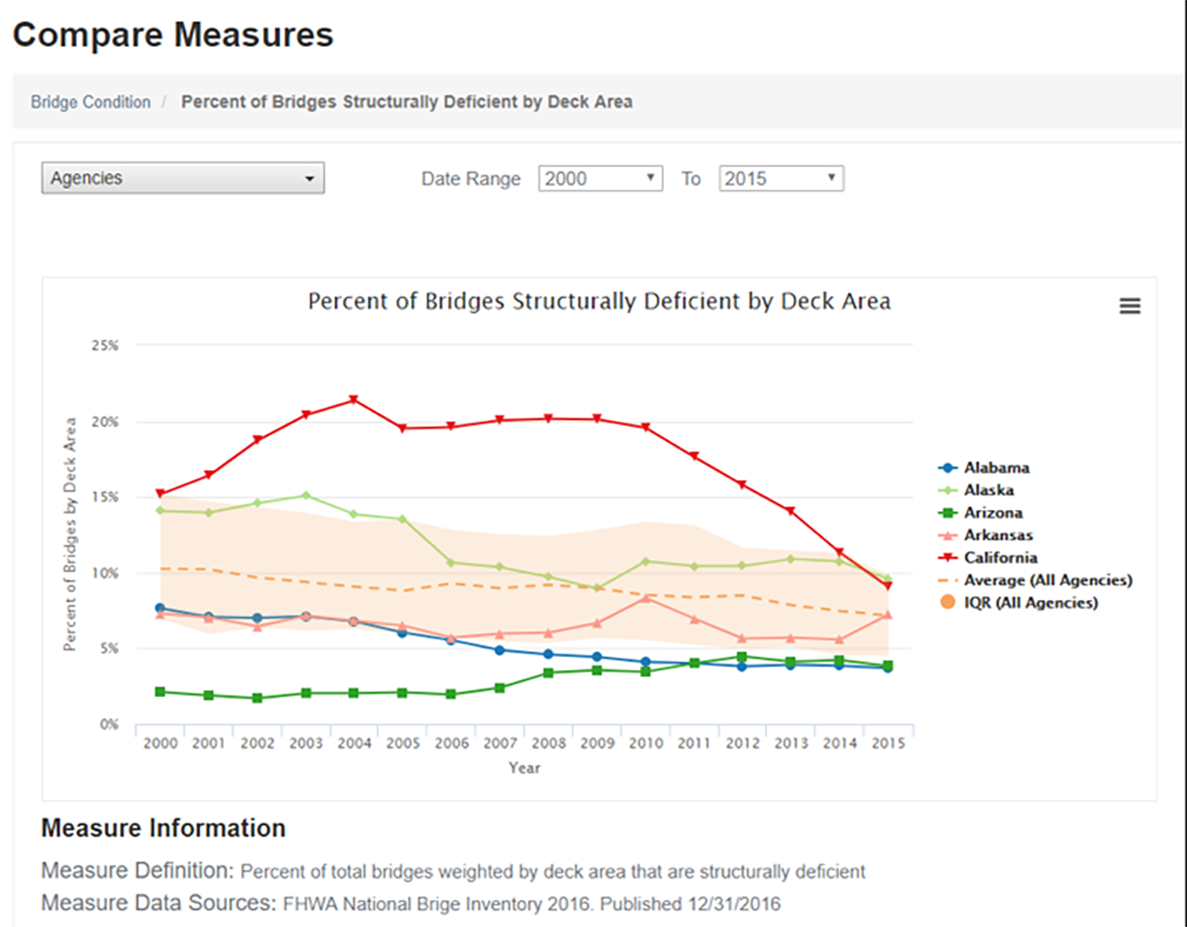
Source: TPM Portal. 2019. http://benchmarking.tpm-portal.com/compare/bridge-condition/deficient-bridges
Audits
Internationally, ISO standards include the conduct of periodic internal audits to help an agency evaluate whether its asset management program and components meet the agency’s needs, adhere to best practices and are being used to support decisions. In addition, agencies use auditing for service providers to confirm contract compliance in situations where road network maintenance and management activities have been outsourced.
TIP
The AASHTO TPM Benchmarking Tool (http://benchmarking.tpm-portal.com/) was designed to assist state DOTs with benchmarking TPM data, providing a data source and comparison tools.
Types of Performance-Based Data to Monitor
This section describes the types of information that should be collected and maintained to support performance-based decisions for physical assets. This section focuses on asset inventory and condition information for life cycle management, but recognizes that other operational performance characteristics may be important to determine whether an asset is fulfilling its intended function.
Differences in Performance and Condition
The terms ‘performance’ and ‘condition’ are often used interchangeably, although they have different meanings in a performance-based environment. The performance of an asset relates to its ‘ability to provide the required level of service to customers’ while condition is generally considered to mean the observed physical state of an asset, whether or not it impacts its performance. For example, a bridge with scour may continue to perform adequately in the short-term even though it may receive a low National Bridge Inventory (NBI) rating because of the deterioration.
Inventory Information
An asset inventory provides information other than performance data important for estimating the amount of work needed, identifying the location of work in the field and determining characteristics capable of influencing the type of work to be performed. The LCM approach introduced in Chapter 4 can be used to help an agency determine what information is needed to support the management of each type of asset. The asset inventory requirements for those assets managed based on a specified interval for repair, such as pavement markings, is very different than those required for an asset managed using a condition-based approach, such as pavements or bridges. Regardless of how detailed the asset inventory is, it is important an agency establish processes to ensure data quality and keep the inventory current over time.
There are several basic data attributes essential to effectively managing transportation assets, including asset type, quantity and location. Additional information that is important is to differentiate between the types of work to be performed, which may also be added to the inventory, the type of material used to construct the asset, the last time work was performed and factors influencing the use of the asset (e.g. traffic levels, highway functional classification or climatic conditions).
As discussed in Chapter 7, managing asset inventory information using an integrated approach to data management helps promote consistency in asset data across an agency and provides access to help ensure the data is used by decision makers at all levels of the organization. An out-of-date inventory makes it difficult for an agency to estimate work quantities accurately for budgeting purposes.
Condition Information
Asset condition information is used to determine how assets are performing and how performance changes over time. The lack of condition information may lead to premature or unexpected failures with the potential to be very costly, negatively impacting system performance and increasing agency risks. Methods of collecting asset condition information are discussed further in Chapter 7. To ensure that condition information remains current, it is important that the information is updated on a regular basis.
Asset Condition
There are several approaches for assessing asset conditions, each of which is influenced by the type of asset and the resources available to support the process. Typically, an assessment of asset condition involves a method of evaluating the presence of deficiencies and/or deterioration at the time of inspection. The results are used to assign a rating or LOS used to determine the need for maintenance, rehabilitation or replacement now or in the future. Asset condition ratings may also be used to establish rates of deterioration, allowing an agency to forecast future conditions for planning purposes.
Examples of commonly used types of asset condition ratings are listed below.
- A pavement condition index based on the type, amount and severity of distress present, which could be on a 0 to 100 scale, with 100 representing an excellent pavement.
- The National Bridge Inventory (NBI), which assigns a rating between 1 and 9 based on the deterioration present in each element (deck, superstructure, substructure and culvert).
- A LOS rating of A to F for maintenance assets, such as the percent blockage in a culvert or the percent of guardrail not functioning as intended.
Maintaining asset condition information is important for evaluating performance to determine whether improvements are needed to achieve the agency’s strategic objectives. The lack of current condition information, or a lack of confidence in the condition information, makes it difficult to present investment needs to stakeholders with any degree of confidence.
Asset Performance
The results of condition surveys or inspections are used to evaluate the performance of each asset in terms generally understood by stakeholders, such as Good, Fair or Poor.
It is common for transportation agencies to report the percent of the network in Good or Fair condition or the percent of drivers traveling on roads in Good and Fair condition. Asset performance can also be reported in terms of a health index, such as the Remaining Service Life (RSL) used by some state DOTs to indicate the amount of serviceable life left in the asset. In the maintenance community, some state DOTs have developed a Maintenance Health Index or overall LOS grade to represent the performance of the entire Maintenance Division rather than report the grades of each category of assets separately.
Asset performance also influences overall system performance, as demonstrated by the impact on system reliability associated with unplanned road or bridge closures due to flooding or an on-going lack of maintenance. Performance data related to delay, unplanned closure frequency, GHG emissions, and crash locations may all be impacted by asset conditions and affect an agency’s ability to achieve its broader, strategic performance objectives such as system reliability, congestion reduction, environmental sustainability, and freight and economic vitality. For example, it is important to monitor performance characteristics such as travel time reliability to determine whether capital improvements are needed to add additional lanes or whether ITS assets could improve traffic flow during peak periods.
Ohio DOT
The Ohio DOT recognizes the importance of integrated management systems to support both life cycle and comprehensive work planning activities. One of the tools developed by the Ohio DOT is its Transportation Information Mapping System (TIMS), which enables planners, engineers and executives to access and manage key asset, safety and operational data in an integrated web-mapping portal (https://gis.dot.state.oh.us/tims). The portal is available to both internal and external stakeholders and allows users to access information about the transportation system, create maps or share information. The data integration efforts enabling TIMS are now underpinning all management system implementations.
Types of Funding and Resource Allocation Trends
This section describes several funding and resource allocation trends that are commonly used by the transportation industry.
Funding and Resource Allocation Trends
Historical trends related to the performance and condition of the highway system or the way investments have been made provide useful information for estimating future investment needs. These trends contain important insights into future needs and highlight the consequences associated with different tradeoffs in the various uses of funds. This information can be useful in developing the life cycle management and financial planning portions of a TAMP.
The FHWA introduces the importance of historical trends for the following reasons:
- Illustrating whether past expenditures were adequate or whether they need to increase
- Helping an agency shift from a budgeting process based on incremental growth in expenditures to a performance-based approach addressing need
- Building agency confidence in forecasting future investment needs and conditions
Types of funding and resource allocation trends commonly include:
- Revenue trends over time by funding source
- Funding allocations by program category over time
- Expenditures by asset and work category over time
- Expenditures by system (e.g., Interstate, non-Interstate NHS and non-NHS) over time
- Expenditures by district or region over time
Revenue Trends by Funding Source
A summary of revenue trends by funding source provides an agency with a foundation for projecting the amount of revenue available in future years to address asset needs. These trends help an agency understand whether revenues are increasing or decreasing, identify which revenue sources have significant amounts of variability or more consistent growth rates over time, and illustrate whether the agency is relying on unsustainable funding. The information is a vital foundation for forecasting future revenue levels for planning purposes and helping formulate the assumptions upon which future revenue forecasts are based.
An example of a revenue trend table is provided in Figure 6.3. The trends illustrate which revenue sources have increased or decreased over time and are thus important for making future revenue projections. The table also highlights how overall funding levels peaked between 2007 and 2009 largely due to state bonds in 2007, federal bonds in 2007 and 2009 and one-time ARRA (American Recovery and Reinvestment Act) funding in 2009. When these three funding sources ended, the available revenue reverted to 2005 levels. If the effects of inflation were taken into consideration, the agency could also show how the purchasing power of available funding has dropped in later years.
Figure 6.3 Example of Historical Revenue Trends by Funding Source
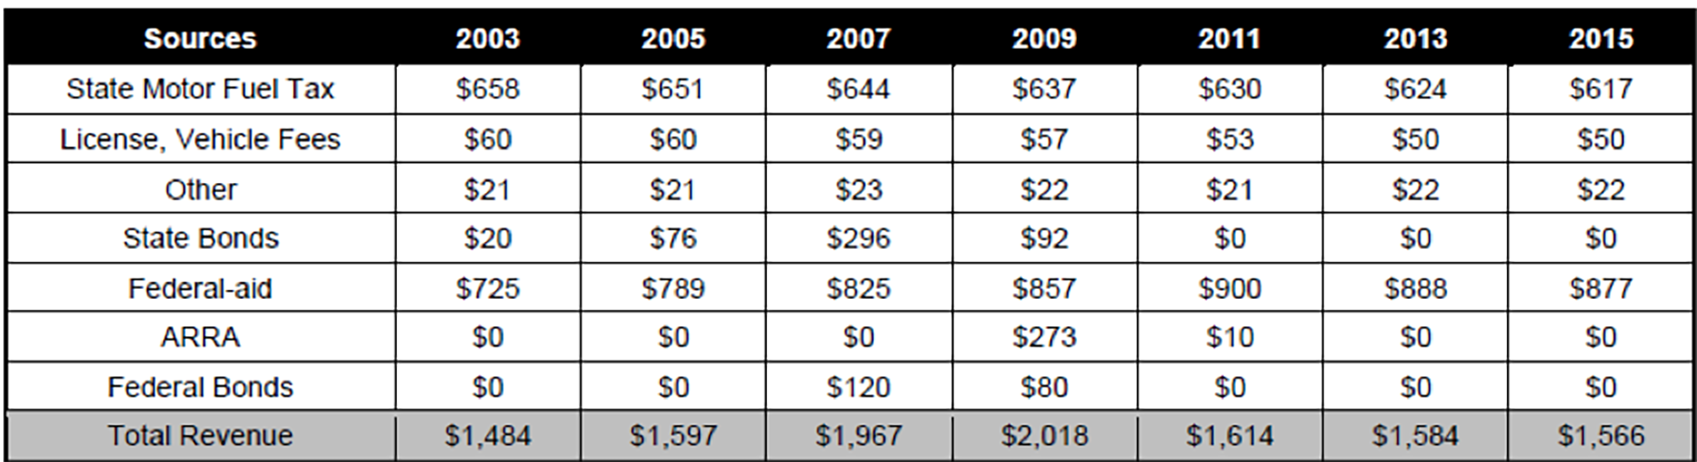
Source: NHI 136002 – Financial Planning for Transportation Asset Management. Participant Workbook.
Funding Allocations by Program Category
Transportation agencies typically track funding allocations and expenditures by program category, but the number of categories and the category descriptions may vary depending on the agency. In general, funding allocations are tracked separately for the highest-value assets and the performance of these assets are incorporated into the agency’s strategic goals. This may lead agencies to track investments made in pavements, bridges, maintenance, safety and other assets. Within each of these categories, agencies can project the level of funding expected and predict the conditions and performance expected for it. Past trends in funding allocations by category can help indicate whether expected funding will be adequate to achieve the stated objectives.
Expenditures by Asset and Work Category
Information on past expenditures by asset and work type, along with resulting conditions, provides insight into the amount of funds needed for these activities in future years or helps set expectations for conditions achievable in future years. Where there are differences in planned expenditures and needed expenditures, the agency may report the existing financial gap.
Expenditures by System
Expenditures by system also provide valuable information, laying the groundwork for predicting how future funding levels will impact the condition of the Interstate, non-Interstate NHS and non-NHS assets. The information by system also conveys the agency’s past priorities for system investment, with higher levels of investment in high-volume facilities being common.
Expenditures by District or Region
Trends showing expenditures by district or region may be used to identify geographical areas requiring more focus on a particular type of work or experiencing an accelerated rate of asset deterioration. Information provided at this level can also be used to identify differences in production rates with the potential to serve as the basis for improving future practices. For example, a district with an unusually high production rate for repairing guardrail end treatments could share its experiences with other districts to improve the overall productivity rate at the statewide level.
Overcoming Challenges Associated With Trend Analysis
It can be difficult to predict future trends based on historical data, especially when there is a significant amount of variability occurring. For example, the FHWA construction inflation trends shown in Figure 6.4 illustrate how variability can have a significant impact on historical trends. In this example, the FHWA National Highway Construction Cost Index has a compound annual growth rate of 1.16 percent between 2003 and 2014. However, between 2005 and 2008, significant inflation occurred. An agency preparing a construction estimate in 2006 would look very different than one developed in 2003 or 2013. To address this type of challenge, the agency can include any assumptions made, when preparing an estimate based on trends with significant variability. It could also conduct a sensitivity analysis to better understand the consequences of the potential variability.
Figure 6.4 Actual and Compound Average Annual Construction Inflation Trends between 2003 and 2014
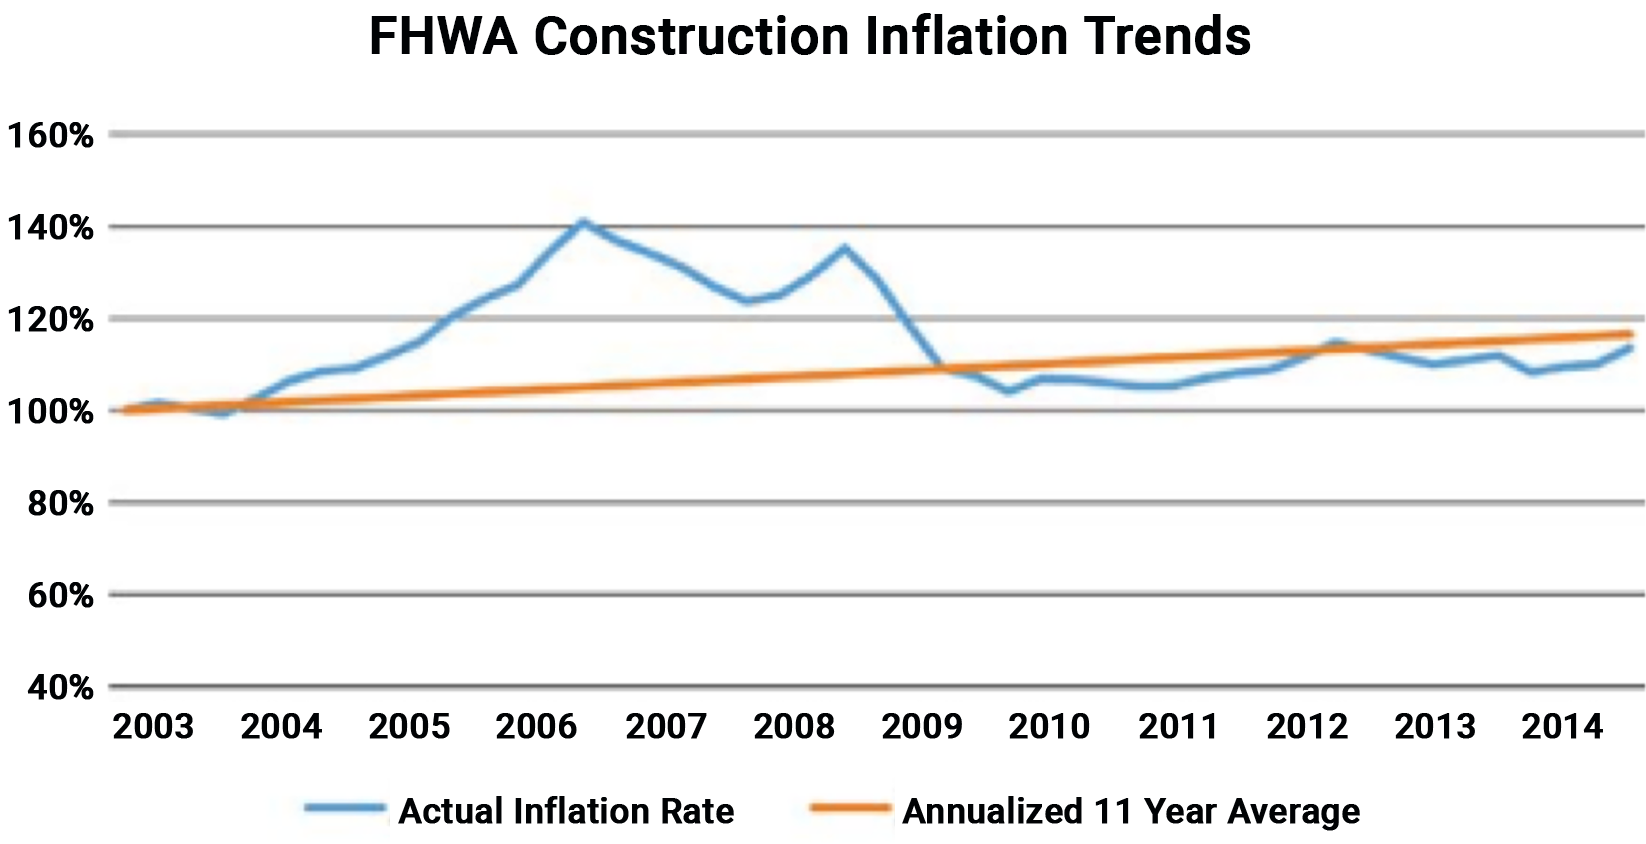
Source: FHWA. 2015. Managing Risks and Using Metrics in Transportation Asset Management Financial Plans.
Another challenge in using trends is the fact that past performance does not guarantee future results, especially if there have been changes in the condition impacting performance. For example, a bridge may have performed well for years, but changes in traffic volumes and weights could significantly increase the rate at which the bridge deteriorates. Similarly, the use of new bridge deck materials may last longer than the materials used previously. To address these challenges, an agency may find it beneficial to modify historical models to better reflect current and future conditions. Monitoring performance over time will allow the agency to develop new models specific to changes in traffic or materials.
A third challenge arises in trying to develop trends for expenditures in work activities when there are inconsistencies within the agency as to what treatments are included in each category. This typically occurs with work activities related to maintenance and preservation. For example, the categorization of a treatment may vary depending on whether the work was performed by inhouse forces or a contractor. Another example is when a preservation treatment is used as a stop-gap improvement on a project that needs more substantial repairs. Again, the actual performance of the stop-gap improvement could be much shorter than the application of that same treatment when used as a preservation improvement. The absence of standardized work categories or the use of stop-gap treatments consistently across the agency can make it difficult to show meaningful performance trends for these types of activities. As a result, it can be difficult to show the benefits associated with these treatments. The solution is to define treatments consistently throughout the agency and to ensure that the treatments are being used as expected.
Using Trend Data to Make Program Adjustments
This section illustrates how some agencies have successfully used historical trends to make program adjustments.
Adjusting a Program Based on Trends
The availability of historical trends is integral for making future projections as part of the planning and programming process. As shown by the examples included in this section, agencies have used trend data creatively to make program adjustments and more effectively align planned investments with strategic objectives.
Minnesota DOT
The Minnesota State Highway Investment Plan (MnSHIP) outlines a 20-year strategy for investing in the state highway system. The most recent document, published in 2017, outlines investment priorities for the period from 2018 to 2037 (http://minnesotago.org/application/files/3414/8431/5979/ MnSHIP_Final_Jan2017.pdf). One of the figures included in the plan uses historical inflation trends to illustrate the declining purchasing power of revenue due to construction costs growing at an annual rate of approximately 4.5 percent. This cost growth rate exceeds the projected annual revenue growth rate of approximately 2 percent, which is expected to erode over half of the buying power of revenues by 2037. As a result of this analysis, MnDOT was able to communicate its financial situation with stakeholders and could better manage the risks associated with continued construction cost increases over the planning period.
Anticipated Construction Revenue by Year Including Adjustments for Inflation
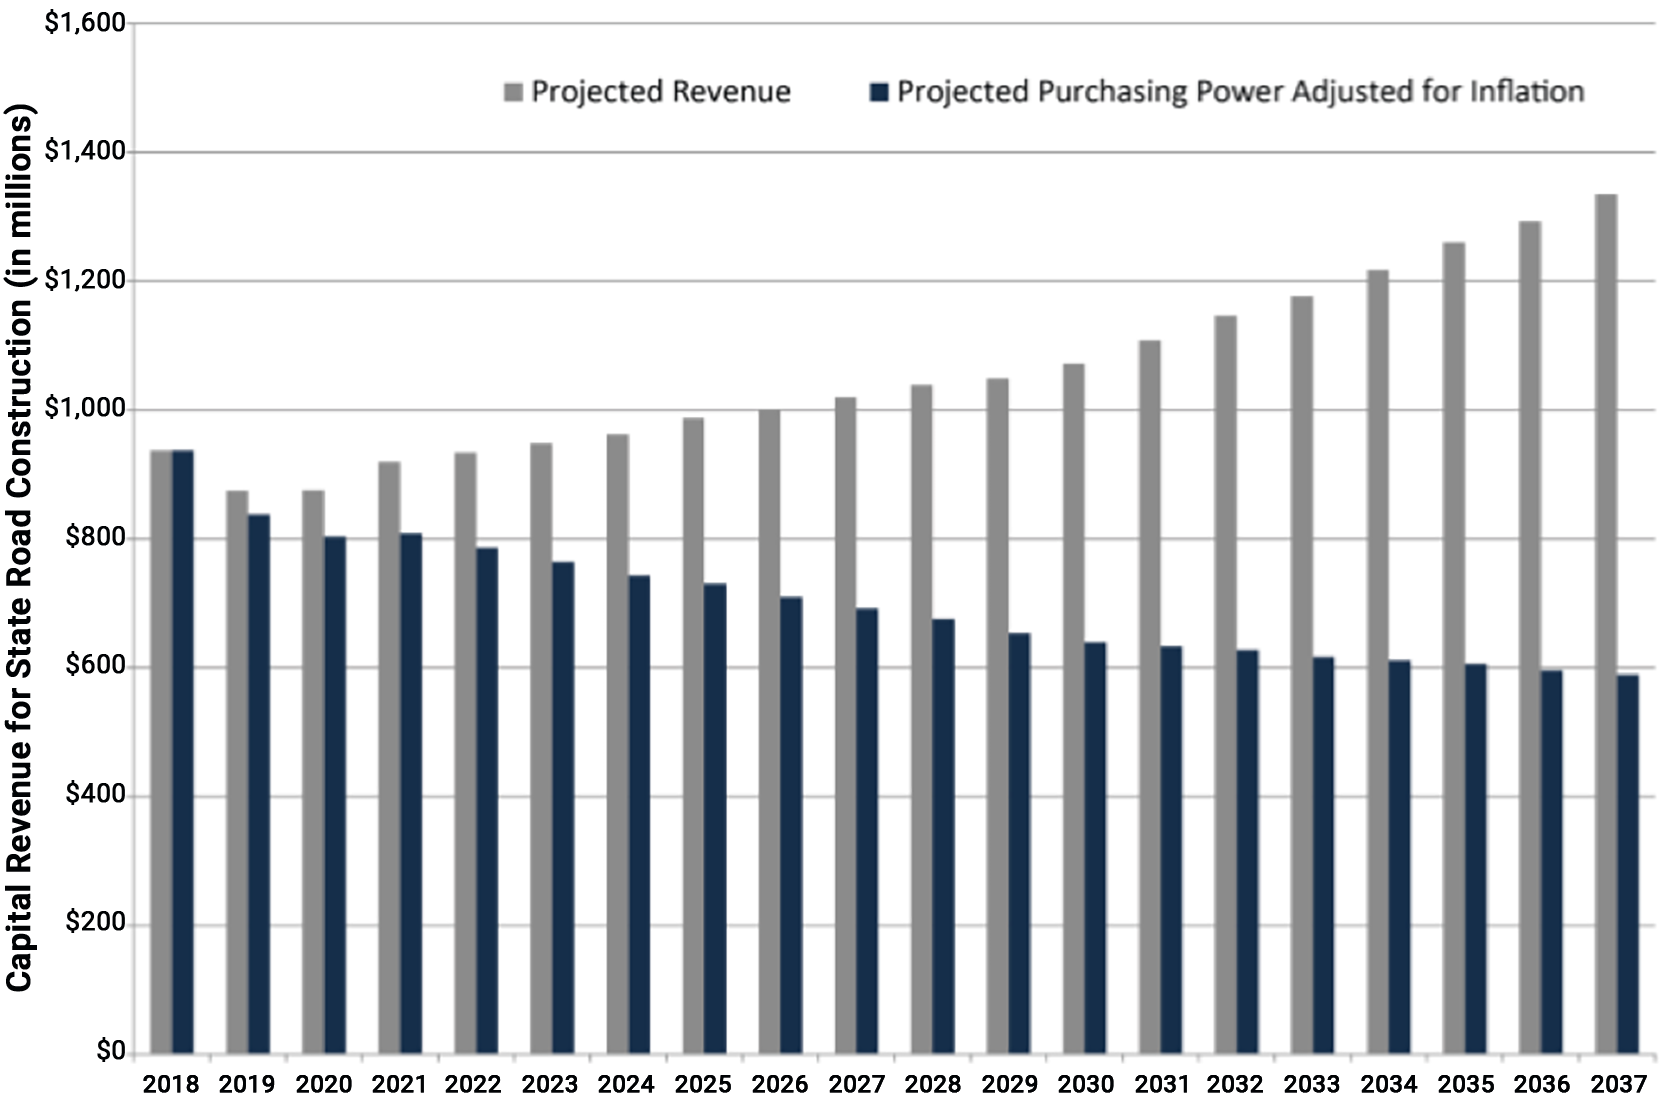
Source: Minnesota DOT. 20-Year State Highway Investment Plan 2018-2037.
Illinois DOT
The Illinois DOT used a graph showing the number of miles of state-maintained roads in need of unfunded rehabilitation or reconstruction, which was referred to as the backlog. The graph, shown in the figure below, illustrates the fact that the backlog was growing over time due to the inadequacy of funding. The increasing trend in backlog prompted the Illinois DOT to reconsider its approach to selecting projects and treatments, moving towards the increased use of preservation treatments to slow the rate at which pavement conditions drop into a backlog condition. In addition to the change in treatments, the Illinois DOT developed a new pavement performance measure based on the percent of the network in good enough condition to be a candidate for a preservation treatment. The change in performance measure was intended to shift funding priorities from deteriorated pavements to those that could be kept in good condition for a longer period of time. The changes were documented in the Illinois DOT’s April 2018 Transportation Asset Management Plan (http://www.idot.illinois.gov/transportation-system/ transportation-management/planning/tamp) and were used in developing the fiscal year 2019-2024 Multi-Year Proposed Highway Improvement Program. In addition, new software tools are being acquired to further support this improved approach to managing pavements and bridge assets.
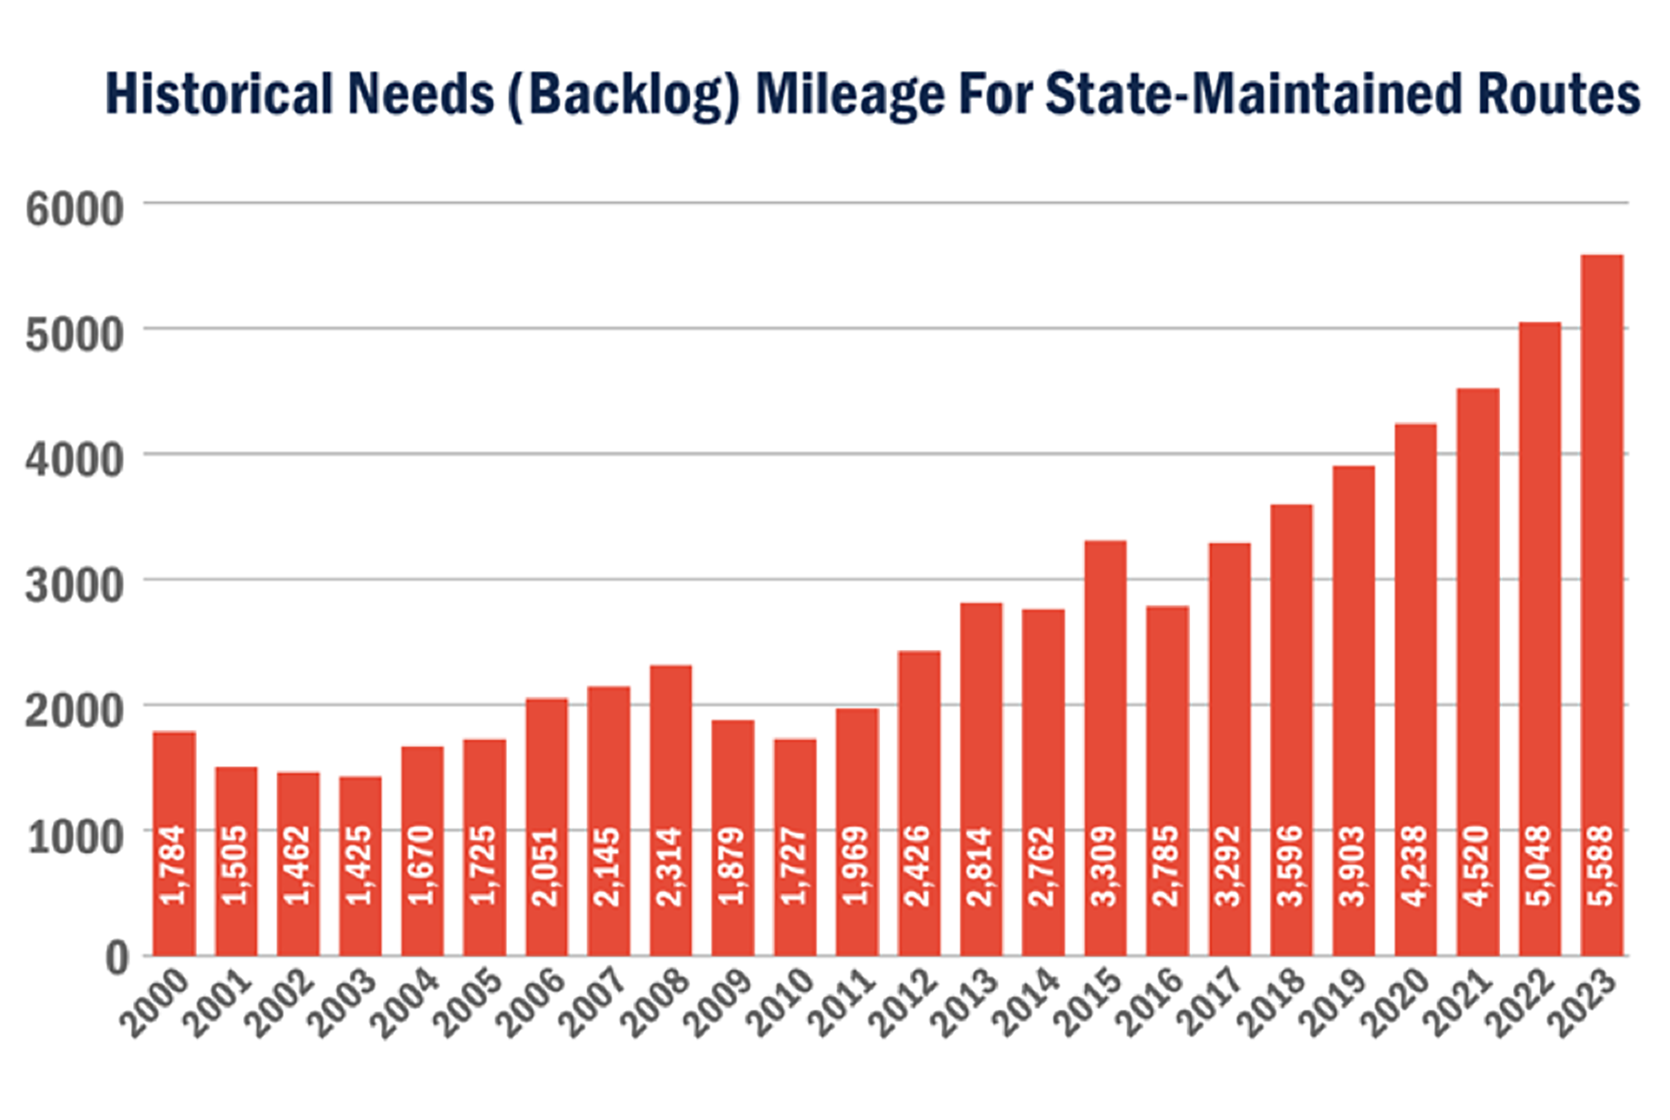
Source: Illinois DOT Transportation Asset Management Plan. 2018.
New Mexico DOT
In 2004, the New Mexico DOT realized that a significant percentage of state-maintained bridges were classified as structurally deficient. To address this issue, the agency targeted increased investments in bridge preservation. Going forward, the agency funded rehabilitation activities for bridges in poor condition and added preventive maintenance activities for bridges in good or fair condition to slow the rate of deterioration on these bridges. As shown in the figure below, the program has been very effective in improving bridge conditions. Adding a line to the graph showing the targeted conditions would help convey the impact that the increased preservation expenditures have had on achieving performance objectives.
Trend Showing the Decrease in Structurally Deficient Bridge Deck Area Resulting from Targeted Investments
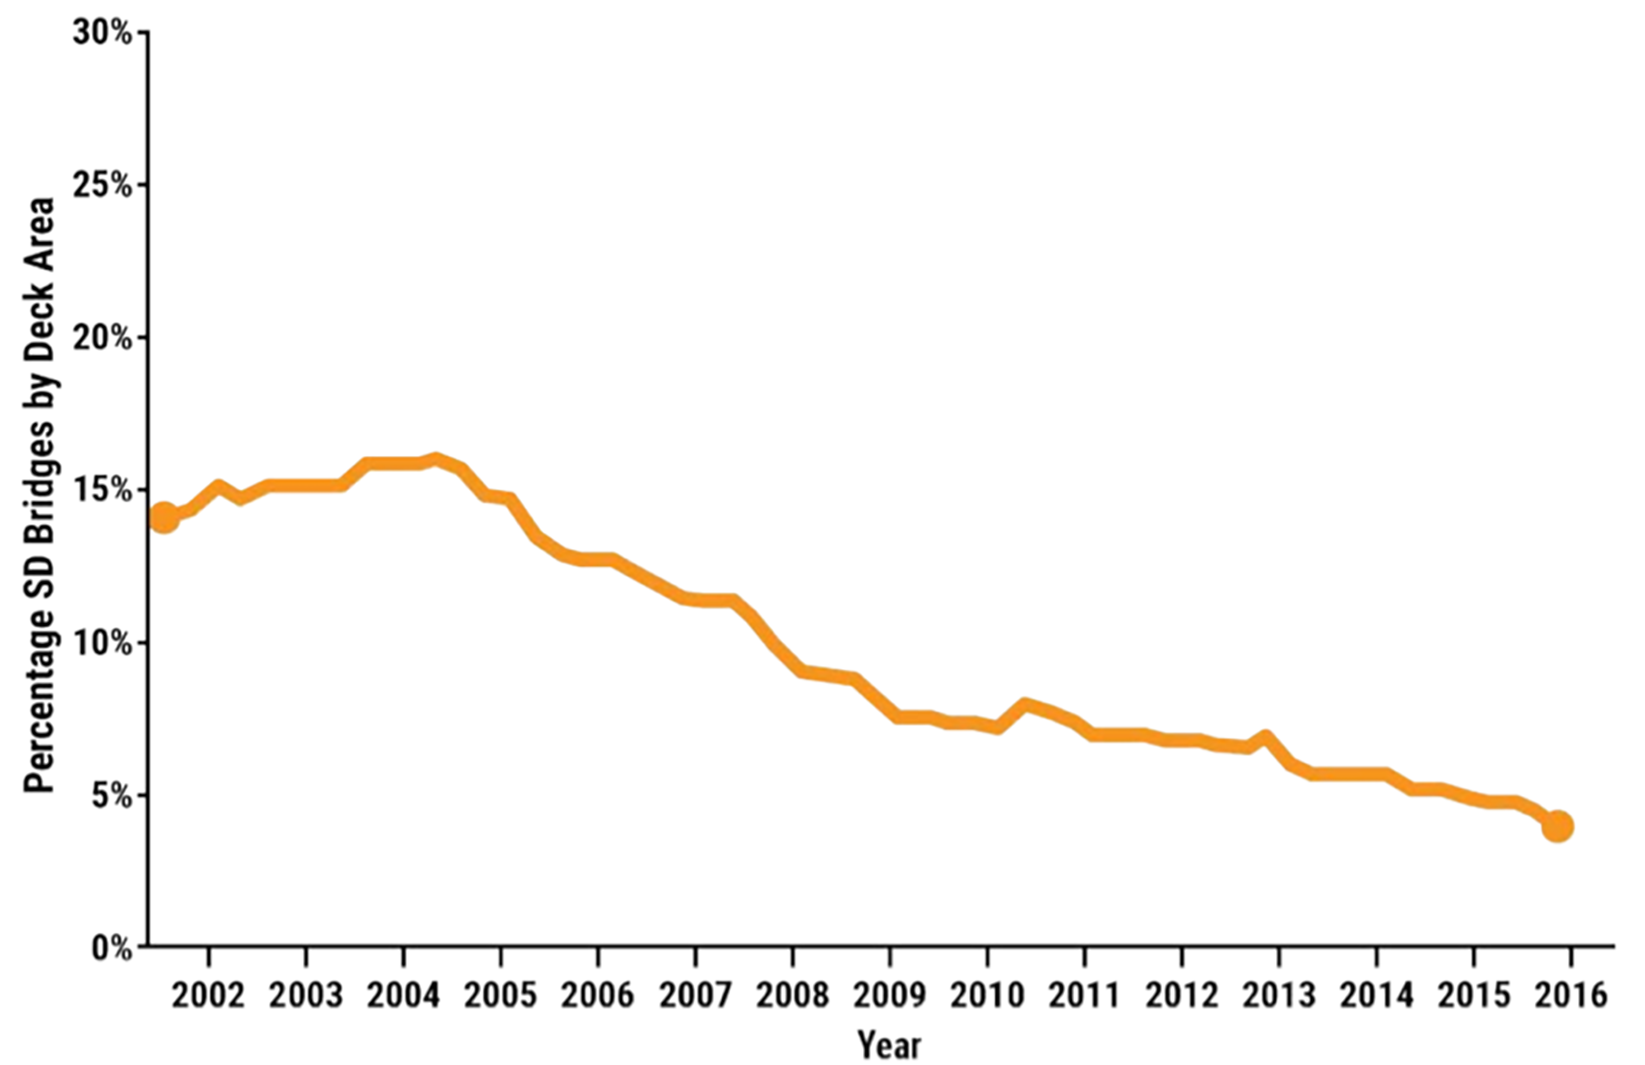
Source: New Mexico DOT Transportation Asset Management Plan. 2018.
South Dakota DOT
To determine the effectiveness of road investments, the South Dakota DOT uses historical trends and projects conditions for each road category to show whether targeted conditions can be achieved with planned investment scenarios. The figure below illustrates the type of graph developed for the Interstate network. As shown, the graph presents both historical and projected conditions based on a Surface Condition Index (SCI) that ranges from 0 to 5, with 5 representing a distress free pavement. Overlaid on the graph is the acceptable condition range, which in this case spans an SCI between 3.8 and 4.2. The graph shows that Interstate conditions gradually improved over time. Although it projects average future conditions to drop, they are expected to continue to fall into the acceptable condition range. The results of the analysis provide the agency with confidence that the planned investments will achieve the desired condition levels over the analysis period. In addition, the projections are updated annually to provide a picture of changing financial trends and funding availability. This allows the DOT to react to any downturn in the projections.
Past and Future Pavement Conditions and Goals
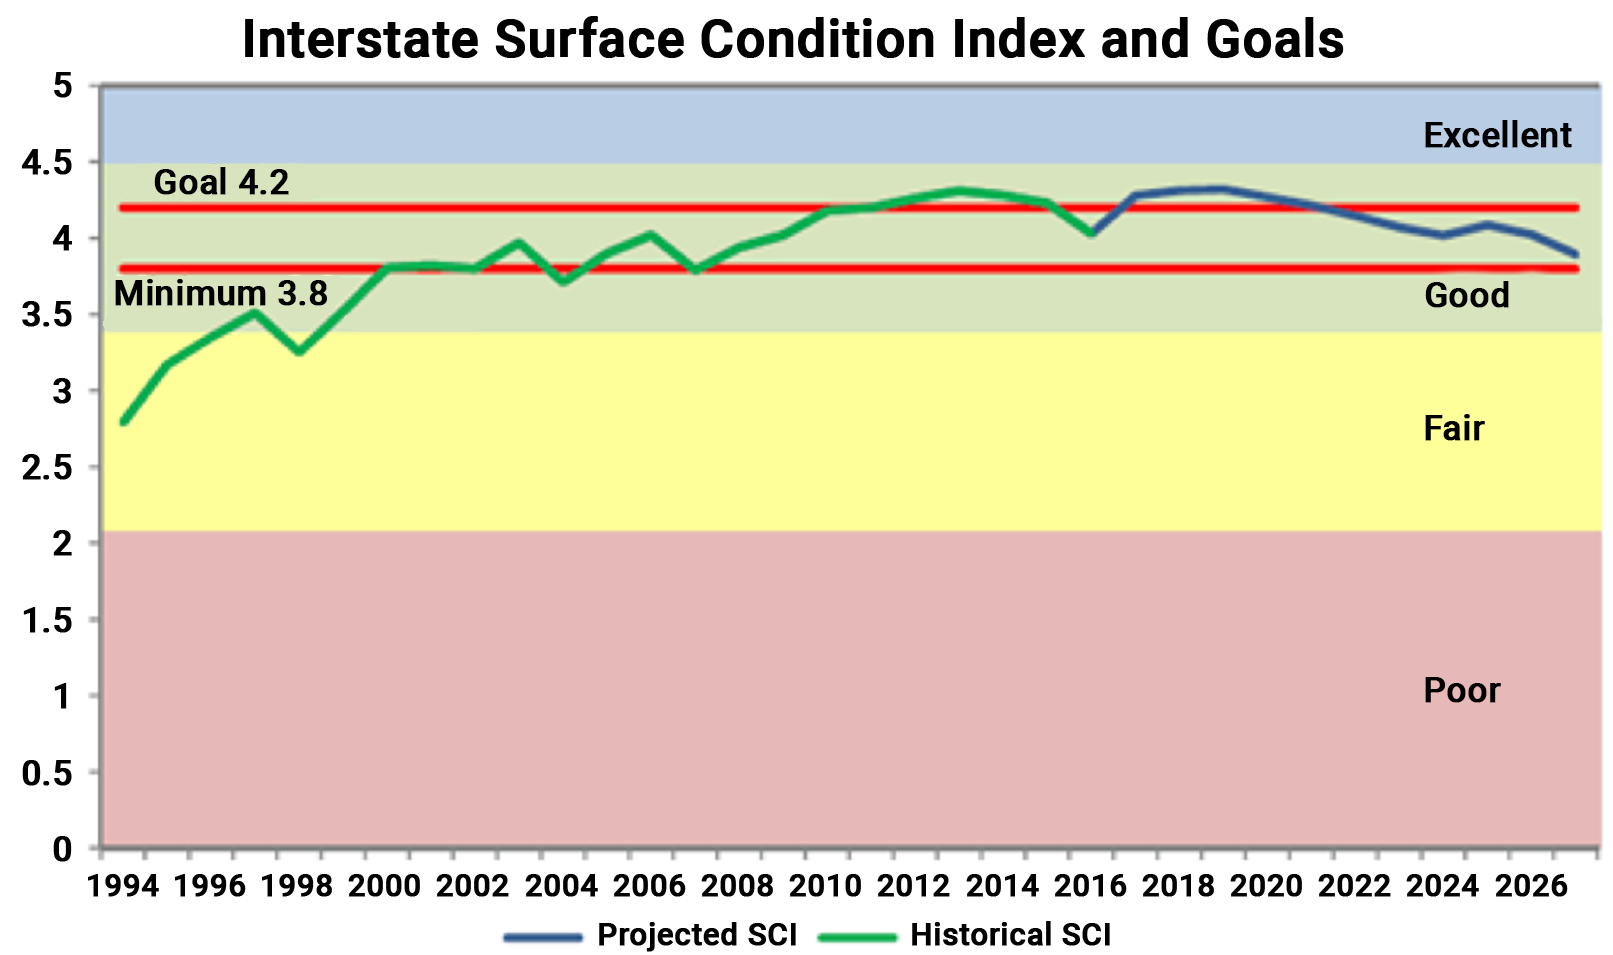
Source: South Dakota DOT Transportation Asset Management Plan. 2019. https://dot.sd.gov/media/documents/SDDOT2019TAMPFHWASubmittalrevised8-28-2019.pdf
Importance of Tracking Work Activities and Treatment Costs
This section describes the factors that should be considered for keeping a management system current.
Why It Is Important to Track Work Activities and Treatment Costs
Asset management systems, such as pavement and bridge management tools, rely on the availability of complete, up-to-date inventory information to serve as the basis for all system recommendations. At a minimum, the most recent work activity and completion date are necessary for establishing an asset’s age or the length of time since work was last performed. These factors are key to setting a maintenance service interval or predicting the need for future work. Treatment cost information is used to estimate the cost of recommended work activities, so realistic numbers are important for planning and budgeting.
Work Activities
The level of detail required to track work histories is largely dependent on the sophistication and maturity of the asset management program. It is important to have access to information indicating when the asset was installed or constructed, or when the most recent major work activities were performed. Additional information about maintenance activities performed to preserve or improve the asset is beneficial if it can be provided efficiently and incorporated into decisions about managing an asset over its life cycle.
An agency should incorporate completed work activities into a management system at least annually, at the end of each construction season. At a minimum, the asset management database should be updated to reflect any changes to the asset properties, such as a change from a concrete to an asphalt pavement, and the date when the change was made.
Treatment Costs
Including the cost of maintenance and rehabilitation activities in a computerized maintenance system provides a historical record of how treatment costs have changed over time. The information from the management system, as well as bid documents, can be used to establish unit costs for each type of work activity possibly recommended by the system. Unit prices for each work activity included in the system are needed.
For many transportation projects, improving the condition of the asset is only one part of the total cost of a project. There are many other costs to incorporate into the unit price when estimating the cost of a treatment recommendation, including the cost of pavement markings, guardrails and signs on a pavement project. If these costs are ignored, the cost of a project will be underestimated, and an agency may program more work than can be constructed over a given timeframe. Some agencies inflate treatment costs by a factor of 30 to 40 percent to ensure the costs associated with project design and the improvement of ancillary assets are considered in the unit cost for a given treatment. Using this approach, $0.30 to $0.40 is added to every dollar associated with the cost of the work itself. The inflated cost (e.g., $1.40) is stored in the management system as the unit cost for estimating treatment costs.
Different unit costs may also be established to reflect different costs in urban and rural areas, or in different geographic regions of a state. These differences improve the accuracy of asset budgeting activities by reflecting the realities agencies face due to work activities in highly congested areas, differences in the availability of contractors and the scarcity of materials in certain areas.
In addition to being used to estimate budget needs, treatment cost information serves many other purposes. For instance, the cost of a proposed project and its expected life can be used to determine a Return on Investment to help ensure that the most cost-effective projects are being selected. The information can also be used to compare the effectiveness of one treatment over another, or one life cycle strategy over another. Cost information has also been used to demonstrate the benefits to using proactive maintenance across a transportation network rather than reactive maintenance.
Montana, Tennessee, and Utah DOTs
Several state DOTs are employing the use of technology to track maintenance work activities as noted below.
When new assets are installed as part of a construction project for the Montana DOT, Construction personnel are required to provide Maintenance with the information needed for updating the asset inventory. Maintenance verifies the information provided by Construction before inputting it into the system.
The Tennessee DOT uses an automated data collection van to establish its asset inventory for approximately 20 assets. The inventory is entered into a maintenance management system at a summary level for each county and a “ghosting” technique is used to identify differences in the inventory from one year to the next year.
The Utah DOT extracts its asset inventory every two to three years from the LiDAR collected as part of the agency’s annual pavement condition surveys; however, the DOT is moving towards a continuous inventory updating process that would be the responsibility of Maintenance supervisors.
Establishing Business Processes to Support Work History and Cost Tracking
To ensure that work history and treatment cost information is kept current, business processes should be established to maintain the data over time. This section stresses the importance of building business processes to update the data regularly.
Assign Responsibility
One of the first steps in establishing business processes to support the maintenance of work history and cost information is assigning responsibility to the appropriate person for managing the information. The individual assigned responsibility for updating work history and cost data in the management system is not always the individual responsible for providing the data. For example, some agencies assign responsibility for updating completed work history and treatment cost information to the maintenance or construction division, since they are typically involved in closing out a project. Regardless of who is assigned responsibility for the task, a clear line of accountability should be established as part of the business process.
Establish Processes to Update Work Activities
Technology is improving agencies’ ability to track completed work activities (further discussed in Chapter 7), so the information is available for use in an asset management system. The access to handheld data entry devices with map interfaces linked to a centralized database helps ensure all users of the information have immediate access to current and consistent information. Business processes reliant on field personnel to remember to provide information to another data user are generally not sustainable.
To help establish a reliable approach for keeping asset data current, an agency may consider developing a data and process flow map illustrating the flow and use of data across the agency. This type of document helps an agency better understand where the data comes from, where it is stored, who uses the information and what levels of access various users need. A data and process flow map may become part of an agency’s data governance documentation in order to protect the integrity of asset data.
Build Buy-In To Support the Business Processes
Key to the success of any business process is establishing buy-in among the individuals responsible for each required step. This involves familiarizing the individuals with their responsibilities, providing tools and guidance for completing the activities efficiently and effectively and demonstrating how the information is used to support agency decisions.
Florida DOT
To ensure that the asset inventory remains current, the Florida DOT assigns district personnel responsibility for maintaining asset inventories and establishes guidance that no data in the inventory can be more than five years old. For new construction projects, it is required that the inventory be updated within 90 days of completion. The Florida DOT district offices develop a Quality Control (QC) plan and perform a QC check on the data at least once a year. The Florida DOT Central Office develops a Quality Assurance Review (QAR) plan and performs a QAR on the district’s QC process and spot checks the data in the field. As a result of these requirements, the Florida DOT has a high degree of confidence in the numbers used for budgeting activities.
Using Work History Information to Improve Models
The availability of current work history and performance data allows agencies to develop and improve models used in a management system to predict future conditions and determine treatment effectiveness. This section describes and illustrates the use of this data to improve existing models.
Developing and Improving Asset Deterioration Models
An important function of an asset management system is the ability to predict asset deterioration rates so changes in condition over time can be modeled for use in planning and programming activities. In the absence of data, models can be developed based on expert judgment, but as historical performance trends are established based on actual data, the expert models should be replaced by or calibrated against the real data.
The AASHTO Transportation Asset Management Guide: A Focus on Implementation (2011) introduced the following thought process to help an agency evaluate their deterioration models and determine whether improved data is needed to enhance future forecasts:
- If there is disagreement with the timing for recommending a treatment, what is the difference? Does a difference of one to two years make a substantial difference to the program? This type of difference is typically the result of the program optimization models.
- If there is disagreement with the treatment, are the differences substantial, such as deck repairs versus bridge replacement? These differences are often the result of treatment rules but may indicate that deterioration rates are not correct. The deterioration model parameters may need to change (e.g., change traffic considerations or geographic location) or there may have been some work performed that the model is not aware of.
- If the differences are irreconcilable, the agency may decide to investigate the model setup and analysis further or may conduct research to see how other agencies have resolved similar issues.
Determining Treatment Effectiveness
The availability of work history and performance data also makes it possible to determine the effectiveness of different types of treatments over time. By adding cost information to an effectiveness analysis, an agency can determine the long-term cost-effectiveness of different treatment strategies.
North Carolina DOT
The North Carolina DOT conducted an analysis to determine the effectiveness of an open-graded friction course and a surface constructed with a FC-2 (friction course) gradation. Data from the pavement management database was used, including inventory data, construction information and pavement condition ratings. The performance data were plotted against the survey year for each pavement section where one of the two types of surface friction courses was applied. The results showed the performance of the open-graded friction course dropped at year 10, while the FC-2 graded surface dropped in performance at year 8. The study also found that all FC-2 sections had received another treatment by year 11. The results from the analysis were used to increase the use of open-graded friction courses across the state.
South Dakota DOT
In 2011, the South Dakota DOT initiated a project to revise the pavement deterioration models developed in 1997 using 17 years of historical pavement condition data. The tool for developing the models included features allowing all the condition-versus-age data points for each pavement meeting the family description (based on surface type and pavement structure) to be plotted on a graph, facilitating a comparison of the historical model and the recommended model based on the updated pavement condition information. In this example, the blue line (labeled as the user-defined model) represents the model being used in the pavement management system for predicting faulting on a thick, short-jointed doweled concrete pavement and the gold line (labeled as the regression equation). The regression analysis on the historical data, represented by the red data points, indicates faulting is occurring at a much more accelerated rate than was previously predicted. As a result, recommendations for addressing faulting were likely lagging the actual need observed in the field.
Illustration Showing How Historical Data can be Used to Modify a Deterioration Model
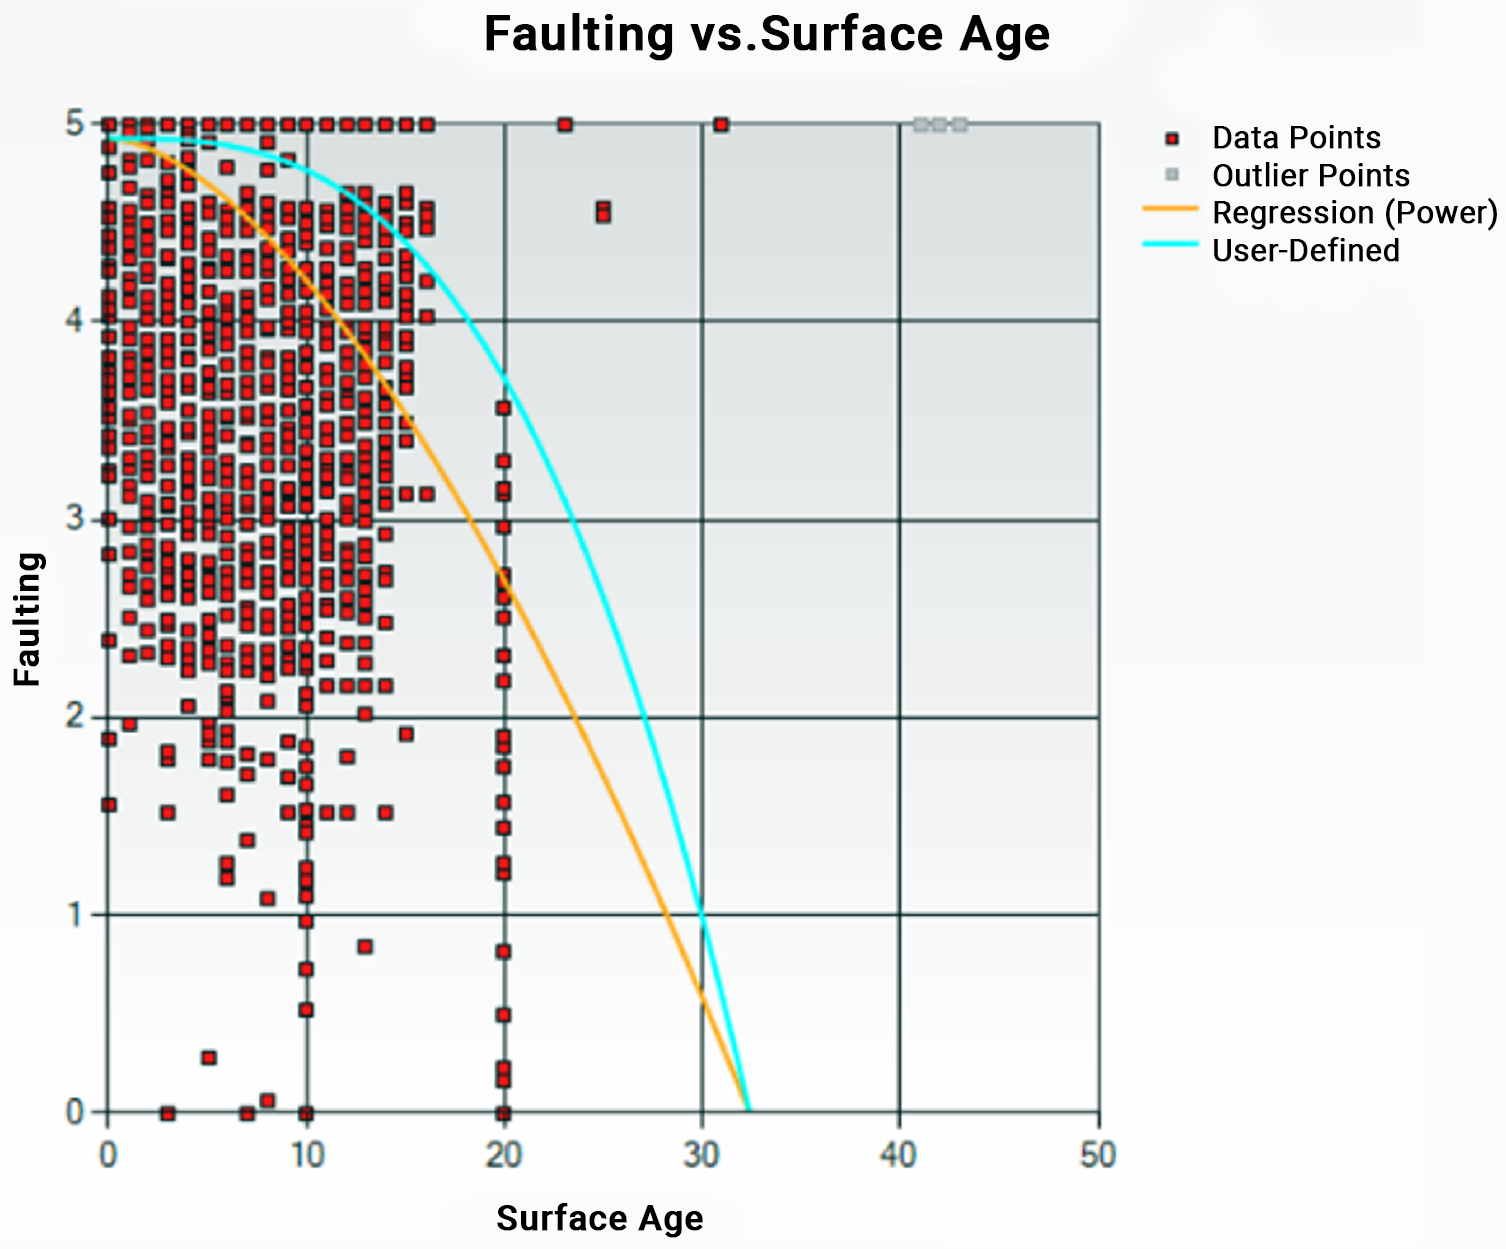
Source: South Dakota DOT. 2012. Technical Memo/Software Documentation
New Zealand Transport Agency
The Auckland Harbour Bridge corrosion protective coating system has been undergoing regular maintenance since the bridge opening in 1959. Historic practice was to spot abrasive blast corroded surfaces followed by spot painting and applying a full overcoat. While this process was effective in maintaining the protective coating, it also resulted in a significant amount of contaminates being discharged into the Waitematā Harbour despite the precautions being taken.
In an effort to reduce the discharge, various options have been considered taking into account the protective coating performance and longevity, with the aim to achieve the lowest practicable environmental discharge and whole of life costs.
One option involved collecting the abrasive blasting removal of the coating via the use of full scale containment to capture contaminants. However, it was found that this option would require strengthening of the bridge to safely carry the containment under wind loading at a cost of NZ$65M over a 10-year period.
As such, by undertaking a comprehensive review of the coating maintenance, a 40 years Coatings Maintenance Plan was developed. The identified lowest whole of life solution involved:
- On the land spans, use of full containment (where it could be supported from the ground), allowing for the full removal of the coating system via abrasive blasting, and its full reinstatement. These spans are to be left as long as possible before reinstating the protective coating, while ensuring minimal, if any section loss, to the steel superstructure.
- Spot repair and overcoating of other spans to maintain the existing coating for as long as practicably possible. A more proactive intervention approach is also adopted while using abseil techniques to minimize access costs.
- An outcomes based approach for consenting purposes that involved the establishment of low level discharge limits for contaminants deemed to be environmentally safe. This enables small areas of abrasive blasting without full containment for spans other than above land.
Thus, allowing for the continued corrosion protection of the bridge 125,000m2 external surface areas in a marine environment, while providing a cost effective and environmentally responsible solution.
Source: https://www.icevirtuallibrary.com/doi/abs/10.1680/jbren.18.00051
Toronto Transit Commission
The Toronto Transit Commission initiated a review to determine optimal bus life for their fleet as well as assess the potential for hybrid propulsion technology. Through specialized modeling methods, a data-driven approach was used to assess the total cost of ownership (TCO) for their fleet vehicles. This review analyzed historical asset work order records along with other capital and operating expenses to help identify the optimal asset life cycle. The four key areas analyzed were:
- Procurement/Installation: Asset Design Specifications & Procurement Cost
- Operations & Maintenance: Labor, Parts, Fuel (if applicable), Consumable Items and Outsourced Work
- Overhaul/Rehabilitation: Major Asset Refurbishment/Component Replacement Cost (ex. Transit Bus Transmission Rebuild or Facility Rehabilitation)
- Disposition: Salvage Value (End-of-Life)
The model provided insights on when the optimal time to dispose of a fleet vehicle to minimize overall fleet cost, the comparative TCO of different vehicle types, and the relative effect and up-time benefit gained for different operations and maintenance activities or rehab treatments, by engine or other component types used in the fleet. They advanced their understanding of treatment effectiveness and allowed them to make more informed decisions about fleet renewal.
Washington State DOT
The Washington State DOT conducted a pavement life cycle analysis using performance and cost data that demonstrated the cost-effectiveness of its pavement preservation projects. Based on the results that are documented in their 2019 Transportation Asset Management Plan (https://www.wsdot.wa.gov/sites/default/files/filefield_paths/WSDOT_TAMP_2019_Web.pdf), the DOT instituted a “one touch policy” requiring all capital projects to have had at least one pavement maintenance treatment by Maintenance or contracted work forces before it can be programmed for a pavement preservation project. This has enabled the DOT to defer capital improvements on pavements by two to three years, or in instances of multiple touches, by four to six years at a very low cost. In 2018, the agency received an additional $6 million to test a similar program on bridges. In addition to being a cost-effective use of available funds, the programs have helped build buy-in among maintenance personnel by demonstrating the importance of the data they collect.
Monitoring TAM Processes and Improvements
As discussed throughout this Guide, TAM is an on-going process that needs to be monitored regularly to ensure that it continues to support an agency’s business decisions. This section presents tools and methodologies used to accomplish this. It also builds on the application of some of the tools introduced in section 2.5.1, Assessing Current Practice.
Gap Assessment
A gap assessment is used to identify differences, or gaps, between an agency’s practices with those suggested as part of an established asset management framework. The results of a gap assessment can be used to identify changes in business processes that are needed or can serve as the basis for developing priorities as part of an asset management implementation plan. The gap analysis tool available through the AASHTO TAM Portal is an example of a tool that can be used by an agency to assess practices so they can be compared to desired, or more established, practices. A summary of the gap analysis tool and other frameworks for assessing current practice was presented in Figure 2.6. An example of a chart showing targeted and current ratings in eight assessment areas over a 2-year period is presented in Figure 6.7. While the agency’s targeted, or desired, scores remained consistently at a rating of 5 over both years, the graph is helpful for determining what assessment areas have improved over the 2-year period and which have not.
Figure 6.7 Example Comparing Assessment Area Scores from Two Different Rating Periods
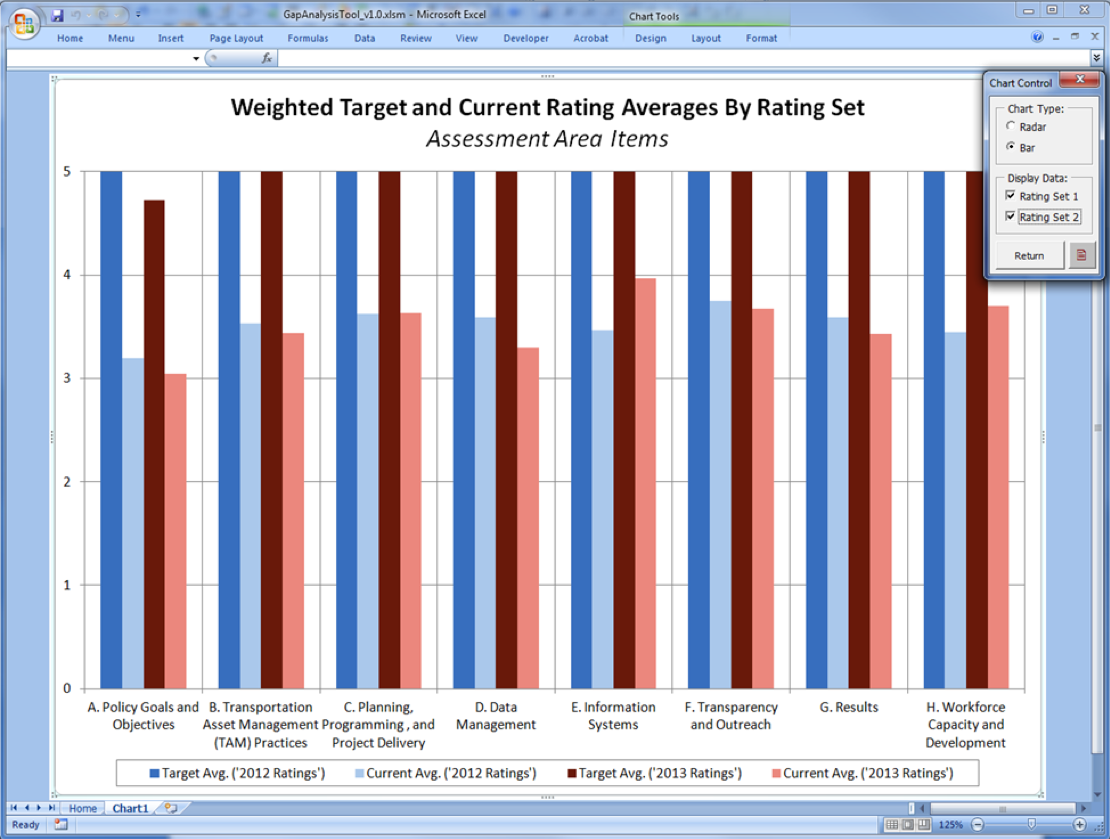
Source: AASHTO. 2015. Transportation Asset Management Gap Analysis Tool User Guide
Lean Six Sigma
A lean six sigma framework uses statistical analyses as part of a continuous improvement approach to evaluate the cause of defects and methodically make improvements to processes to eliminate them. Six sigma is widely used in manufacturing sectors, but can also be applied to many TAM functions. For instance, a six sigma analysis would be useful in analyzing the root cause of defects associated with a poorly-performing asset. Combining a six sigma approach with a Lean framework, which focuses on reducing waste, can help agencies develop more efficient and sustainable processes.
The New Brunswick Department of Transportation and Infrastructure (NB DTI) implemented Lean Six Sigma to better understand and document existing practices and identify where improvements could be implemented for savings or service improvement. The Lean Six Sigma methodology helps to improve performance through a collaborative process that systematically removes waste and reduces variation while improving customer satisfaction. For NBDTI, the application of this methodology has resulted in increased efficiency, cost savings, refined procurement methods, improvements to delivery of operational programs and services, and has supported the application of asset management decision-making to pavements, bridges, culverts, facilities and other transportation infrastructure.
ISO 33000 Process Assessment
The International Organization for Standardization (ISO) has introduced a variety of processes to support Asset Management. ISO 33000 is a standard for Process Assessment, providing a structured approach to help agencies better understand their processes, evaluate the suitability of their existing practices, and to determine the suitability of another organization’s processes as a way of improving practices.
The Balanced Scorecard
The Balanced Scorecard approach was initially developed to enable organizations to make complex tradeoff decisions that balanced different types of performance criteria. For example, the framework could be used to help determine the tradeoff between improving the level of service provided in a corridor with improving environmental sustainability on a statewide basis. The balanced scorecard analysis takes a holistic and balanced approach to these types of issues, by simultaneously evaluating competing and dissimilar needs (such as Customer Satisfaction, Sustainability, and Safety). The advantage to the balanced scorecard approach is the fact that multiple measures are considered, rather than a single set of measures that might disregard an important factor in the decision. The results produce a rational set of investment decisions that considers all of the factors that the agency views as most important to the final selection.
Integrating Asset Information Across the Life Cycle
As assets are designed, created, maintained, restored, and replaced, different systems are typically used to keep records of asset characteristics, conditions and work. Ideally, information created at one stage of the asset life cycle is made available for use at the next stage. Techniques, tools and processes are available to manage data for an asset over its entire life cycle from construction or acquisition to disposal.
Integrating information across the transportation infrastructure life cycle is an area of significant interest in the transportation industry. Several terms have been used to describe the collection of processes, standards and technologies for accomplishing such integration – including Civil Integrated Management (CIM) and Building Information Modeling (BIM) for Infrastructure. In 2019 ISO issued its first BIM standard, ISO Standard 19650. This builds on an earlier standard published by the British Standards Institute (BSI).
Traditionally, information created at one phase of the life cycle is archived and not made available to downstream processes. There are substantial opportunities for cost savings by using a shared, electronic model of the infrastructure, defining information needs at each life cycle phase, and establishing procedures for information handoffs across the life cycle. For example, information about assets included in a construction project can be compiled during design and linked to the model representations of the assets. This information can be confirmed and corrected during construction and made available to asset management systems when the project is completed and turned over to maintenance and operation.
Such integration can reduce duplicative data collection efforts, and speed the time required to make decisions and perform work. Implementing these techniques requires much more than adoption of technology supporting 2D and 3D models. A commitment to common standards and processes is needed. Recognizing that this scale of change takes time, maturity models and levels of implementation have been defined to guide agencies in developing roadmaps for enhancing life cycle information integration over time. See the references at the end of this chapter for further information.
Figure 7.3 Integrated Workflow Model for Sharing Information Across the Life Cycle Components
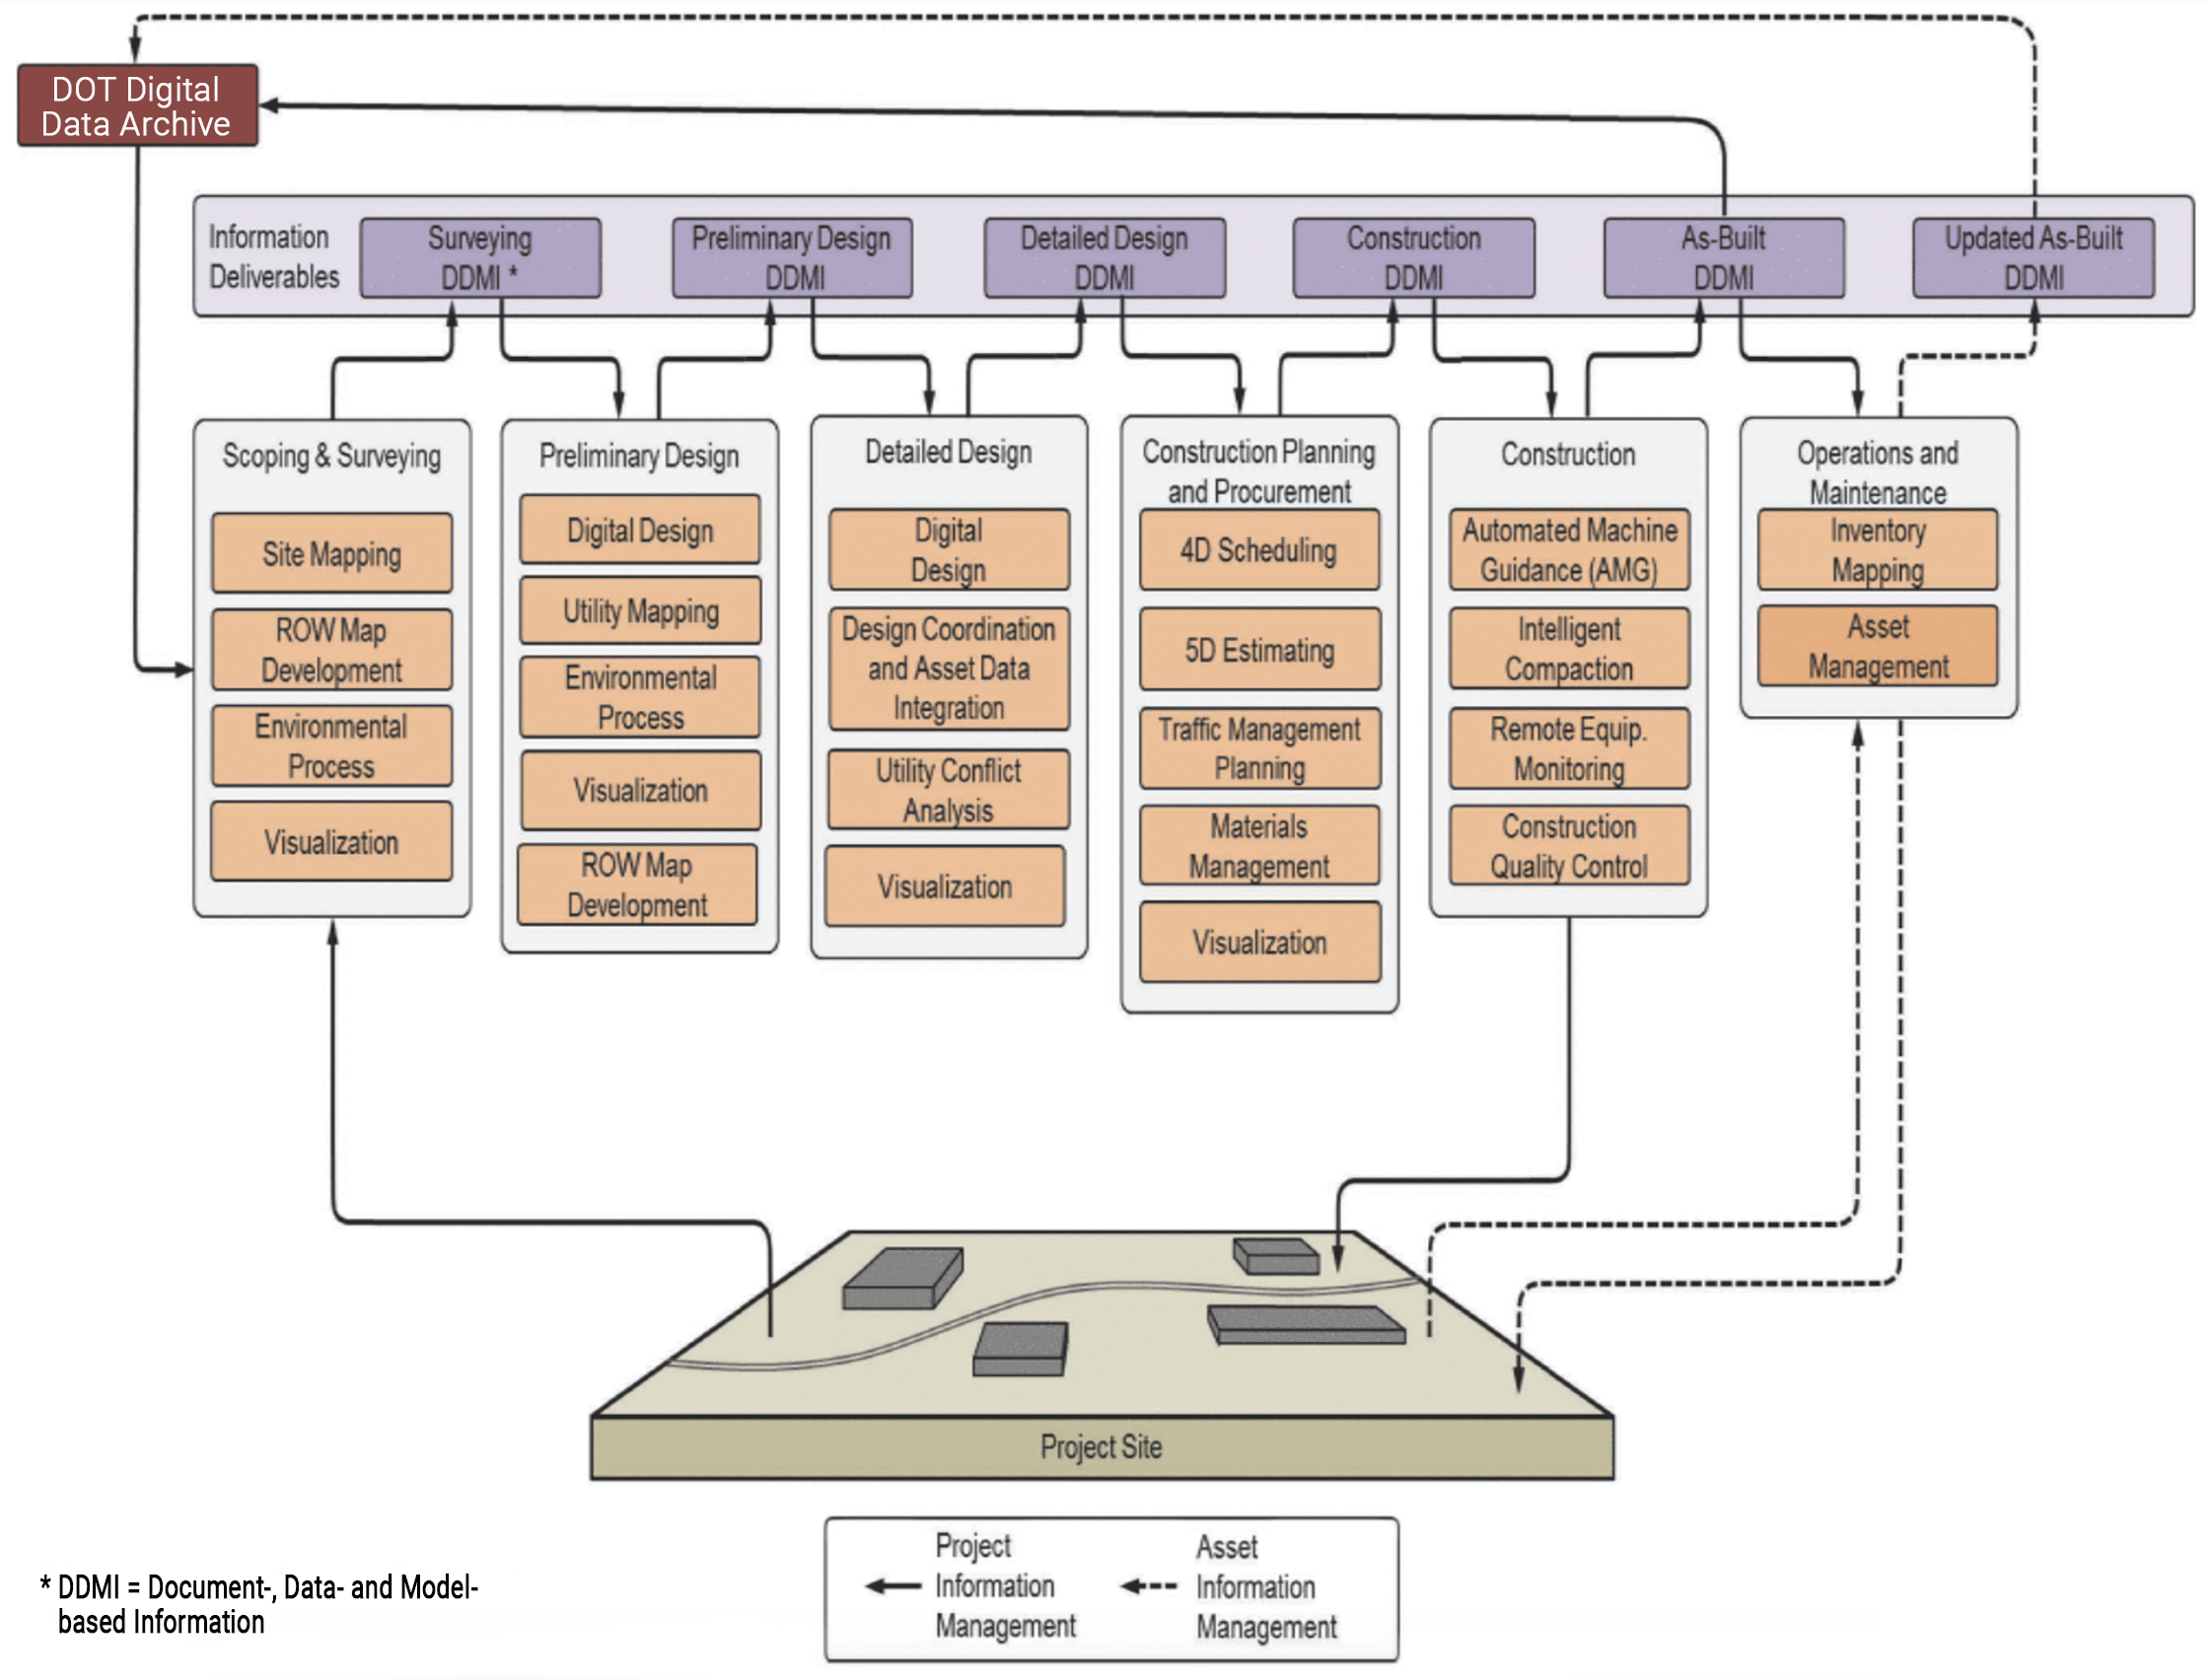
Transportation Research Board. 2016. Civil Integrated Management (CIM) for Departments of Transportation, Volume 1: Guidebook. https://www.nap.edu/read/23697/chapter/5#16
CrossRail
Crossrail is a major design-build project to construct a new railway line across central London (UK). It includes 42 km of track and 10 new underground stations. Project construction began in 2009. The project is being delivered by Crossrail Limited (CRL), currently a wholly owned subsidiary of Transport for London (TfL). Once the project is complete it will be operated by TfL as the Elizabeth Line. The Crossrail project provides a good example of the application of several BIM elements. Early on, CRL established the following objective:
To set a world-class standard in creating and managing data for constructing, operating and maintaining railways by:
- Exploiting the use of BIM by Crossrail, contractors and suppliers
- Adoption of Crossrail information into future infrastructure management (IM) and operator systems
CRL established a Common Data Environment (CDE) with integrated information about the project and the assets it includes. This environment included CAD models, separate linked databases containing asset details, GIS data, and specialized applications for scheduling, risk management and cost management. Data warehousing techniques were used to combine and display integrated information. Considerable work went into defining asset data requirements and setting up standard, well documented data structures and workflows to provide an orderly flow of information from design through construction, and on to maintenance and operation. It was essential to create a common information architecture given that work on each of Crossrail’s nine stations was conducted by different teams, each consisting of multiple contractors. Each station was comprised of over 15,000 individual assets.
Key elements of the approach included:
- A common asset information database with standard templates for deliverables. This database serves as the “master data source from which playlists of information can be created.”
- An asset breakdown structure (ABS) that relates facilities (e.g. stations) to functional units (e.g. retaining walls) to individual assets (e.g. steel piles).
- Asset naming, identification and labeling standards that distinguish functional duty requirements (e.g. a pump is needed here) from specific equipment in place fulfilling these requirements.
- Asset data dictionary definition documents (AD4s) that lay out the specific attributes to be associated with different types of assets, based on the ABS.
- Sourcing of the asset data from design and as-built information.
- A Project Information Handover Procedure specifying the methods of data and information handover for maintenance and operations once the construction has been completed.
- Use of a common projected coordinate system for CAD and GIS data
- Use of a federated data model in which information was maintained within separate special purpose systems, with a common master data model enabling sharing and interpretation of data from the different sources. The master model included elements such as time periods, budget and schedule versions, organizations, data owners, contractors, milestones and key events.
Sources:
https://learninglegacy.crossrail.co.uk/documents/building-a-spatial-infrastructure-for-crossrail/
BIM Lifecycle Information Management
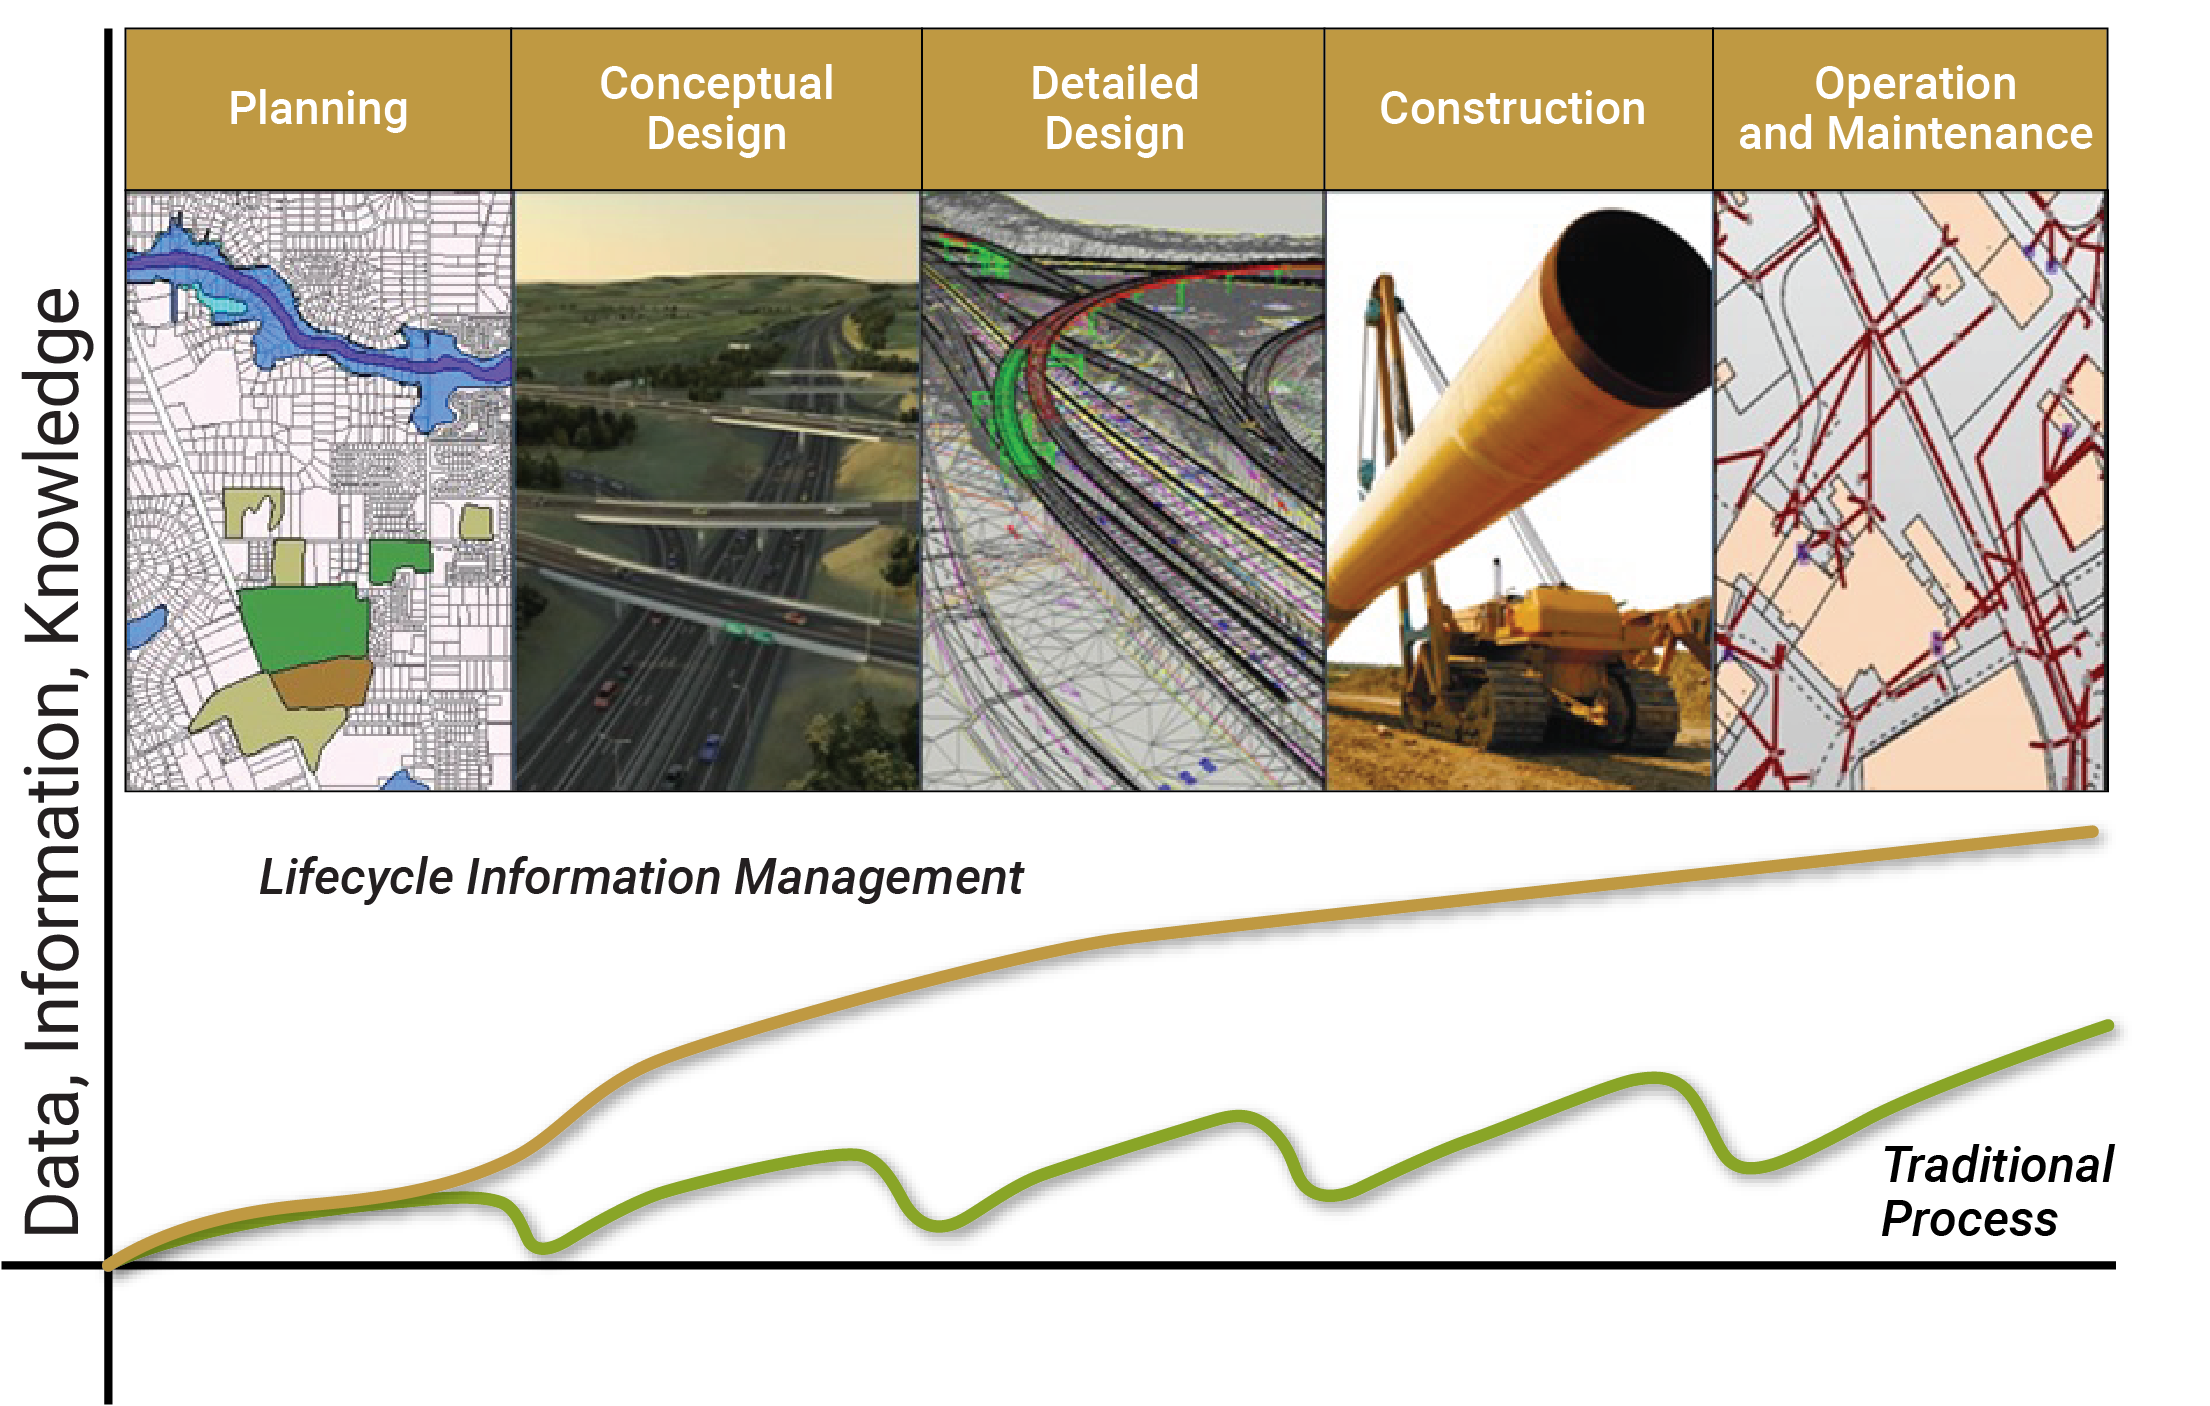
Source: Adapted from Crossrail. 2016. Building A Spatial Data Infrastructure For Crossrail. https://learninglegacy.crossrail.co.uk/documents/building-a-spatial-infrastructure-for-crossrail/
Practice Examples
Michigan DOT
MDOT’s strategic plan has seven strategic areas of focus. A key focus area is System Focus, which aims to provide cost-effective, integ…
Oklahoma DOT
The Oklahoma DOT identified the following TAM objectives to help guide their asset management program:
- Maintain (improve) th…
Amtrak
Amtrak’s Engineering Asset Management policy identifies guiding principles that the agency intends to use in managing the infrastructur…
Seattle DOT
Adopting Asset Management Principles
Seattle is one of the fastest growing cities in the U.S. and the demands on the transportation system have grown dramatically. Meanwhile…
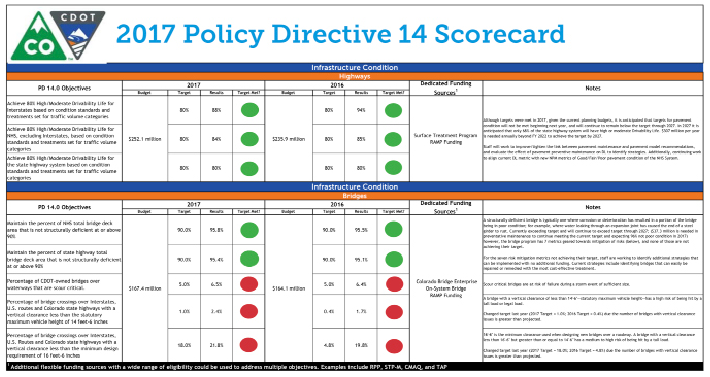
Colorado DOT
Creating an Asset Management Policy
In 2015, the Colorado Department of Transportation (CDOT) updated Policy Directive 14 (PD 14.0) “Policy Guiding Statewide Plan Developm…
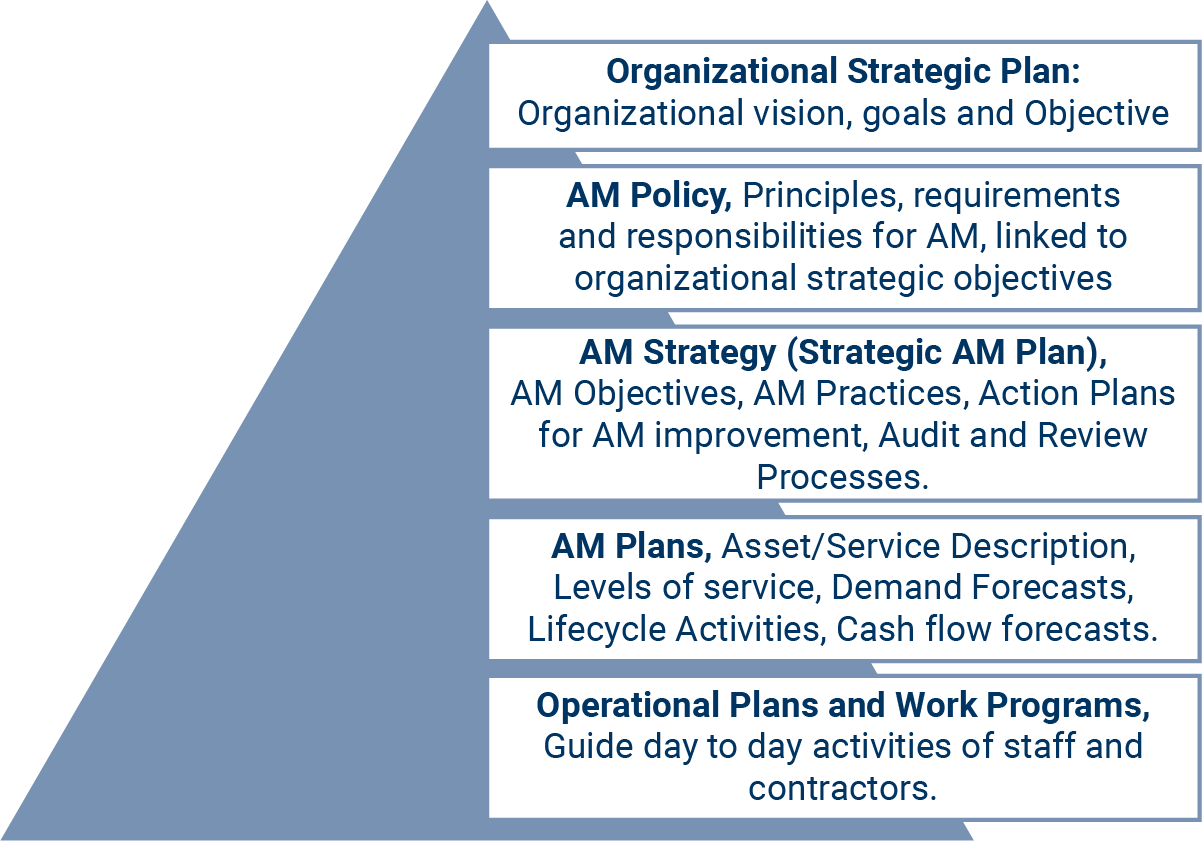
ISO 55000
Strategic Asset Management System
ISO 55000 adopts the concept of an Asset Management System, as the figure at right illustrates, which typically consists of several compo…
Montana DOT
Aligning a TAMP to Broader Planning Initiatives
When developing their 2018 TAMP MDT aligned their pavement performance targets and goals to those within their planning document TranPlan…
British Columbia
Alignment Between Policies, Investments, and Practices
To support the alignment of agency policies, objectives and day-to-day practices, the Province of British Columbia established the tiered…
Arkansas DOT
As part of the process of developing its 2018 TAMP, ARDOT developed a risk register and mitigation plan compliant with FHWA TAMP requirem…
Ohio DOT
Transportation Information Mapping System (TIMS)
Ohio DOT (ODOT) has focused on data and information management improvements as a foundational element of their asset management program. …
Amtrak
In 2016, Amtrak Engineering undertook an Asset Management Capability Assessment which bases maturity on the degree of formality and optim…
Utah DOT
To accomplish the objective of allocating transportation funding toward the most valuable assets and those with the highest risk to syste…
Practices
Integrating TAM Within Agency Strategic Plans & Policies
- Asset management principles are adhered to by some asset management advocates within the agency, but adherence to them is not universal.
- Investment is allocated within service areas (Transit, Highways, Active Transportation, Multi-model Systems) and the asset portfolios (pavements, bridges, transit fleet and facilities) that support them, based on the performance management targets that have been set.
- Asset management principles such as inter-generational equity, triple bottom line decision making, whole of life and service driven decision making can be found in some strategic plans, agency goals and high-level, long term planning documents.
- Investment is sometimes evaluated between asset portfolios (pavements, bridges, transit fleet and facilities), and funding is partially allocated based on a linkage to stated objectives.
- Asset management principles such as inter-generational equity, triple bottom line decision-making, whole life and service driven decision making are embedded within strategic plans, agency goals and high-level, long term planning documents.
- Investment is systematically allocated between service areas (Transit, Highways, Active Transportation, Multi-model Systems) and the asset portfolios (pavements, bridges, transit fleet and facilities) that support them, based on the requirements to achieve stated objectives and service level commitments.
Creating a TAM Policy
- An Asset Management Policy has been drafted or adopted by elected officials and is guiding in-progress changes to investment and operational decision making in the organization
- Policy principles are providing a basis for change and action in the delivery of services with infrastructure.
- An Asset Management Policy has been adopted and influences capital investment decision making in the organization
- The Policy is implemented at high levels within the organization, and its principles help determine overall focus on improving the asset management system action in the delivery of services with infrastructure.
- An Asset Management Policy has been adopted by elected officials and it strongly influences investment and operational decision making in the organization
- The Policy is implemented across the organization, and its principles strongly guide process, and action in the delivery of services with infrastructure.
Organizational Models
- There is an increasing awareness of asset management among staff in some key departments within the organization and they are piloting or demonstrating though leading practice. There is an understanding that service delivery and decision-making should follow a systematic approach.
- There is an organizational structure that supports implementing and sustaining asset management practices consistently in each department of the organization.
- There is a culture of asset management and an awareness among most staff that relationships exist between service delivery, infrastructure decision-making, and clear improvement actions to enhance the asset management system further.
- There is an organizational structure that supports the continuous improvement of asset management practices consistently across the organization.
- The is a culture of asset management and an awareness among all staff within the organization that touches all aspects of service delivery and infrastructure decision-making at the strategic tactical and operational levels.
- There is an organizational structure that supports implementing and sustaining asset management practices consistently across the organization. Embedded in the process are steps to continuously improve the organizational model and business processes.
Roles
- Roles and responsibilities associated with the Asset Management Framework and have been defined, and the organization has begun the transition to the planned management system approach.
- Senior leadership and some key staff involved in implementing asset management in the agency understand their role, and are accountable for ensuring asset management is embedded fully within the organization over time.
- Roles and responsibilities associated with the Asset Management Framework and its processes are defined in most departments.
- Key personnel in the organization including top management and other staff understand their role, and are accountable for ensuring asset management continuously improving across the organization.
- Roles and responsibilities associated with the asset management framework and its processes are clearly defined and are functioning effectively.
- Everyone in the organization, from top management, to field staff, understand their role, and who is accountable for ensuring asset management is embedded fully within the organization.
Competencies
- There is sporadic communication within the organization and externally to relevant stakeholders to help build support for the asset management framework and management systems.
- Staff have growing awareness, knowledge, and capabilities to perform their role in alignment to the asset management system.
- Attempts are made to implement change management strategies to improve and strengthen the asset management program.
- There is regular communication within the organization and externally by the agency that helps build support for the asset management framework and management systems.
- Key staff have an appropriate level of awareness, knowledge and capabilities to perform their role in implementing and improving the asset management system.
- Change management tactics are developed in response to resistance to implementing actions that strengthen the asset management program.
- There is consistent, aligned and supportive communication within the organization and externally to relevant stakeholders that helps build support for the asset management framework and management systems
- Staff have an appropriate level of awareness, knowledge and capabilities to perform their role in alignment to the asset management system.
- A well crafted change management strategy helps implement improvement actions that strengthen the asset management program.
Data and Systems for Life Cycle Management
- A computerized maintenance management system is being implemented/customized to better understand operations and maintenance activities within the agency.
- Some basic asset modeling is used to predict asset performance in the future for financial planning purposes.
- Computer management systems meeting the minimum federal requirements are implemented and used for compliance.
- A computerized maintenance management system captures operations and maintenance costs within the agency and assigns these to assets appropriately.
- Appropriate probabilistic and deterministic modeling techniques are used to predict asset performance for high value assets.
- A computerized maintenance management system captures operations and maintenance costs within the agency, and supports trade-off analysis between capital investment and operations and maintenance intervention alternative tactics
- Appropriate probabilistic and deterministic modeling techniques are used to predict asset performance in the future, and inform financial planning and intervention selection.
Managing Assets for their Life Cycle
- Alternative management strategies are considered for high value/critical asset classes in the portfolio and selected based on efficiency and effectiveness of the transportation network.
- Asset reliability is qualitatively considered in a systematic way for some asset classes.
- Reactive and interval-based approaches that are based on risk assessments are used where appropriate.
- Management strategies are periodically re-evaluated to determine if a change in management practice would be more effective.
- Deployment of maintenance crews, capital projects, and network operation resources are coordinated to ensure the right interventions are occurring in the right locations, at the right time on the transportation network to deliver mobility service levels at an acceptable cost and level of risk.
- Appropriate condition, interval and reactive based management strategies have been established for most asset classes.
- Asset reliability is well understood and is aligned with risk tolerance in the agency.
- Assets are planned, acquired and managed with an awareness of the costs, risks, and service performance characteristics over the entire life cycle.
- Appropriate management strategies are established and periodically re-evaluated to determine if a change in management practice would be more effective.
- Deployment of maintenance crews, capital projects, and network operation resources are coordinated to ensure the right interventions are occurring in the right locations, at the right time on the transportation network to deliver mobility service levels at an acceptable cost and level of risk.
- Appropriate condition, interval and reactive based management strategies have been established for every asset class in the portfolio, to support management of the transportation network efficiently and effectively.
- Asset reliability is well understood and is aligned with service expectations and risk tolerance in the agency.
- Strategic, tactical and operational activities directly consider alternatives that balance service delivery and investment of resources.
- Reactive and interval-based approaches that are based on risk assessments are used where appropriate.
- Management strategies are periodically re-evaluated to determine if a change in management practice would be more effective.
- Deployment of maintenance crews, capital projects, and network operation resources are coordinated to ensure the right interventions are occurring in the right locations, at the right time on the transportation network to deliver mobility service levels at an acceptable cost and level of risk.
Levels of Service
- Customers are identified, but outreach is not formalized.
- Some technical levels of service or KPIs are defined and considered when intervention alternatives are being evaluated.
- Customer groups are defined and some communication practices are in place to assess wants.
- KPIs are established, but may not be tightly tied to business decisions.
- Maintenance levels of service are established, but there is not a tight connection to KPIs.
- Technical levels of service are defined, and measured to evaluate the effectiveness of past investment and operational decisions.
- Customer groups are defined and clear policies and procedures are in place to assess wants.
- Customer-based KPIs and maintenance levels of service are established at the strategic, tactical, and operational levels.
- Agency performance is routinely measured and reported to all internal and external stakeholders.
Resource Allocation and Prioritization
- The goals of infrastructure investment and management are clearly defined.
- The long-term investment requirements are understood for all asset classes in the existing portfolio and is based on at least a 20-year horizon to capture near term investment needs and is based on known intervention and replacement costs.
- Investment prioritization is directly linked to goals for the agency.
- A systematic, repeatable approach is used to allocate resources for high value assets in some departments who are managing infrastructure.
- Alternative delivery options considered where problematic issues are encountered.
- The goals of infrastructure investment and management are clearly defined.
- The long-term investment requirements are understood for all asset classes in the existing portfolio, and is based on at least a 20 year horizon, as appropriate to capture all known large interventions for high value assets, and is based on known intervention and replacement costs.
- Investment prioritization is directly linked to goals and performance measures are qualitatively evaluated in the prioritization process.
- A systematic, repeatable approach is used to allocate resources, and the process is well understood by key decision-makers in the agency.
- Resource allocation methods are trending to become consistent across the agency in the near term.
- Alternative delivery options are periodically evaluated in some departments to consider alternative use of resources for service delivery.
- The goals of infrastructure investment and management are clearly defined.
- The long-term investment requirements are understood for all asset classes in the existing portfolio, and is based a sufficient horizon to capture the expected service life for all owned assets, and is based on known intervention and replacement costs.
- Investment prioritization is directly linked to goals, performance measures and evaluated against the constraints that may exist for the agency.
- A systematic, repeatable approach is used to allocate resources, and the process is well understood and employed across the agency by all departments managing infrastructure.
- Resource allocation methods are consistent across the agency and supports cross-asset resource allocation methods, where appropriate.
- Alternative service delivery options are periodically evaluated systematically to ensure the best use resources for service delivery.
Cross Asset Resource Allocation
- Basic decision support tools are embedded across the organization and used to qualitatively inform decision-making for funding allocation between asset classes.
- Multi-objective allocation approaches are being considered or trialed to allocate funding across asset classes to balance risk, service delivery and investment.
- Service levels and associated performance measures are evaluated and considered for allocation decisions
- Decision support tools including computerized systems are being procured or implemented to inform decision-making for funding allocation in the future near term.
- Appropriate multi-objective allocation approaches are established in the agency and employed to allocate funding across asset classes to balance risk, service delivery and investment.
- Service levels and associated performance measures are evaluated and linked directly with allocation decisions
- Decision support tools including computerized systems are embedded across the organization, and used to inform decision-making for funding allocation.
Performance Measurement and Management
- Some key performance measures are established within the organization and are beginning to be measured.
- Performance measures are periodically reviewed and enhanced over time.
- Regular reporting of progress with trends tracked over time.
- Performance measures are established within the organization and provide a strong linkage between agency objectives and the processes for capital decisions.
- Regular reporting of progress with clear trends indicating improvement.
- Performance measures are well established within the organization and provide a strong linkage between agency objectives and the processes for capital and operational decisions.
- Performance measures are directly used to prioritize investment needs.
- Regular reporting of progress with clear trends indicating significant improvement over time.
Monitoring the State of Assets
- Asset data collection and management is in transition to better support timely and accurate performance reporting.
- The performance measurement framework is evolving to improve goal alignment and trend the agency to desired outcomes.
- Asset data collection and management supports performance reporting.
- Periodic review of performance measurement framework is carried out to confirm measures are appropriate, aligned with objectives and suitable to trend the agency to desired outcomes.
Monitoring Funding and Resource Allocation Methods
- Trend analysis is employed by the agency to help identify potential adjustments to improve performance targets.
- Trend analysis and other analytical tools are being trialed by the agency to help identify potential adjustment actions to improve performance.
- Current status is understood by all internal stakeholders, and resource allocation in some departments is supported by informed decision-making.
- Trend analysis, performance forecasting and other analytical tools are employed by the agency to help identify potential adjustments to operational, tactical or strategic actions to help achieve performance targets.
- Current status is understood by all internal and external stakeholders, and resource allocation is supported by informed decision-making.
Monitoring Asset Work and Costs
- The agency is improving its ability to track operations and maintenance costs and capital investments and link them to assets in the portfolio.
- Some departments can analyze the effectiveness and efficiency of their alternative interventions.
- The agency tracks operations and maintenance costs and capital investments, and these are linked to the asset to which they apply.
- Analysis is periodically carried out to assess efficiency of alternative interventions.
- The agency has accurate method of tracking operations and maintenance costs and capital investments, and these are linked to the asset to which they apply.
- Analysis is periodically carried out to assess the effectiveness and efficiency of the alternative interventions and trade-off between maintenance and capital decisions.
Tracking and Managing Risks
- The agency has identified some operational risks, manage them in a risk register and have established targeted mitigation strategies.
- The agency has an integrated risk management framework that allows risk to be employed at a more than one level within the agency.
- High risks are proactively managed or leveraged.
- The agency has an integrated risk management framework that allows risk to be employed at strategic, tactical, and operational levels.
- Risks are proactively managed or leveraged.
- Managed risks show reduced frequency of negative consequences or opportunities are captured as appropriate.
- TAM processes are evaluated regularly for improvement.
Collecting Asset Data
- Collection occurs periodically and data is maintained, current and accurate.
- Data collection strategies are targeted to agency decision-making requirements.
- Collection occurs periodically and data is maintained, current and accurate.
- Data collection strategies are targeted to agency decision-making requirements, and collection resources add value.
- Collection occurs periodically and data is maintained, current and accurate.
Information and Systems
- Agency information systems are unintegrated, however the current portfolio of systems are well mapped, and an improvement plan is in progress to improve integration toward a clearly defined future state that is suited to agency requirements.
- Agency information systems are partially integrated, interconnected and a plan is being implemented to create a system that is suited to agency requirements.
- Agency information systems are fully integrated. Systems supporting inventory management, data warehouses and statistics, inspections and condition assessments, maintenance management, performance modeling, analytics, forecasting and financial systems are interconnected and are suited to agency requirements.
Asset Data Sharing, Reporting and Visualization
- Information is available to most stakeholders and allow for improving decisions over time.
- Data and analysis presentation is improving with a plan for consistency across the agency.
- Information is available to most stakeholders and allow for informed, supported decisions
- Data and analysis presentation is improving and is targeted to key decision-makers, and consistent across the agency.
- Information is available to all stakeholders and allow for informed, supported decisions
- Data and analysis presentation is well crafted, easy to understand for the targeted audience, and consistent across the agency.
Data Governance and Management
- Data governance and management practices are being established with a gap assessment identifying an improvement strategy over time.
- Data governance and management practices well established and support continuous improvement in data systems.
- Data governance and management practices well established and support reliable, consistent, integrated and accessible data systems
- Governance frameworks are reviewed periodically to ensure it evolves with agency requirements.
How To Guides
Prioritize Assets for TAM Advancement
Establish Customer-Based Service Level Targets
Life Cycle Planning for Pavements
Determine What Data Is Needed to Support Life Cycle Management
Implement a Multi-Objective Decision Analysis (MODA) Approach
Benchmark Performance
Checklists
Considerations to Support the Successful Implementation of a Life Cycle Approach to Managing Assets
Preparing a TAM Financial Plan
Work Planning and Delivery
Characteristics of Strong Performance Measures for Managing the Condition of Ancillary Assets